
The 10 states where it's hardest to live and work
It's hard enough to get by — and, according to a new study, these 10 states don't make it any easier

Westend61 / Getty Images
A sizable chunk of Americans are struggling to get by. Surveys show at least one in three households is living paycheck to paycheck, wages are stagnating, and the job market is a mess. And where you live could be making things worse.
The Law Offices of James Scott Farrin, injury lawyers in the Carolinas, set out to find the states making it the hardest to live and work in 2025.
It considered various factors in its study, including annual income, living expenses, spare money potential, weekly work hours, unemployment rates, insurance coverage, safety ratings, and commute times. It also created a safety index out of 100 for each state.
The firm said its research shows, in part, that safety helps people financially. “In states with higher crime rates, residents pay more for many things, including personal and home insurance,” said James Scott Farrin. “When incomes are already low, these extra safety costs take a bigger bite out of family budgets.”
Continue reading to see which states made the list and why.
10th worst: Wyoming

Dean Fikar / Getty Images
Wyoming ranks 10th with an average yearly income of $61,866, an annual cost of living of $47,567, an unemployment rate of 3.3%, a safety index of 55.9, and 47.8% of employees insured.
9th worst: Maine

Dermot Conlan / Getty Images
Maine ranks 9th with an average yearly income of $66,369, an annual cost of living of $47,321, an unemployment rate of 3.2%, a safety index of 64.2, and 46.4% of employees insured.
8th worst: Hawaii

RyanJLane / Getty Images
Hawaii ranks 8th with an average yearly income of $78,745, an annual cost of living of $69,434, an unemployment rate of 2.7%, a safety index of 60.1, and 50% of employees insured.
7th worst: Mississippi
John Coletti / Getty Images
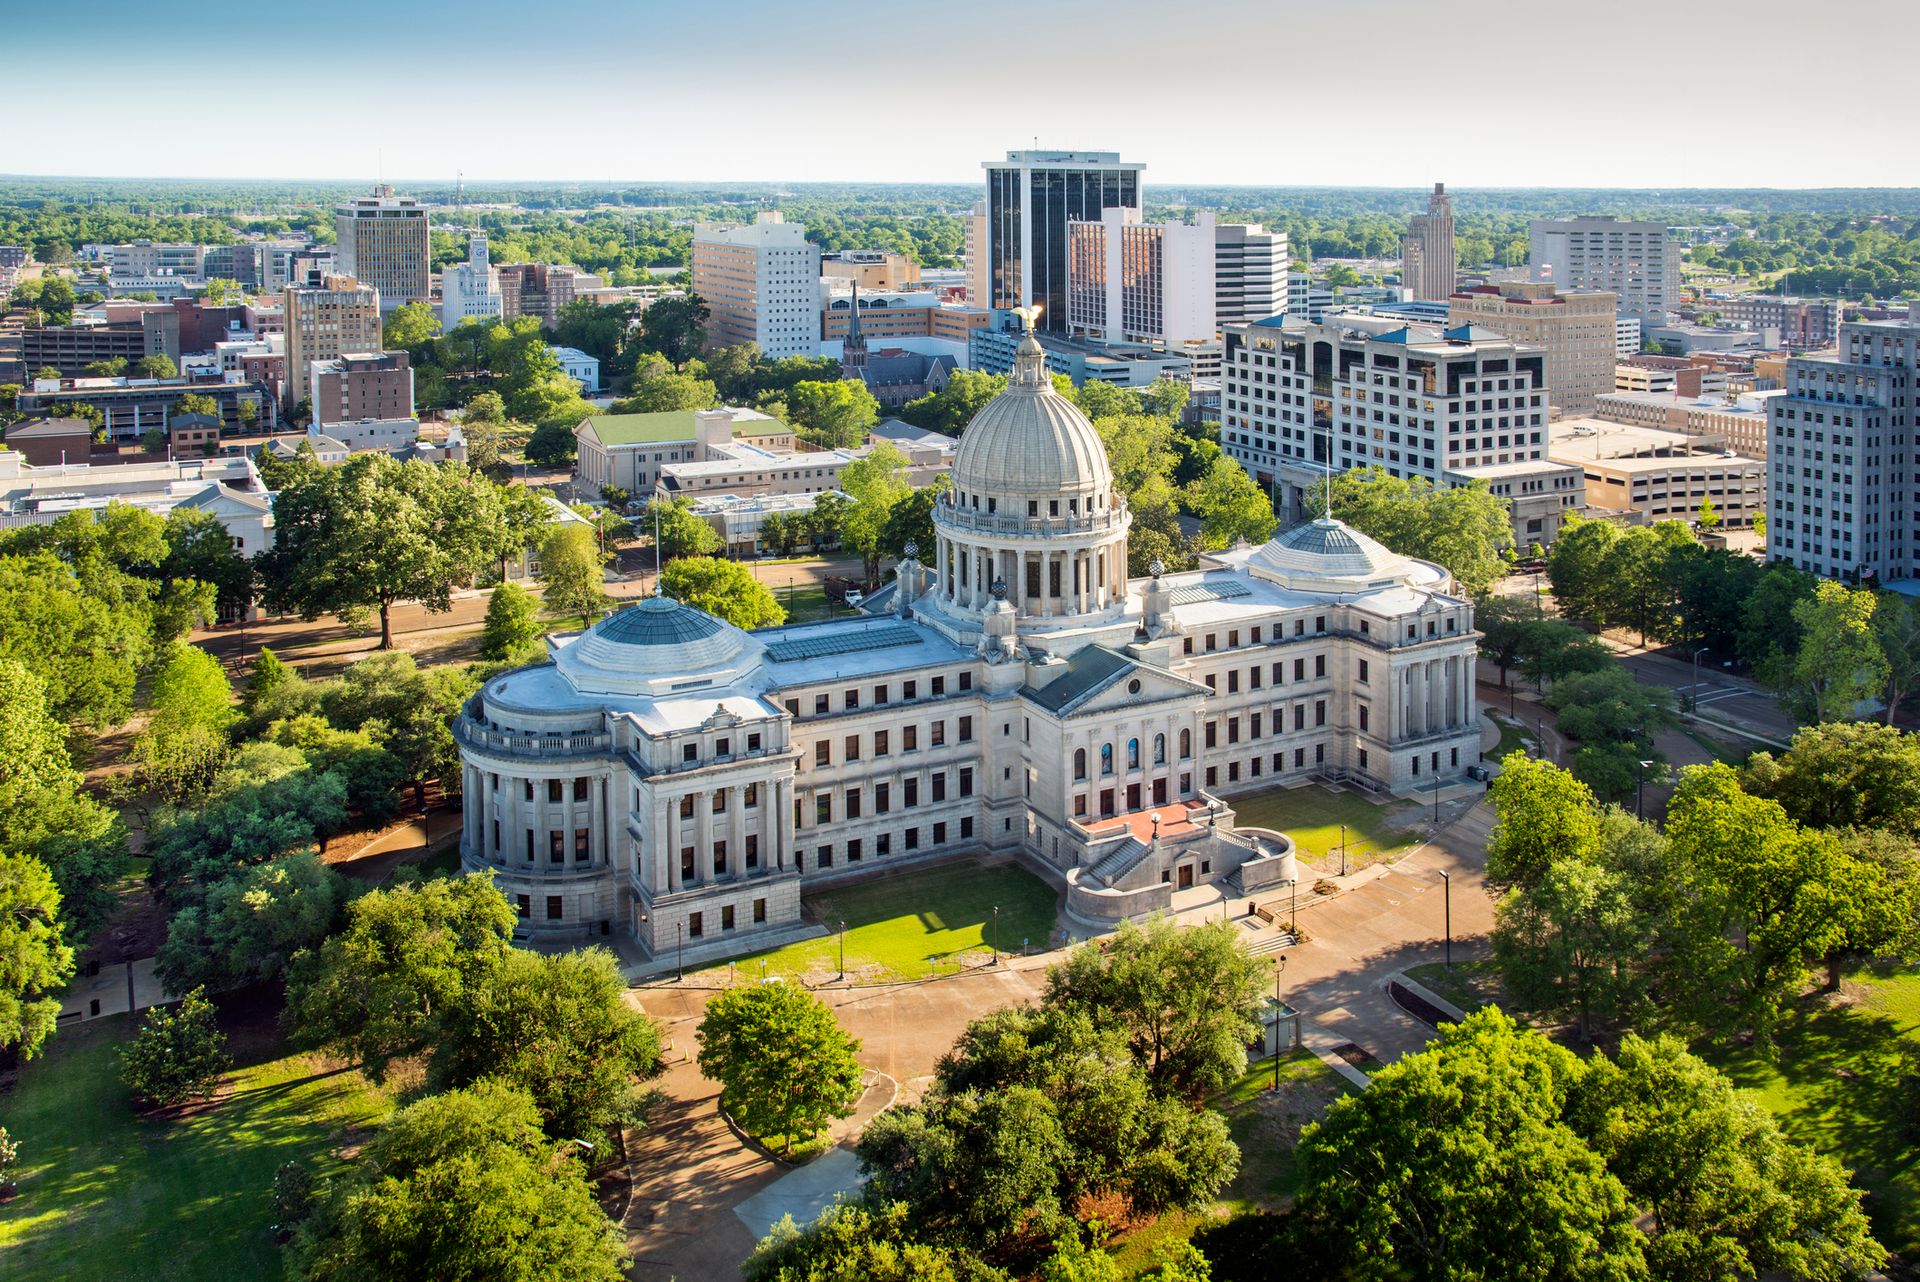
Mississippi ranks 7th with an average yearly income of $51,554, an annual cost of living of $42,632, an unemployment rate of 4.0%, a safety index of 35.1, and 42.7% of employees insured.
6th worst: West Virginia

Brett Maurer / Getty Images
West Virginia ranks 6th with an average yearly income of $57,979, an annual cost of living of $44,637, an unemployment rate of 3.7%, a safety index of 49.1, and 44.3% of employees insured.
5th worst: New Mexico

MonaMakela / Getty Images
New Mexico ranks 5th with an average yearly income of $56,766, an annual cost of living of $41,481, an unemployment rate of 4.2%, a safety index of 48.0, and 34.6% of employees insured.
4th worst: Louisiana
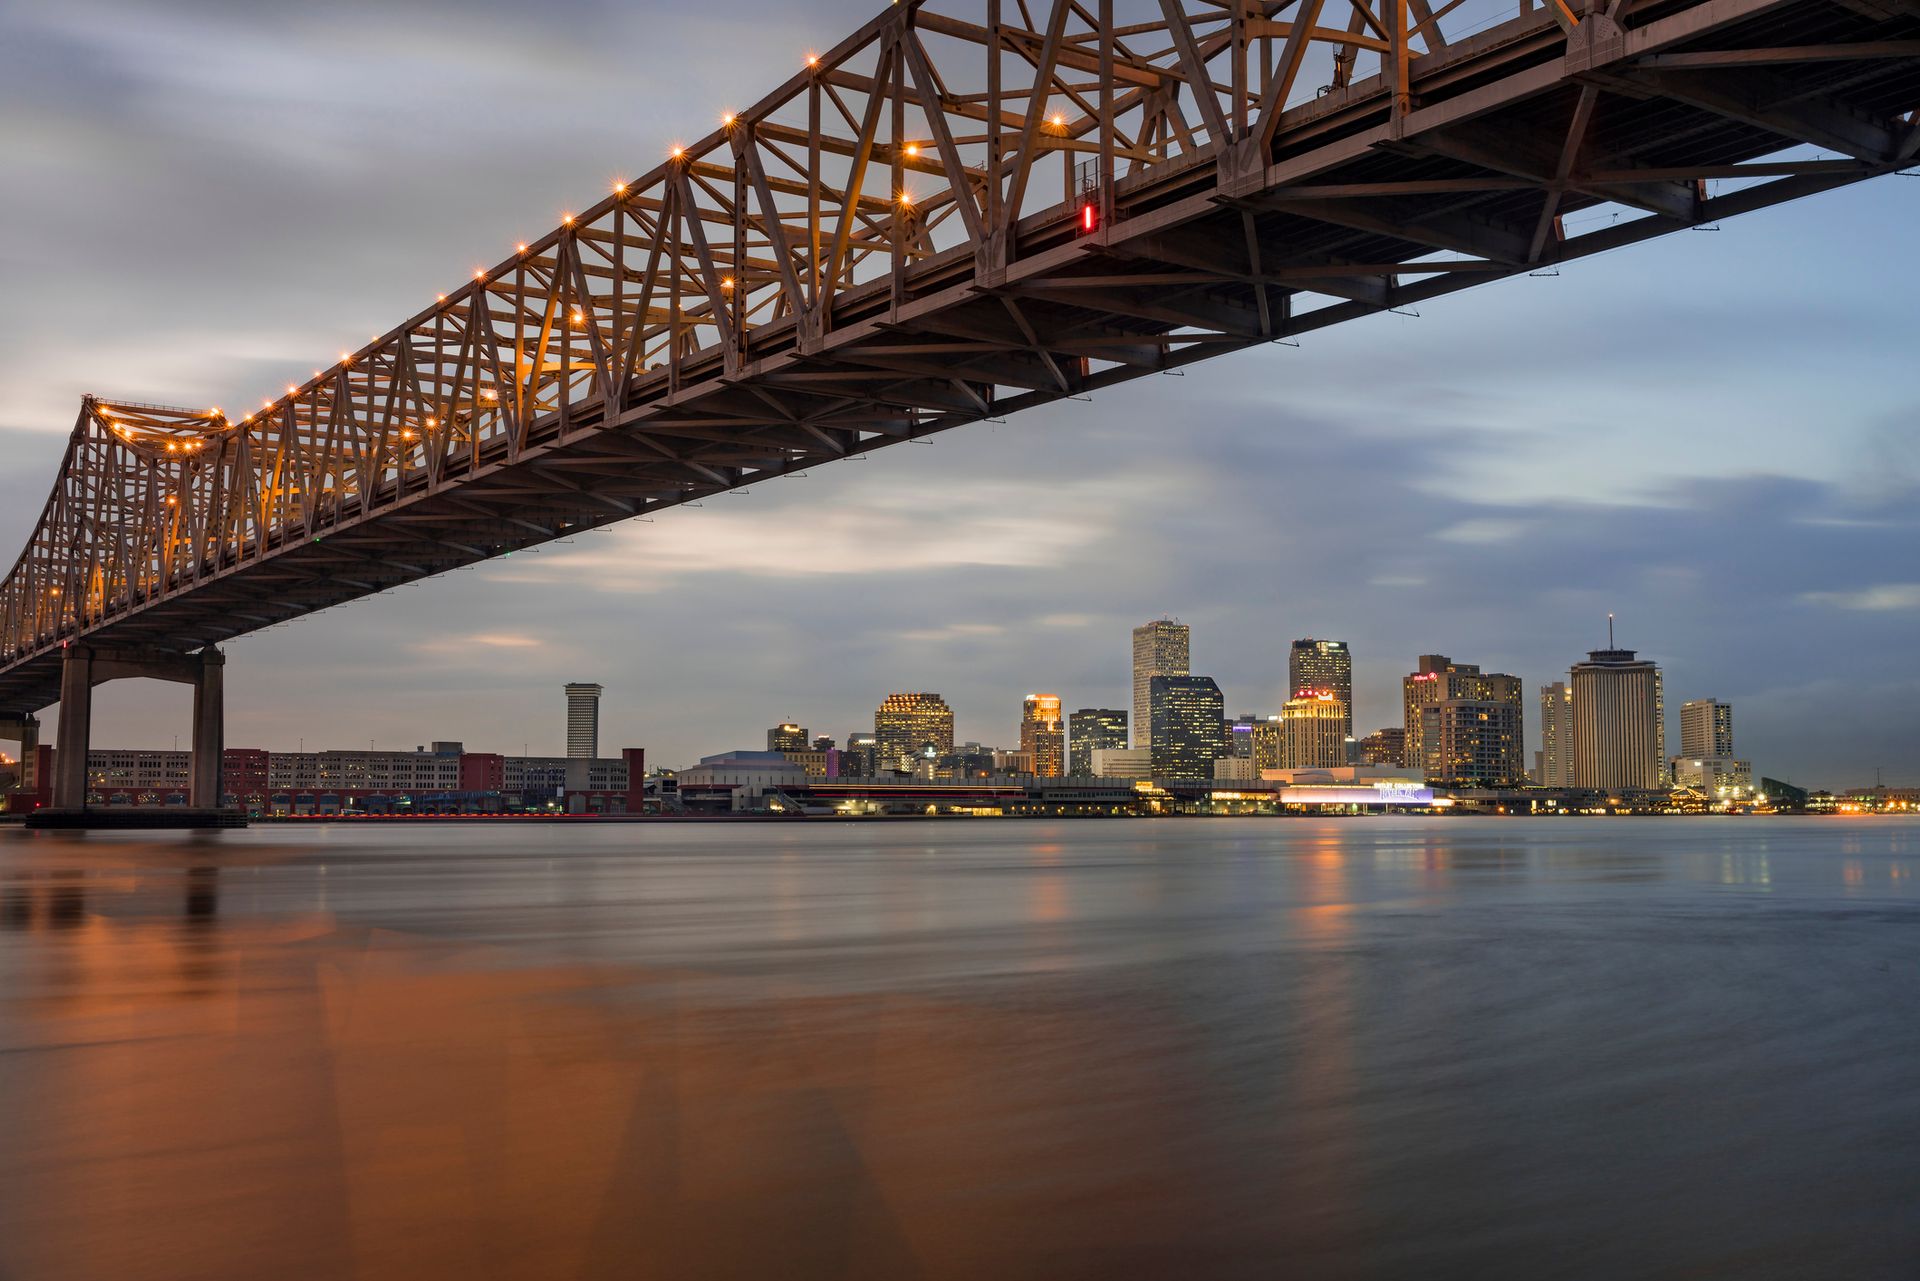
Image by Erik Pronske Photography / Getty Images
Louisiana ranks 4th with an average yearly income of $53,821, an annual cost of living of $40,749, an unemployment rate of 4.5%, a safety index of 33.3, and 40.9% of employees insured.
3rd worst: Rhode Island

Walter Bibikow / Getty Images
Rhode Island ranks 3rd with an average yearly income of $72,515, an annual cost of living of $61,265, an unemployment rate of 4.8%, a safety index of 57.5, and 50.8% of employees insured.
2nd worst: Kentucky
-1920x1438.jpg)
Posnov / Getty Images
Kentucky ranks 2nd with an average yearly income of $57,509, an annual cost of living of $44,027, an unemployment rate of 4.9%, a safety index of 52.7, and 46.1% of employees insured.
Worst: Vermont
Westend61 / Getty Images
Vermont ranks as the worst state to live and work in, according to the study, with an average yearly income of $65,712, an annual cost of living of $62,260, an unemployment rate of 2.6%, a safety index of 67.9, and 48.8% of employees insured.