The Fed has created enormous amounts of money in the last few years. Currently, it is doing it at the rate of $85 billion per month. You would expect that, at this rate, the economy would be quite unstable. Yet, the Fed and most observers feel secure in their belief that the economy is stable and far away from the horrors of the 1970s, when a smaller binge of monetary creation led to very high rates of inflation.
Is that so?
The answer is no. The economy only looks stable. Beneath the surface, the Fed is creating the conditions to have a breakdown worse than that of 2008.
Inflation as the measure of imbalances
The Fed guides its monetary policies with a simple rule in two parts: you should keep on printing money as long as unemployment is high and inflation is low. Stop doing it when inflation starts to rise.
The rationale of the first part of this rule is that (a) injecting money in the economy increases domestic demand; (b) higher demand elicits increased production; and (c) increased production increases employment. Thus, the Fed can meet one of its two main objectives, maximizing employment, by printing money.
The rationale of the second part is that there is a limit to the rate of growth of production, given by the installed industrial capacity, the managerial abilities, the maximum rate of extraction of raw materials and similar constraints. When the Fed’s monetary creation exceeds the economy’s ability to grow, further monetary creation does not go to stimulate production. It destabilizes the economy in more than one way.
The Fed uses one single indicator to know that it is crossing this boundary: the rate of inflation. When prices start rising beyond a certain rate, the Fed knows that the money it is printing is not eliciting more production but only leading to higher prices. At this point, it ceases to create money. This is consistent with the Fed’s second main objective: to keep prices stable.
Fair enough. The problem is that inflation is not the only symptom of demand and supply disequilibrium.
The other imbalances in a real economy
In a real economy, like that of the United States, things can be imported. Thus, excess demand can leak out of the economy and stimulate producers abroad. If demand leaks in this way, excess demand does not produce inflation but, instead, current account deficits in the balance of payments (CAD, which appear when imports exceed exports). Since these deficits are settled with debt, countries pay for this excessive demand not with higher prices but with higher debt.
Thus, the measurement of imbalances should include two components: inflation and current account deficits. Adding the share of nominal GDP that is wasted in price increases (inflation) and the share of GDP that goes abroad (current account deficits as a percent of GDP) you get a measure of the extent to which monetary creation does not spur more domestic production but only price increases and more imports.
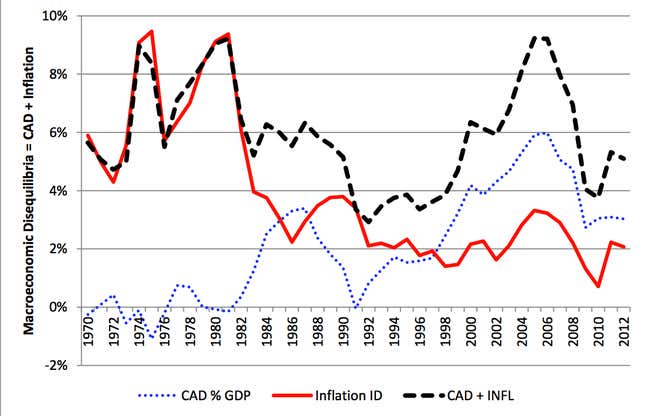
As shown in the next graph, using this measure of excess demand changes the perception of the monetary history of the last forty years. The conventional idea is that the monetary policies of the 1970s destabilized the economy; that Paul Volker, Fed chairman from 1979 to 1987 stabilized it, and that then Greenspan (1987-2006) and Bernanke (still going since 2006) kept it quite stable in spite of the large amounts of money they created. This idea was based on the red line depicting inflation in the graph, which increased in the 1970s, declined in the early 1980s and remained approximately constant in the next two decades.
But this is only inflation. When we add the current account deficits it becomes clear that the Greenspan years were as unstable as the 1970s. Altogether, the share of demand that did not elicit higher domestic production reached peaks of 9% in both the 1970s and the late 2000s. The only difference was that disequilibrium manifested itself almost wholly in terms of inflation in the 1970s and early 1980s, and almost wholly in terms of current account deficits in the 1990s and 2000s.

The country did not pay with higher inflation the Fed’s excesses of the 2000s because large net imports did not allow prices to go up. Instead, total debt to the rest of the world increased from $2.5 trillion (25% of GDP) in 2000 to $9.4 trillion (61% of GDP) in 2012, according to the Fed.
The Fed and the imbalances
Are these imbalances related to monetary creation?
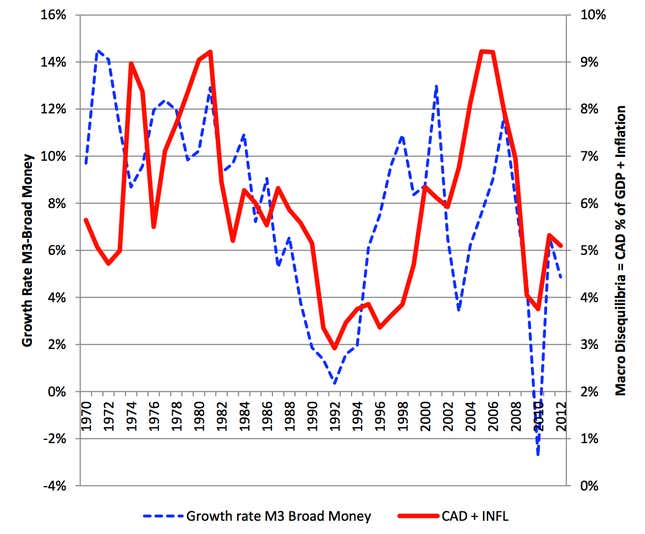
Certainly. The graph below shows how excess demand has increased and declined in accordance with the growth of broad money (cash plus deposits and other banks’ liabilities that their customers can easily convert into cash) during the last forty years. The faster the Fed has created money, the higher the proportion of demand growth that results in inflation and current account deficits rather than in increased domestic production.

Bursting the bubbles
Now you can note that the indicator of disequilibrium we just created (the sum of inflation and the current account deficit as a percent of GDP) has diminished in the last few years from their peak in 2006. Does this mean that the Fed is right when saying that the economy is stable?
The answer is no.
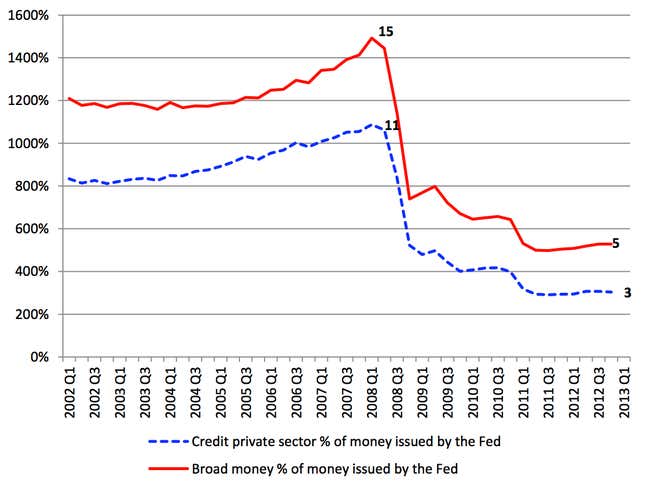
The Fed’s monetary printing is not creating excess demand at the rates of the 2000s because the commercial banks are not using the currency created by the Fed to give credit. Rather, they are depositing most of it back at the Fed. This interrupts the process through which the banking system multiplies the money created by the Fed. This multiplication is what transmits the Fed’s monetary creation to the economy: the Fed gives cash to the banks (by purchasing bonds and other securities from them), they give credit, the borrowers deposit their loans back in the banking system, which lends this money again, and so on. In this way, credit feeds deposits (broad money) and these feed credits, so that the banking system creates many dollars for each dollar created by the Fed. Demand is spurred by these multiplied dollars. Since the banks have not been granting credit with the cash the Fed is giving them, the multiplication has declined from 11 to 3 (credit) in 2012 and from 14.5 to 4.5 (broad money) from 2008 to 2012 (see the next graph). With low and declining multipliers, broad money and demand have not been increasing much. That’s why our indicator of monetary disequilibrium has fallen drastically since 2008.

This situation, however, is not sustainable. The low interest rates that accompany the collapse in the multipliers has directed resources toward those activities that flourish with such low interest rates, which, as a few years ago, are creating bubbles in equity shares and commodities. The debt is still increasing as well at rates that, even if lower than before 2008, are substantial. Bernanke knows that this cannot go on for much longer.
The Fed could react in two ways to this situation. One would be to permit the imbalances to grow, increasing the country’s debt, the rate of inflation or both. The debt is increasing even if the multipliers of the banking system have become so abysmally low. It would increase much faster if the banks raise these multipliers by beginning to lend. The Fed’s second course of action would be to try to prevent this from happening by increasing interest rates, so as to entice the banks to keep their funds with the Fed rather than lending them to the private sector.
But the higher interest rates would burst the bubbles in asset prices that monetary printing has created, bringing to the surface the losses that banks have accumulated by years of lending to unsustainable activities.
Thus, the Fed is between a rock and a hard place. If it does not increase the rates of interest, excess demand will explode leading to high inflation, large current account deficits or both. If it increases interest rates, the activities that are profitable only with very low interest rates will collapse, including the equity and commodity markets. This would expose the banks to very large losses, which would trigger a serious crisis because the banks have accumulated bad assets for over a decade now and have cleansed them only partially because they trust that the government will save them without having to take painful write-offs. As a snowball going down a slope, the problem gets worse with time.
Thus, there are serious threats lurking beneath the calm waters of Bernanke’s Fed. They are similar to those that lurked beneath the equally calm tenure of Greenspan. The coming breakdown is likely to be much worse than that of 2008.
