Anyone who keeps an eye on the US economy knows that the automotive business is going like gangbusters right now. In September US auto sales jumped to an annualized rate of 16.1 million, the best since December 2007.
How is this possible, given the relatively muted gains that US consumers have seen in their incomes?
Credit.
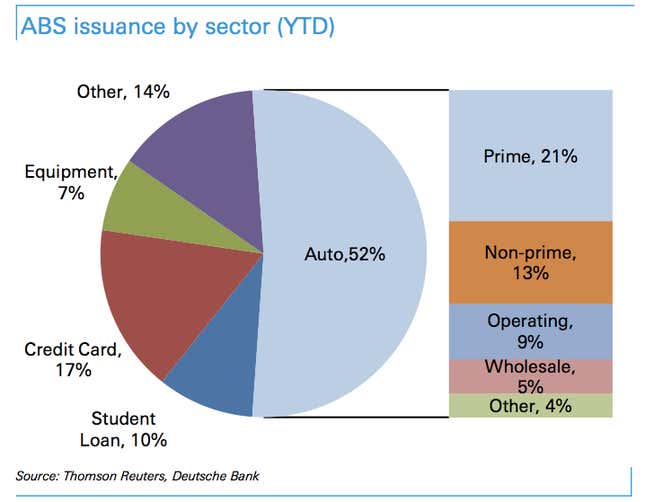
Take a look at this chart from Deutsche Bank, which shows the breakdown of issuance this year of different types of asset-backed securities (meaning bundled loans that lenders sell off to investors in the secondary market).

Issuance of automotive-related securities has surged as investors have sought higher yielding investments. And that means that cash is flowing to consumers—and dealers who often finance their inventory with so-called floor-plan ABS—allowing them to take advantage of the historically cheap interest rates that the Fed has engineered.
Oh, and for those who worry about the chances of a repeat of the debt problems the US has faced in recent years, it’s worth pointing out that a healthy chunk of US auto asset-backed securities qualify as “subprime.” And losses have been rising.


