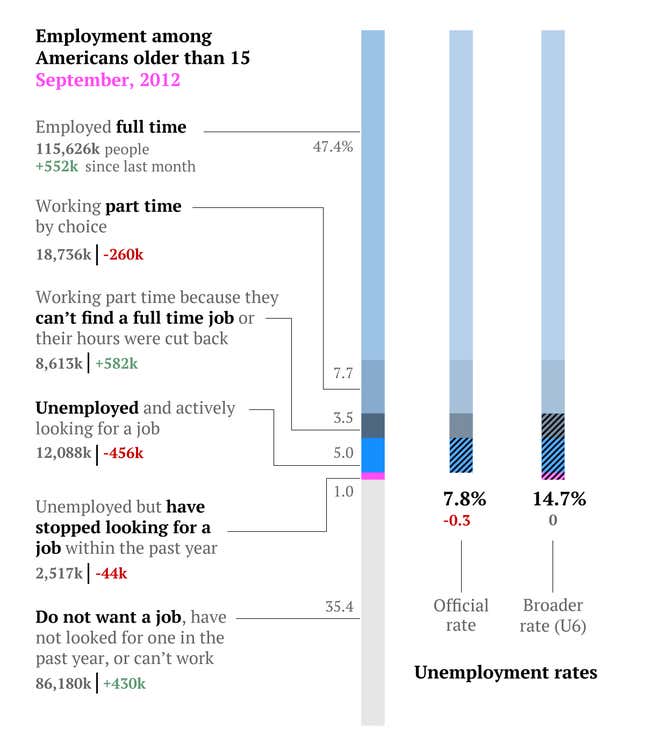
The US economy added 114,000 jobs in September, and the unemployment rate dropped to 7.8%. Here’s the breakdown of employment status for all Americans age 16 and above:

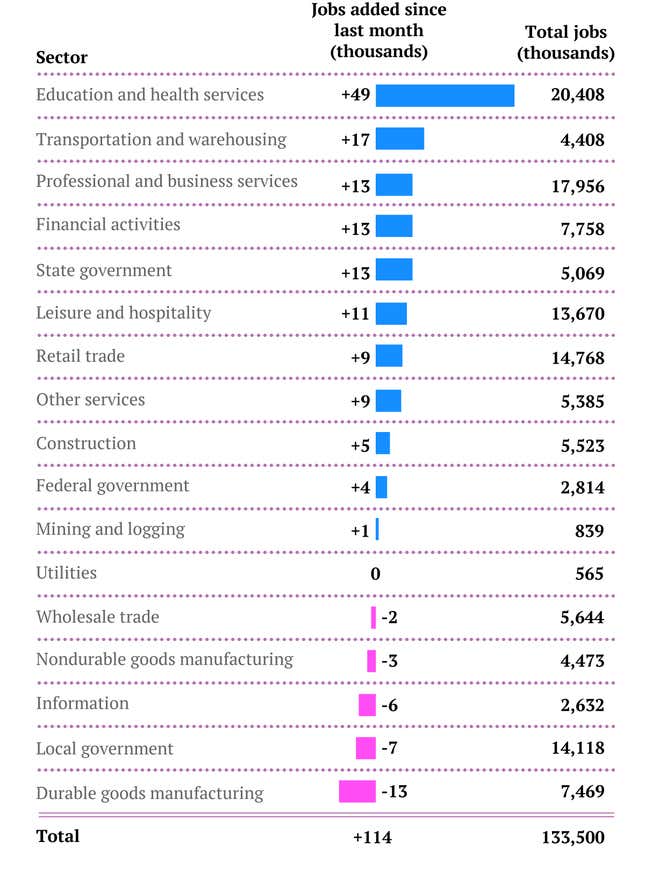
Here’s what job creation and loss looked like in various industries last month:

Some additional data that caught our eye:
- Labor force participation rate — the share of people looking for work or working — was little changed at 63.6%.
- Temp workers — considered a forward looking gauge on the jobs market, because companies tend to hire temps before staffing up permanently — lost 2,000 jobs. There has been growing concern that companies are starting to brace for any potential negative impact of the fiscal cliff after the election.
- The last time the unemployment rate was at 7.8% was back when President Obama was inaugurated.
- Part-time workers — those looking for or who previously had full-time work — rose by 600,000.
- The number of discouraged workers dropped by 235,000.
- One sign that the prolonged weakness in the economy has had a deep impact on people. Long-term unemployed — those jobless for 27 weeks or more — was little changed at 4.8 million and accounted for 40.1% percent of the unemployed. This is a big concern for economists who worry that over time large chunks of potential workers will see their skills atrophy and become less and less likely to return to work.
- Maybe this is why consumer sentiment has been moving slightly higher lately: In September, average hourly earnings of private-sector production and nonsupervisory employees increased by 5 cents to $19.81. There hasn’t been a jump that size since the 7 cent increase seen in July last year.
Source: Bureau of Labor Statistics