The excitement is palpable.
We’ve got a number or suggestions for charts that ought to be in the running for the coveted Quartz Chart of the Year™ distinction. But if you’ve got a chart that provides jaw-dropping insight—think about a chart that makes you say, “whoa”—it’s not too late to send it in. Tweet them (@matthewphillips) or email them (matt@qz.com) to us with the subject line “Chart of the year.”
As a reminder, we’re open to any type of chart: Ugly ones. Aesthetically pleasing ones. Newsy ones. Odd ones. They need not be just business and economics. In fact, they can be about anything so long as they have been published in calendar 2014. Keep ’em coming.
We’ll announce the winner on Dec. 15.
Without further ado here are some of the submissions (plus some we’ve curated ourselves) that are in the running for the big prize.
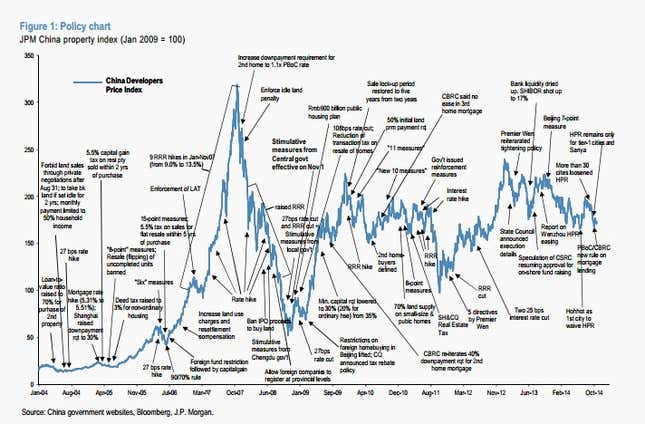
A hyper-annotated history of Chinese housing (J.P. Morgan)
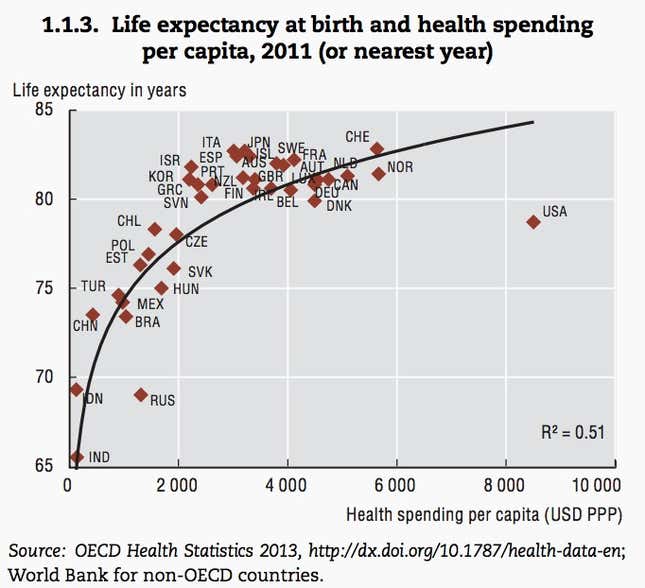
America the healthcare outlier (OECD)
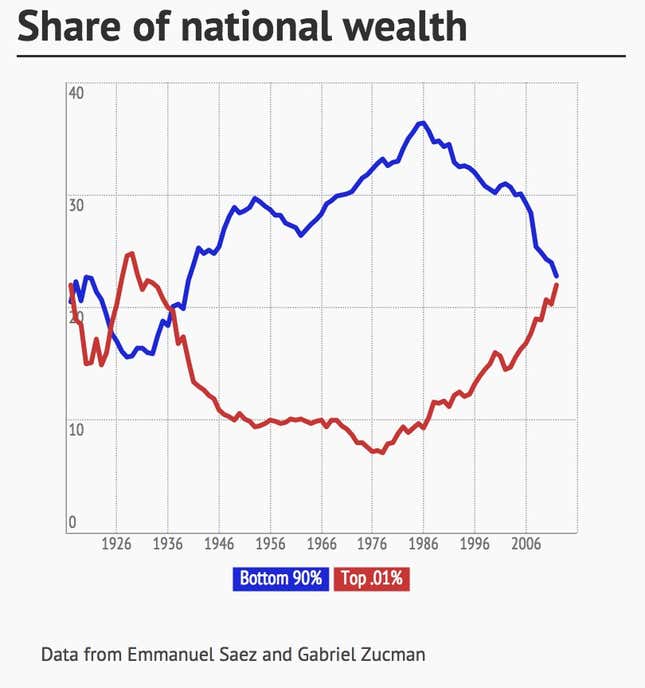
American inequality (Emmanuel Saez, Gabriel Zucman)
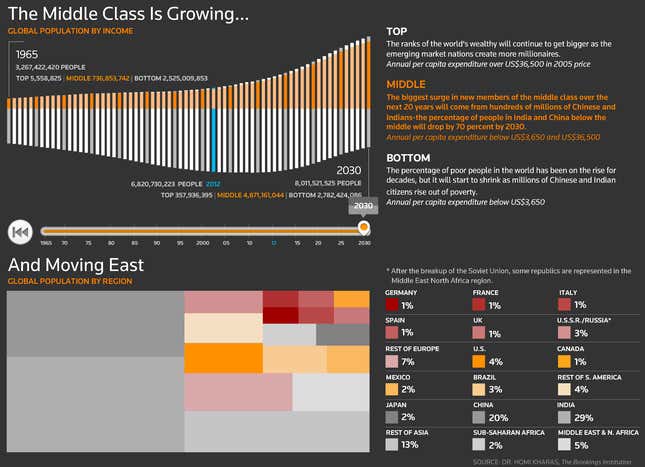
The changing global middle class (Reuters)
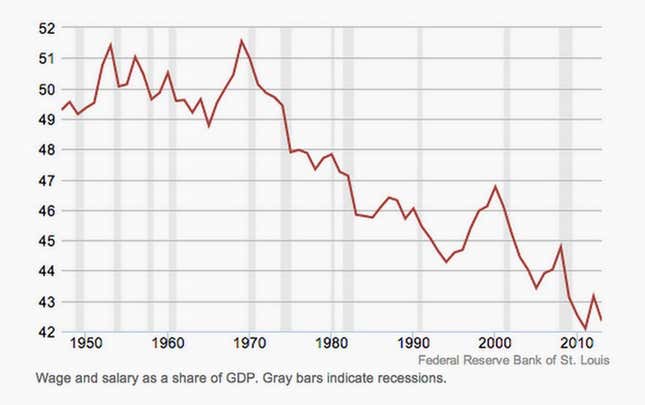
The declining labor share (NYT Economix)
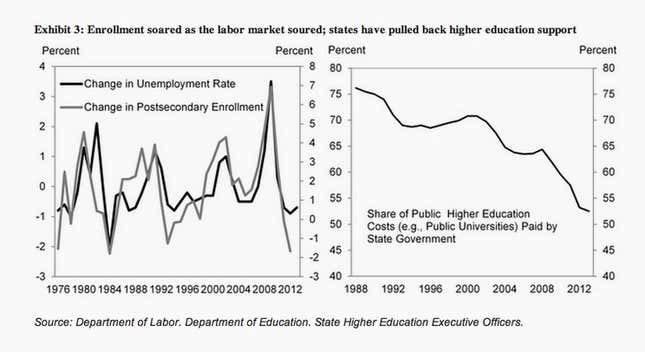
The real source the US student debt (Goldman Sachs)
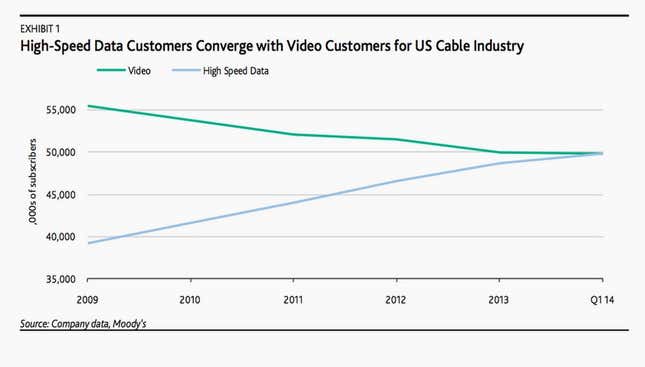
Data Vs. Cable TV (Moody’s)
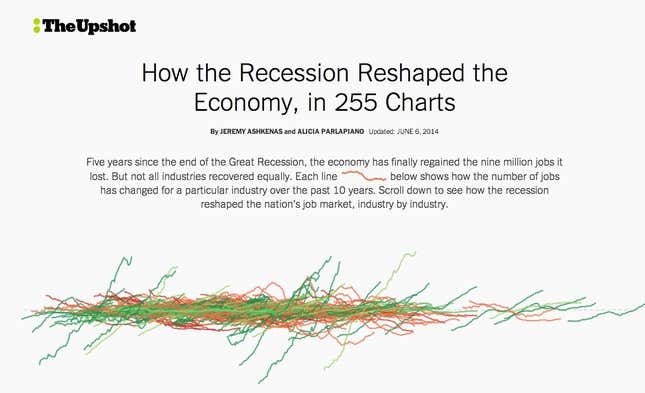
America’s economy in 255 charts (The Upshot)
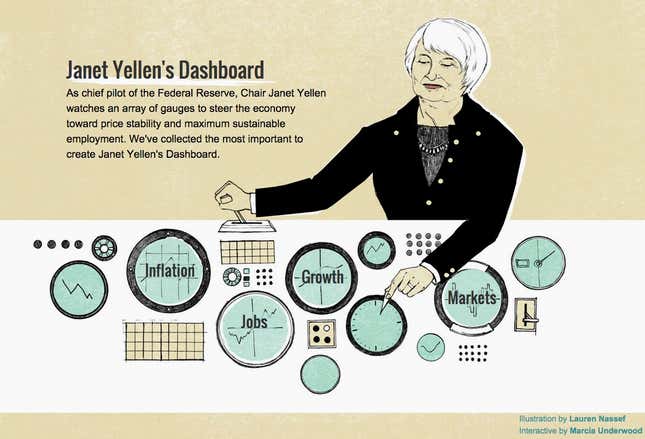
Janet Yellen’s Dashboard (Brookings Institution)
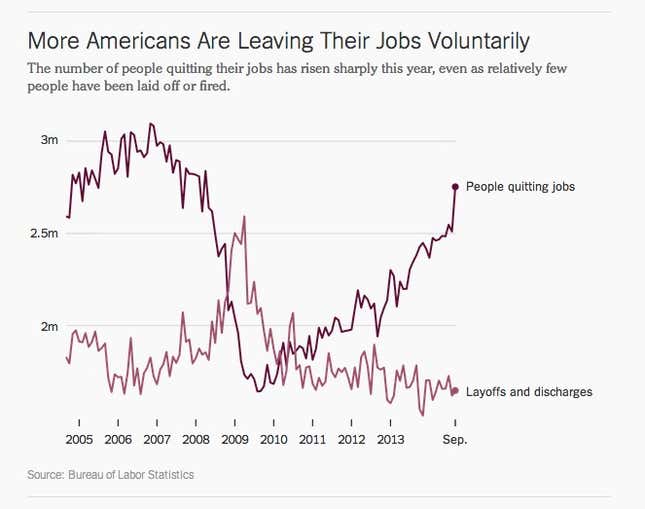
Take this job and shove it (The Upshot)
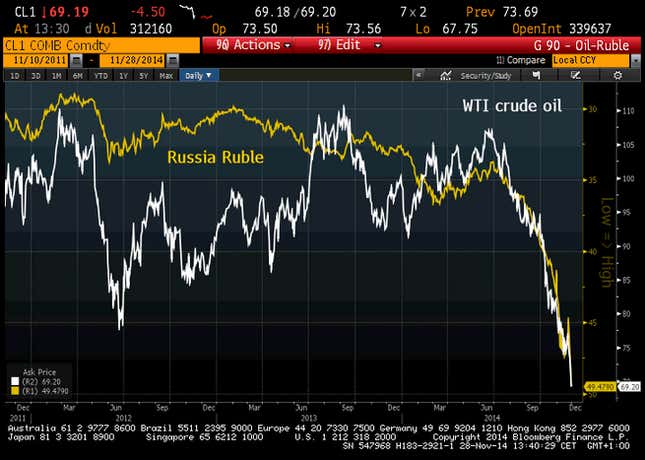
Russia’s ruble and oil prices (Holger Zschäpitz)
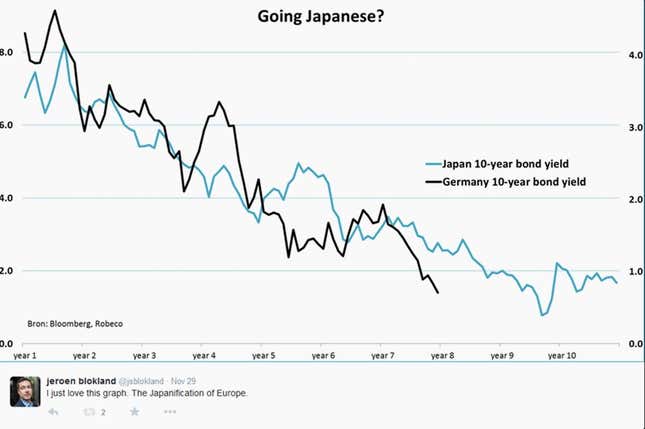
Europe’s Japanification (Jeroen Blokland)