It’s Jobs Friday, which is the biggest charts day of the month. But there was more to pay attention to than American jobs this week. Here are the biggest economic data points to keep in mind going into the weekend.
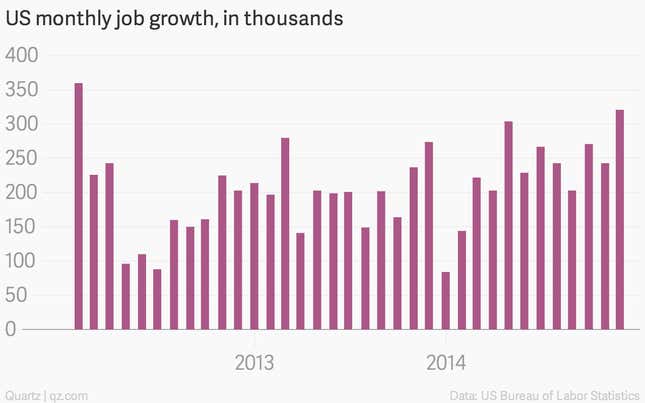
1. The US jobs engine is purring
The American economy produced 321,000 new jobs in November, putting the US on its best jobs pace since 1999.
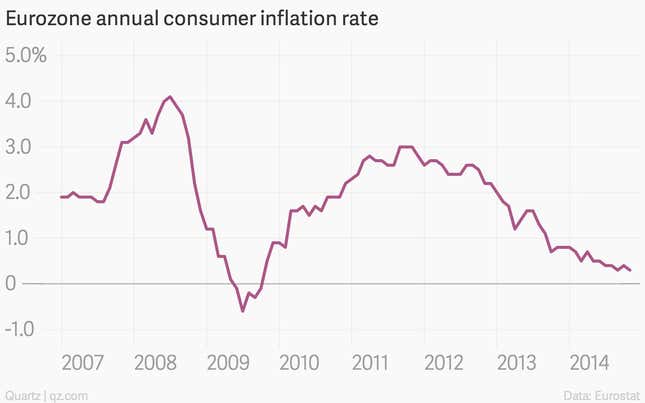
2. Europe continues its slide towards a recession.
The continent’s economy is still looking weak, with high unemployment and inflation tying a five-year low.
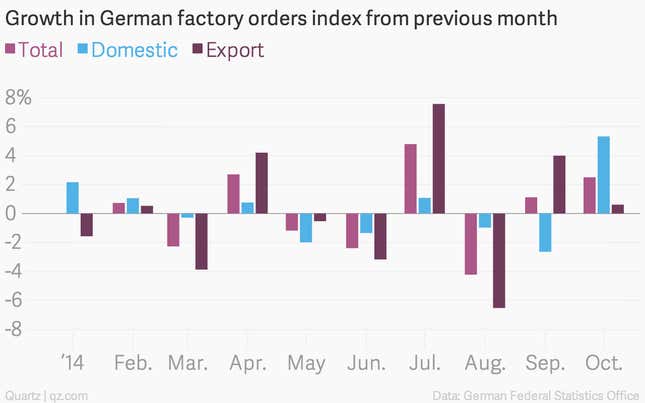
3. Germany seems to be hanging on.
Domestic factory orders were way up, even though international orders were flat.
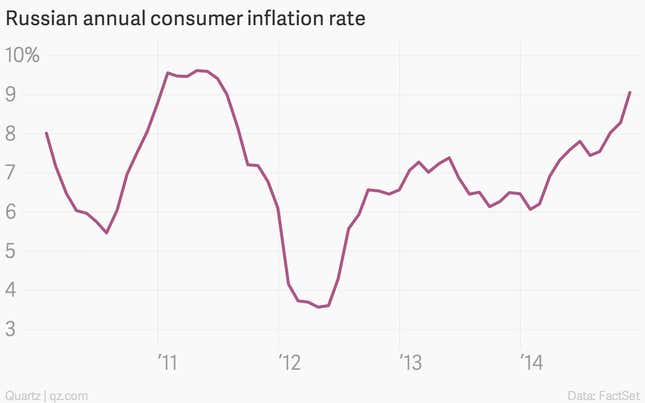
4. Russia has plenty of inflation to spare.
And Vladimir Putin does not like it.
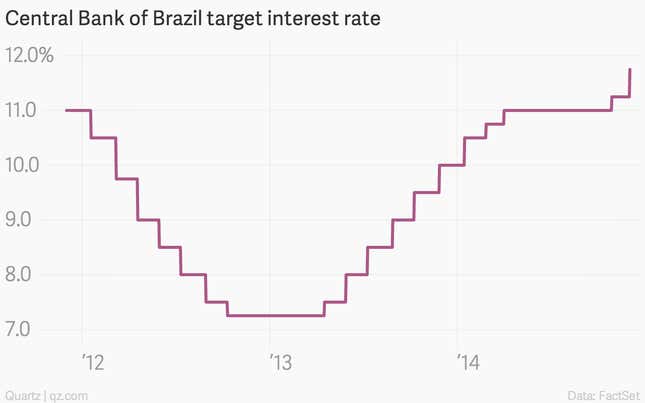
5. Brazil’s central bank tightened.
It’s trying to shore up the currency and put a lid on inflation.
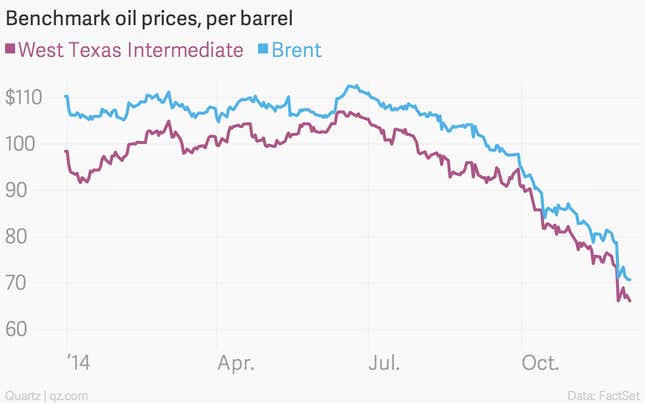
6. Oil slid further.
Your weekly reminder that Texas Tea is still getting steeped.
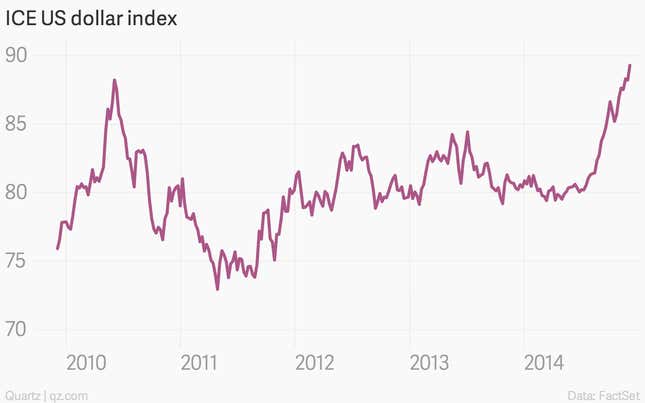
7. The US dollar dominated.
The greenback hasn’t been this strong in a while.
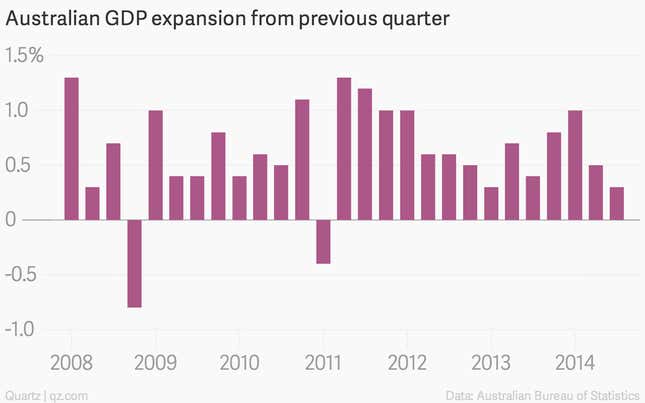
8. Australia’s miracle economy slowed.
The land down under just had its slowest quarter of expansion since the 2011.
