Untangling cause and effect can be devilishly difficult.
Imagine a small town on the plains. Every day, the windmills would spin, and the wind would blow, getting dust in everyone’s eyes. Things went on like that for some time: the windmills spun, the wind blew. So the townspeople, being logical folks, finally decided enough was enough and knocked down all the windmills.
It’s easy for us to see where these silly, fictional townspeople went wrong: wind makes the windmills spin, not the other way around.
But there are many more nuanced real-world examples where it is harder to distinguish causation from correlation. One 1999 study concluded that sleeping with a night-light as a child led to near-sightedness. This was later shown to be false: in fact, nearsightedness is genetic, and nearsighted parents more frequently placed night-lights in their children’s rooms.
Another example relates to HDL cholesterol. This ”good” cholesterol is associated with lower rates of heart disease. But heart-disease drugs that raise HDL cholesterol are ineffective. Why? It turns out that while HDL cholesterol is a byproduct of a healthy heart, it doesn’t actually cause heart health.
Correlations are a dime a dozen, inconclusive and flimsy. Causal relationships are firm and actionable, and align more convincingly with the natural way we think about things.
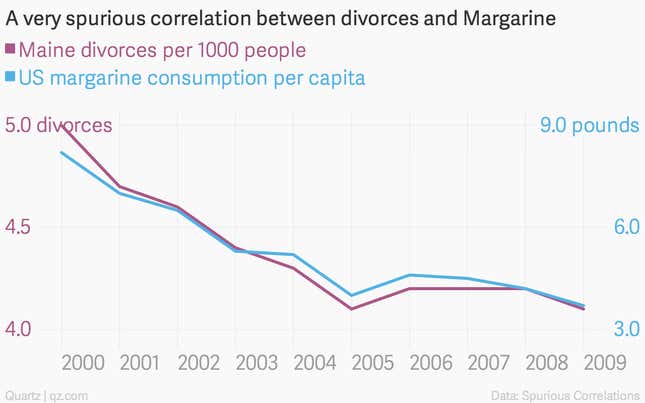
Finding correlations is easy—in fact, there’s a project called Spurious Correlations that automatically searches through public data to track them down, no matter how nonsensical they may be.

In contrast, determining causal relationships is really hard. But techniques outlined in a new paper promise to do just that. The basic intuition behind the method demonstrated by Prof. Joris Mooij of the University of Amsterdam and his co-authors is surprisingly simple: if one event influences another, then the random noise in the causing event will be reflected in the affected event.
For example, suppose we are trying to determine the relationship between the the amount of highway traffic, and the time it takes John to drive to work. Both John’s commute time and traffic on the highway will fluctuate somewhat randomly: sometimes John will hit the red light just around the corner, and lose five extra minutes; sometimes icy weather will slow down the roads.
But the key insight is that random fluctuation in traffic will affect John’s commute time, whereas random fluctuation in John’s commute time won’t affect the traffic. By detecting the residue of traffic fluctuation in John’s commute time, we could show that traffic causes his commute time to change, and not the other way around.
Still, this method isn’t a silver bullet. Like any statistical test, it doesn’t work 100% of the time. And it can only handle the most basic cause-and-effect scenarios. In a three-event situation—like the correlation of ice cream consumption with drowning deaths because they both depend on hot weather—this technique falters.
Regardless, it’s an important step forward in the often-baffling field of statistics. And that’s cause—yes, cause—for celebration.
Cropped photo via TaxRebate.org.uk on Flickr.
