This post has been corrected.
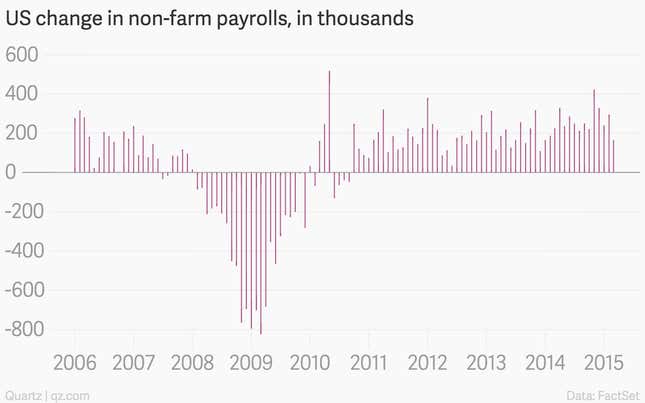
The US added a dismal 126,000 jobs in March, way below expectations
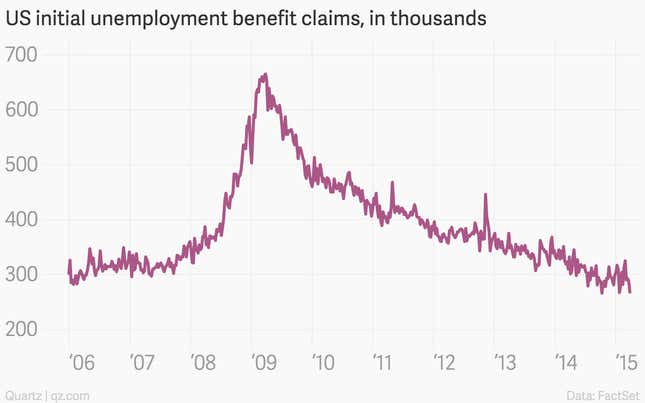
Meanwhile, America’s initial jobless claims keep falling
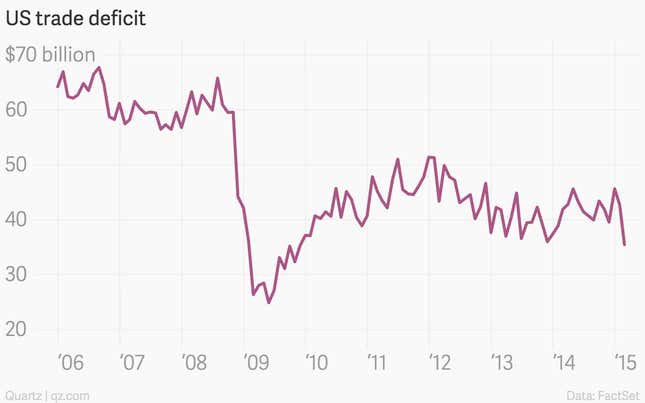
The US trade gap shrank to the lowest level since 2009, thanks to a strong greenback and a West Coast port slowdown
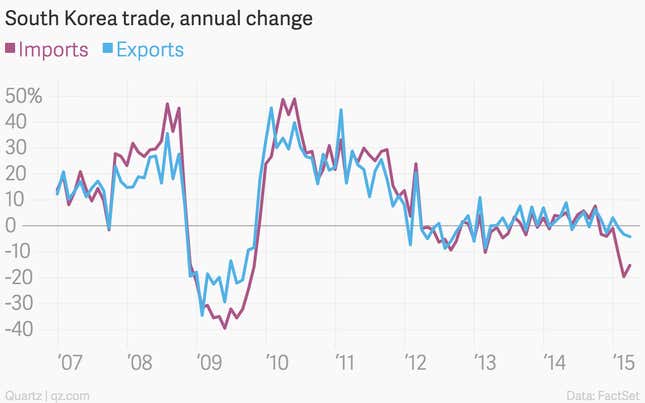
South Korea’s trade gap is growing because of slower economic growth and low oil prices
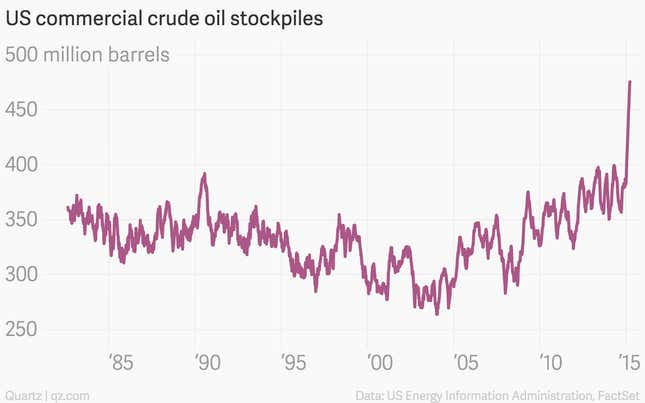
US oil supplies hit another record
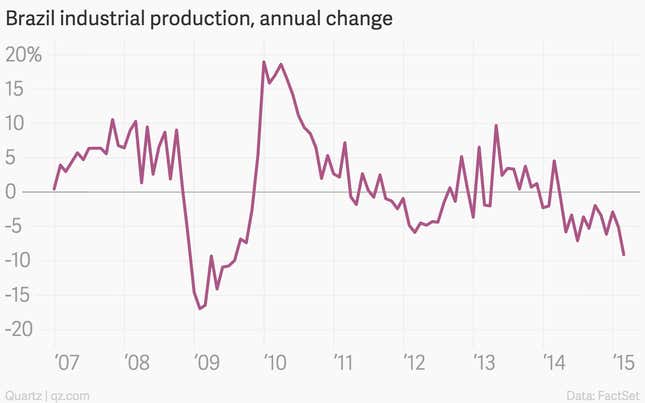
Brazil’s industrial production is getting slower as it lumbers toward a recession
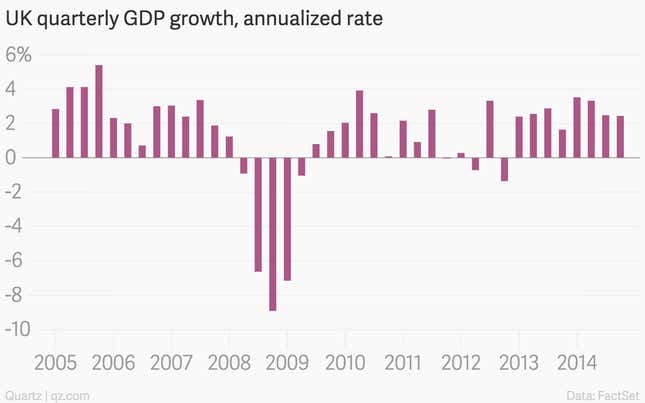
British economic growth isn’t exactly robust, but it’s steady ahead of general elections
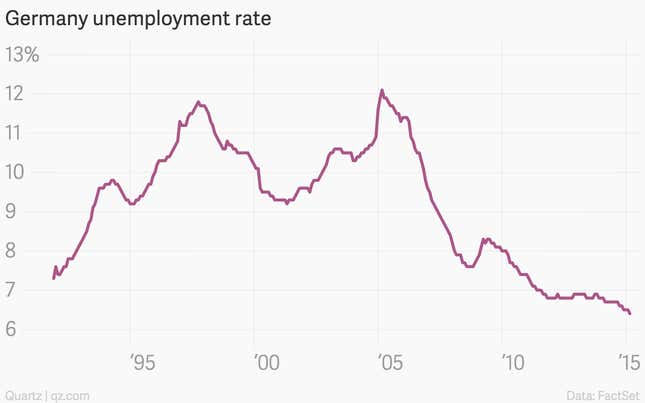
German unemployment hasn’t been this low since there were two Germanys
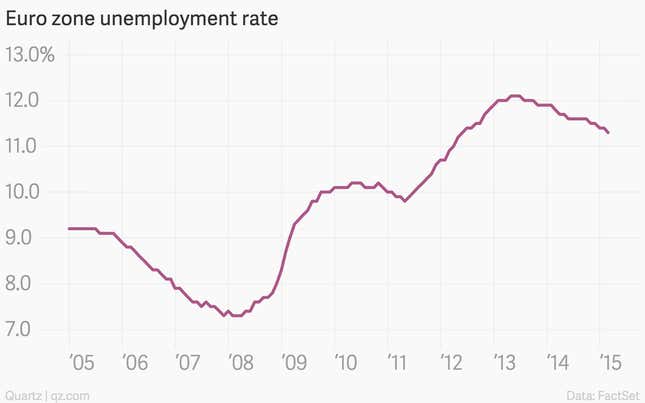
European unemployment is still in the double digits but ticking lower
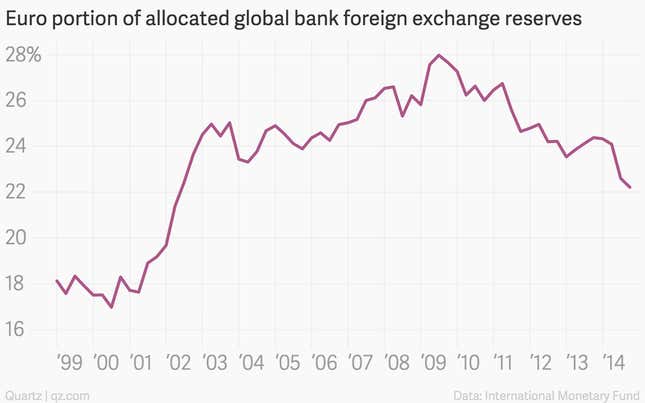
The euro hasn’t been this unpopular since 2002
Correction: A previous version of this post incorrectly stated that the US economy added 164,000 jobs last month. It added 126,000 jobs.