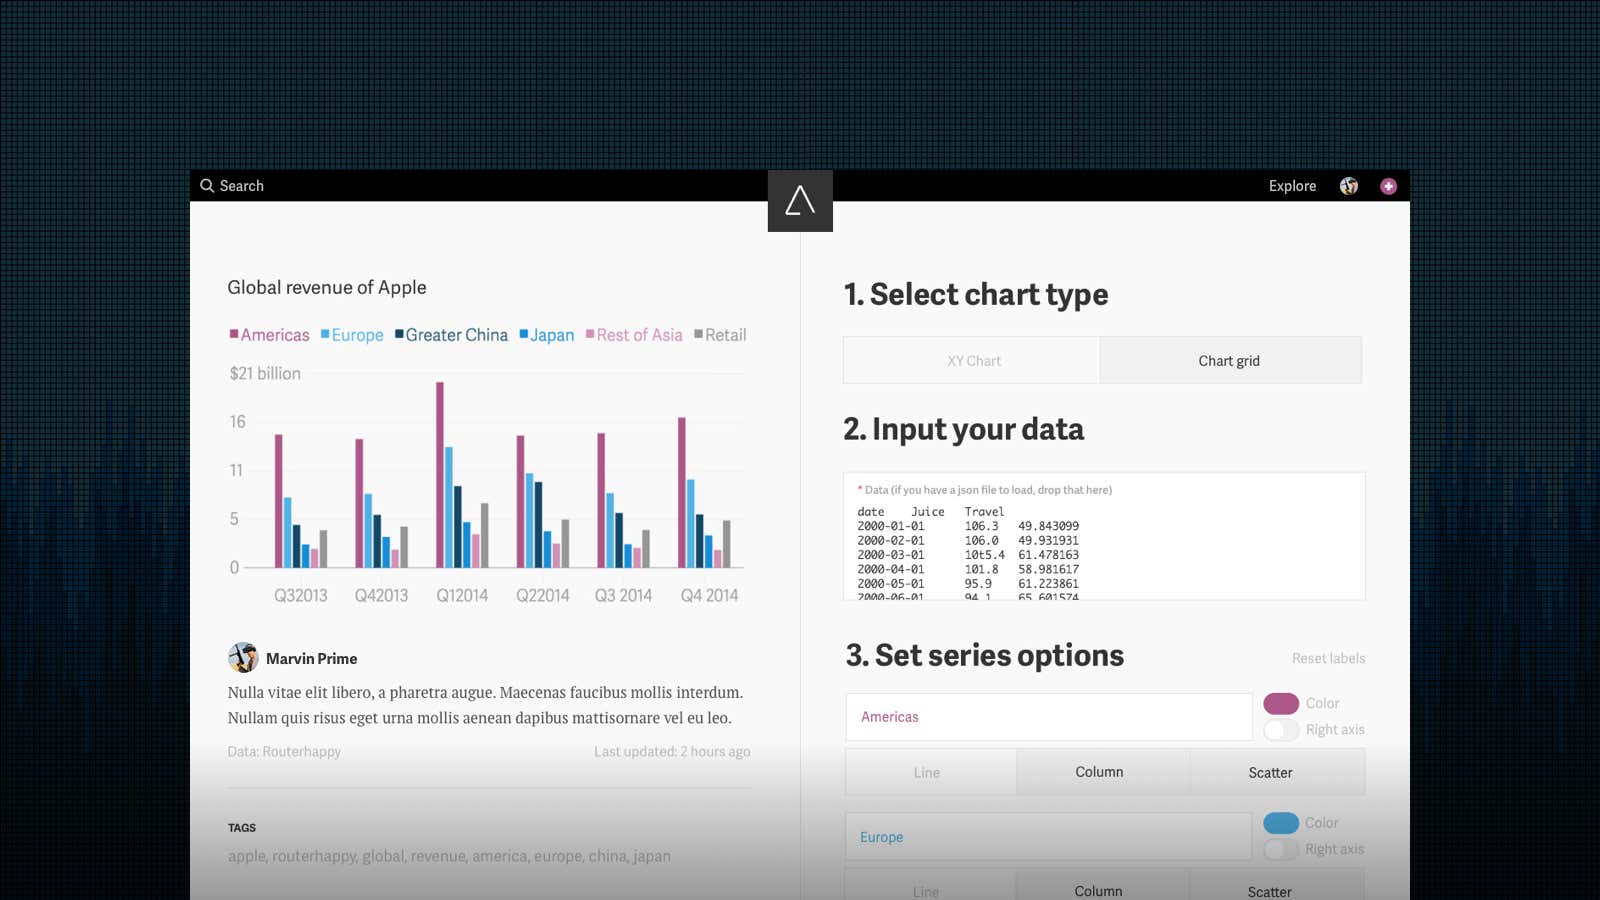
Atlas debuted last year as a home for all of Quartz’s charts and the data behind them. Today it becomes a platform for your charts and data, too.
We are opening up Atlas to chart creators around the world, from researchers to analysts to fellow journalists and anyone else who regularly works with data. You can create an Atlas account starting now. We’ll be giving people access to make charts—slowly, at first, and then more rapidly as the platform evolves.
Why might you want to create charts with Atlas? It’s a chance to use our widely acclaimed charting tool, which makes it easy to visualize data in a simple, consistent, and mobile-friendly style. Every chart published on Atlas has its own page. You and others can share the chart, embed it elsewhere, grab an image, or download the underlying data.
A platform for charts and data
Atlas is becoming an open platform because we think it has potential to become the world’s largest repository of user-generated charts and data. Imagine a network of people who work with data every day, sharing it all with each other and the rest of the world. That’s the vision we’re pursuing, and hope you’ll join us in getting there.
Since starting Atlas in summer 2015, we have served more than 80 million charts to 25 million people. And that’s just with the work of Quartz’s own journalists. As we open up the platform, the reach of Atlas will grow considerably.
We are making Atlas invite-only at the start in order to learn from the earliest users before making improvements and adding more people. Bear with us if you aren’t allowed in right away. Atlas will always be open to everyone for viewing, embedding, and downloading charts. Creating charts is what requires an invite.
Today we are starting to let individuals create charts on Atlas. In time, we also intend to provide support for organizations that want to use Atlas for their charting needs, the same way that we create most of our data visualization here at Quartz. If that sounds interesting, we hope you’ll get in touch.
Chartbuilder, the tool that powers Atlas, remains an open-source project, and we’ll continue to develop it for the benefit of this platform and any other use. If you’re a developer, consider contributing to project. (Or do it while working with us! We’re looking to fill engineering, editing, and support roles for Atlas.)
Advertising
Here’s a word from Quartz president and publisher Jay Lauf:
Atlas is brought to you by our launch partner, GE, the world’s digital industrial company. We are grateful for their support of unique Quartz initiatives like this one.
GE is transforming industry with software-defined machines and solutions that are connected, responsive, and predictive. Through their charts on Atlas, you can explore how GE is moving, curing, building, and powering the world.
Credits and support
Atlas is developed by Yitz Jordan, Henry Chan, and Micah Ernst, and designed by Daniel Lee and Elan Kiderman. Chartbuilder is primarily the work of Nikhil Sonnad and David Yanofsky.
We have begun creating support documentation for Atlas and ask that you submit any issues there, so we can keep track of them. Thanks!


