
There’s a lot of talk right now that polling failed. But Trump’s win was hardly an unpredictable “black swan” event. All the evidence was there, if you knew how to read it.
In fact, the polls did ok, 2016 was not even a particularly large miss by historical standards. Most states ended up within the polling margin of error, and the more careful forecasts only gave Clinton a 70 percent chance. By the last week before the election, a Trump victory was twice as likely as losing a game of Russian Roulette.
Yet the most optimistic predictions gave Clinton a 90 percent chance, because they missed a fundamental fact: polling errors tend to affect many states at once, and in the same direction.
To understand the vast gulf between 70 percent and 90 percent it helps to convert probabilities to odds, the ratio of chances to win against chances to lose. An 50% chance is a coin flip, or 1:1 odds.

A 66% chance – around where FiveThirtyEight’s put Clinton the last week before the election – is 66:33 or 2:1 odds. If you roll that die, it shouldn’t be surprising when it comes up red.

By comparison, you have a much better chance of not losing a game of Russian Roulette if you play with a six shooter – 83%. That’s 5:1 odds of winning, more than twice as likely.

And the odds go up sharply from there as probability increases. Going from 83% to 90% doesn’t make it 7% more likely you’ll win, but nearly twice as likely. It’s 9:1 odds.

A 90 percent chance is more than four times as likely as a 66 percent chance.
So why was there such a gulf between the most optimistic and conservative forecasts? Some models didn’t account for the fact that while individual polls can be reasonably accurate, their combination often isn’t.
Let’s look at a few swing states that were predicted to go for Clinton. I’ve taken every poll conducted in the last two weeks as well as the margin of error, which you usually find in the footnotes. Here’s what Clinton’s lead in Pennsylvania looked like:
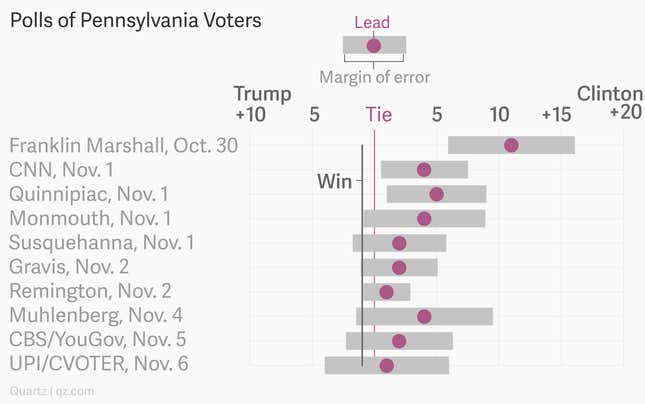
The final result of +1 for Trump is definitely a few points below the poll average, but it’s inside the margin of error of the last few polls. Florida is even less of a surprise:
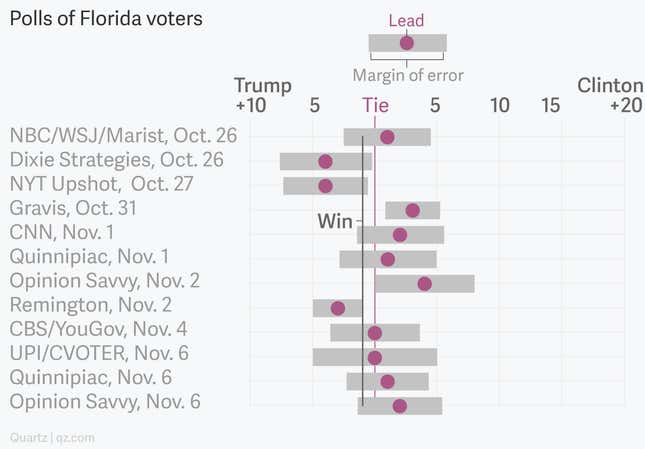
The final result is well within the error bars, but the miss is in the same direction: too optimistic for Clinton. On the other hand, Wisconsin seems like a genuine shocker:
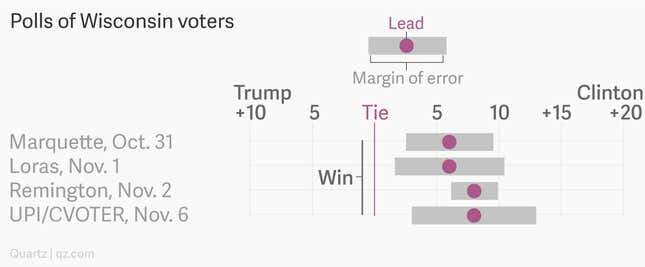
It’s difficult to say what went wrong here; polling error can result from all sorts of factors including bad predictions of voter turnout, people lying to pollsters or rapidly changing demographics. But when there is a problem, it tends to hit many places at once: an issue with a pollster’s method will tend to show up in several states, while a problem on the ground will confound multiple pollsters.
Reuters didn’t take this into account and gave Clinton a 90% chance of winning, while FiveThirtyEight did, and even warned us beforehand of the possibility of correlated polling errors. They gave Clinton only a 70% shot, or about 2:1 odds.
Which model did you choose to believe?
Forecasting is as much art as science, and not just in elections, because every moment in history is uniquely different. This flexibility makes it easy to fool ourselves, like everything else, we see what we want to see. A margin of error is built into polls because despite the analysis, unseen factors can introduce mistakes. Next time you see a difference between predictions, ask how big it really is, and ask why.
About the data: Analysis was based on polls maintained by Huffington Post Pollster that occurred after Oct. 25, excluding polls that didn’t report margin of error.