The typical American family spends half its income on housing and transportation. The typical Egyptian family spends half its income on food.
This week, we looked at how health care, education, and cell phone bills have eaten into American budgets since the recession. But let’s take the global view. What do family budgets look like in Egypt? Or Indonesia? Or China? The Credit Suisse Emerging Consumer Survey asks thousands of respondents across eight developing countries — the three above plus India, Russia, Brazil, Saudi Arabia, and Turkey — to say how they spend money on categories like cars, food, and phones. Those eight graphs, with key stats from the report, are below. Some light analysis for the road comes at the bottom.
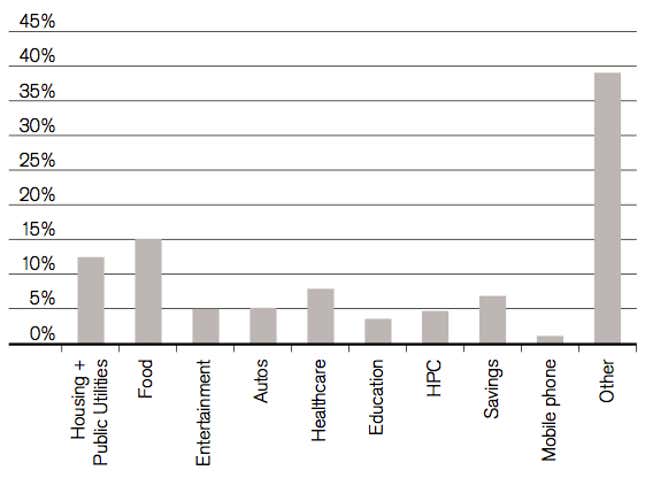
India
GDP per capita: $1,382
Key stat:Key stat from the Credit Suisse report: ”70% of Indians say they have no computers in the home. Only 19% of respondents register having access to the internet.”
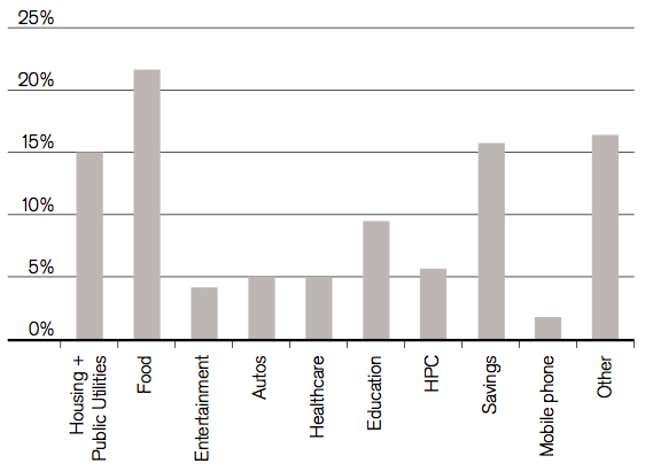
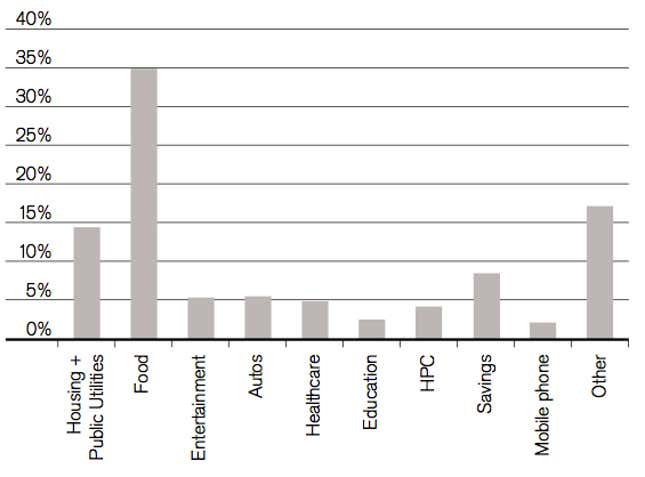
Egypt
GDP per capita: $2,892
Key stat: “There is [an] ongoing red flag raised by exposure to food with its near 50% claim on the household income of Egyptian consumers. Ironically, plans to cut government spending on food subsidies to strengthen state finances, could in itself increase inflation and undermine consumer sentiment.”
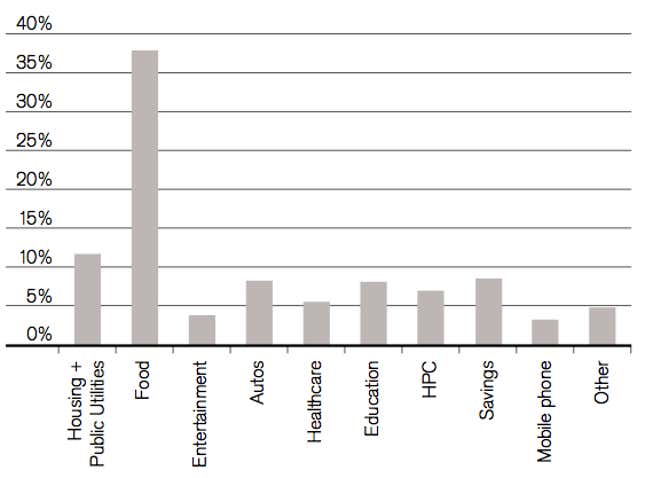
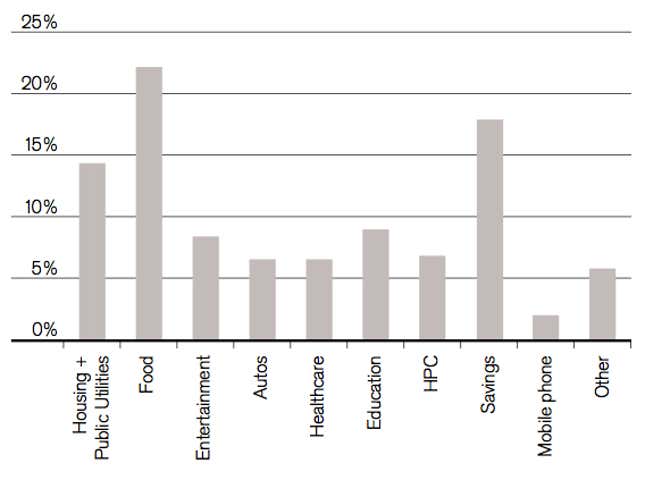
Indonesia
GDP per capita: $3,456
Key stat: “The risk that always exists for the Indonesian consumer is the sensitivity of food prices. Food consumes a large proportion of the household budget. Upward pressure on prices would threaten to crowd out other discretionary spending.”
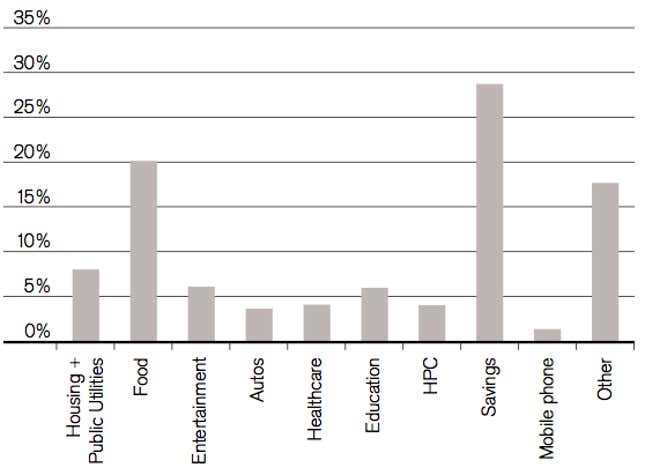
China
GDP per capita: $4,833
Key stat:“The two categories that stand out are healthcare and education. The only country with comparable momentum in healthcare spending is Saudi Arabia. Only Saudi and India had stronger readings on extra educational spending … At nearly 30% of monthly income, [China’s savings] is the highest in the survey.”
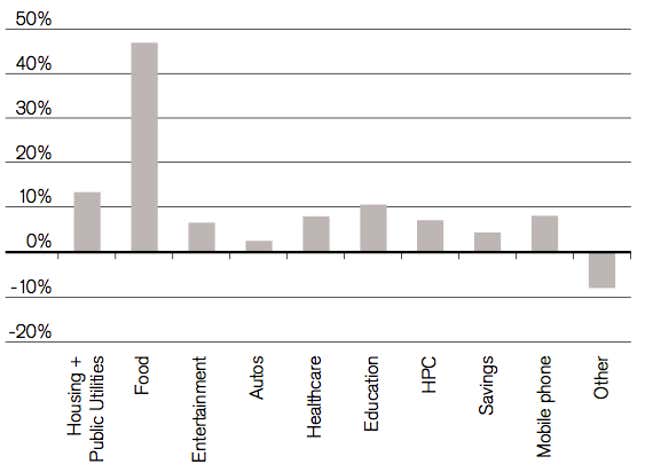
Brazil
GDP per capita: $12,423
Key stat:“The Brazilian consumer continues to stand out as the most optimistic across our survey. Barely 7% of household income is registered as saved and over a half of respondents suggest they have no extra cash for savings. Given the strength of projected real income growth, this is extraordinary. It is more typical of the countries where the consumer is being seriously squeezed than one where finances seem robust.”
Russia
GDP per capita: $13,543
Key stat: ”Despite the structural support there has been for the Russian economy in recent years from commodity prices, there has not been a notable trickle down to the average consumer. Optimism remains the lowest of the BRICs. The inequality of income suggests that growth opportunities are played mainly at the high-income end in Russia.”
Saudi Arabia
GDP per capita: $21,685
Key stat:“While inflation has been a negative factor in our emerging economies sur- veyed, including Saudi Arabia, there is a stabilizing effect from government pol- icy. Robust oil revenues (a driver of infla- tion for others) have provided govern- ment spending with the firepower to support public sector incomes and boost spending more generally. We have seen a government pledge to spend USD 130 billion on housing and job creation this year.”
***
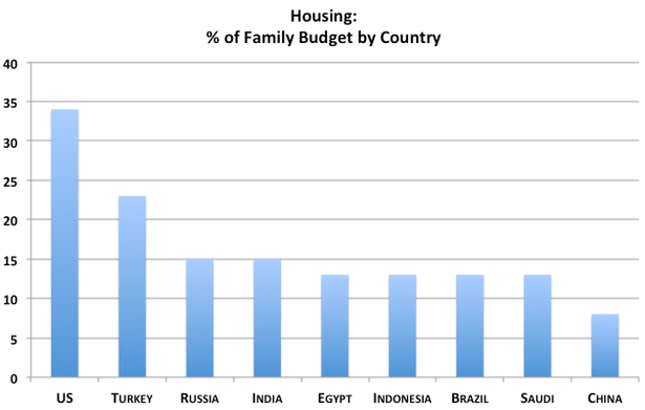
Two big ideas for the road: Houses and food. Everybody needs somewhere to live and something to eat. But you can learn a lot about a country by looking at housing and food spending. Here’s how the U.S., where middle-class families spend about a third of their income on housing, compare to the developing economies in this survey.
And here’s the story with food.
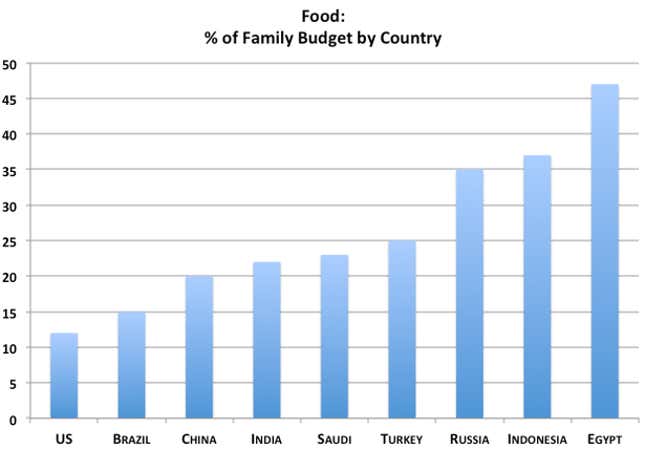
I don’t want to push this point too far, because these sort of surveys have obvious limitations. Tremendous income inequality in developing countries with hundreds of millions of people makes it impossible to tell the story of the frothy middle class *in one graph.* But the bigger picture is clear and uncontroversial. When families earn more income, they can afford to eat more and buy more clothes, but the real shift is from those essentials to bigger better houses, education, and health care.