This post has been corrected.
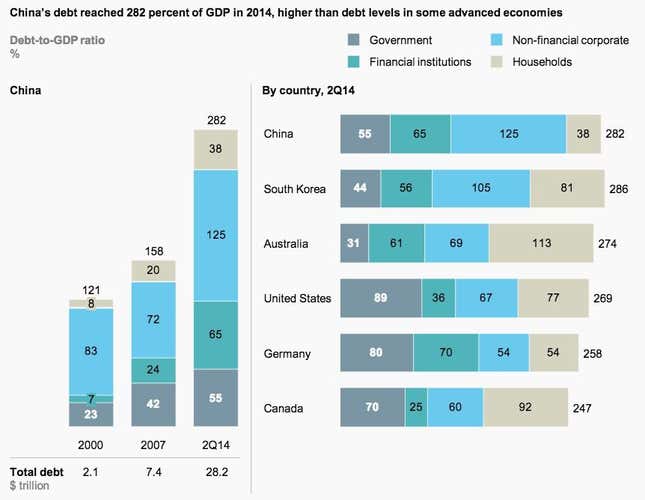
China’s leaders face a challenge: they must allow economic growth to slow steadily enough that they don’t trigger a financial shock. Yet the best bet for achieving this feat—i.e. bank lending—also happens to be their biggest threat. At 125% of GDP, China’s corporate debt is already perilously huge.
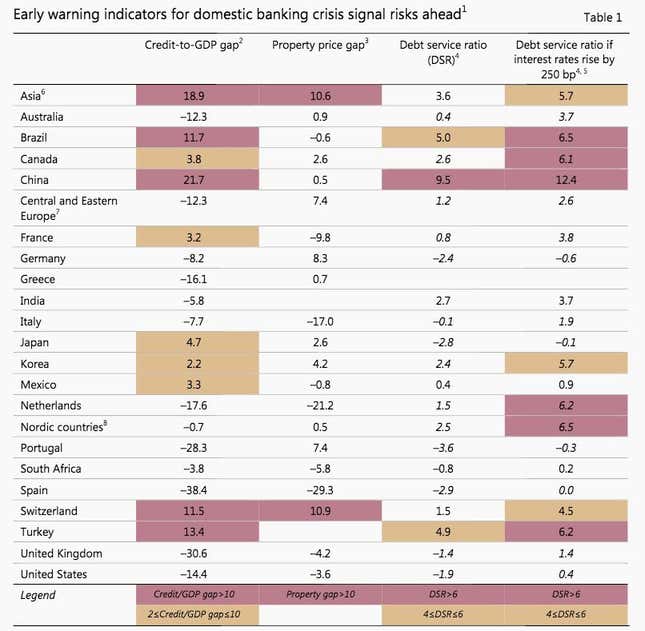
Here’s another sign of just how unmanageable that debt has become: China’s debt service ratio (the share of GDP used to pay down debt) is literally in the red zone, according to a report by the Bank for International Settlements released today.

As of Q3 2014, Chinese companies were spending 9.5-percentage points more of GDP paying down interest and principal than the long-run average—money that could have gone instead toward paying workers or building their businesses. BIS doesn’t say what the actual ratio is. But as of Sep. 2013, that was equal to 39% of China’s GDP, according to calculations made by Société Générale economist Wei Yao, based on BIS methodology. Of course, this doesn’t mean China’s actually paying off that amount. As Yao has noted, it’s likely that banks are indefinitely rolling over a hefty chunk of these loans.
What’s scary about that is that China’s debt burden keeps growing, even though banks aren’t getting paid back—and as the economy is slowing sharply. This is likely because of the assumption that the government guarantees many of those loans.

That’s all pretty unsettling. But what’s going to be really ugly is if banks and savers ever realize how much of that debt will never be paid.
Though the Chinese government has staved off that realization so far, that’ll get harder to do as rates keep rising—and as prices of property and other assets keep falling.
A 2.5-percentage-point increase in rates would leave Chinese firms owing an even higher share of the country’s GDP to pay down debts, an increase since Q4 2013. Since that would only happen if all outstanding loans had variable rates, which is unlikely, that stat is better read as an indicator of the long-term trend, notes BIS.

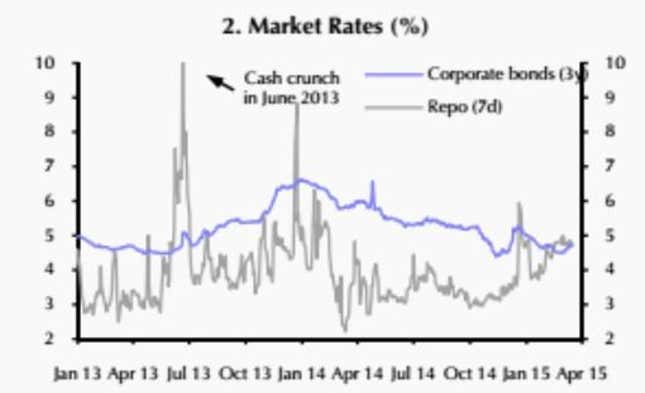
Rates are rising for a couple of reasons. For one thing, disinflation (meaning, slowing growth in inflation) and deflation are effectively making old debts more expensive. A frenzy of greenback-buying among Chinese companies has also drained the supply of cash. The taper is likely a factor too, given that an untold but undoubtedly colossal portion of China’s liquidity surge in 2013 and 2014 was thanks to Chinese companies borrowing cheaply abroad to speculate in China. And mysteriously, recent loosening by the central bank has had little effect.
Correction, Mar. 18, 2015 (12.30pm EST): A previous version of this article stated that the BIS table showed the debt-service ratio; it shows the deviation of a country’s DSR from its long-run average since 1985 or later depending on data availability and average inflation, in percentage points.
