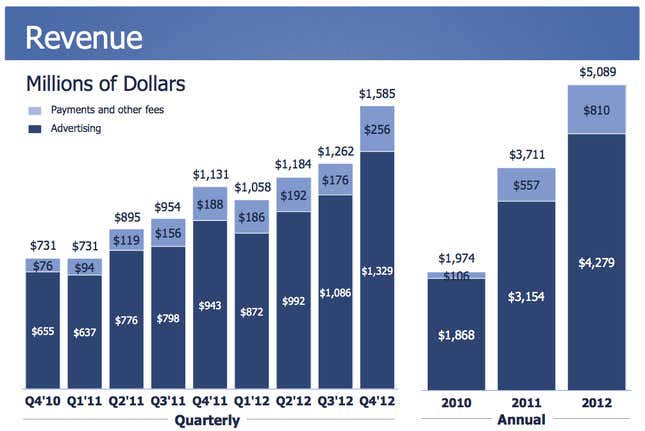
Facebook made $64 million (corrected; an earlier version of this story cited the operating profit, $523 million) on $1.585 billion in revenue in the fourth quarter of 2012, a result investors found somewhat disappointing. Take a closer look at how and where Facebook is making its money, courtesy of slides (pdf) the company released along with its earnings statement.
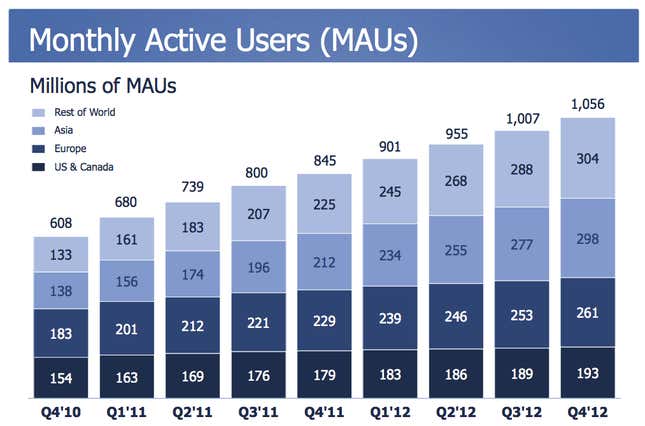
Facebook grew to 1.06 billion monthly active users by Dec. 31, 2012. The majority of users live outside the US and Europe.
But Facebook still makes most of its money from users in North America.
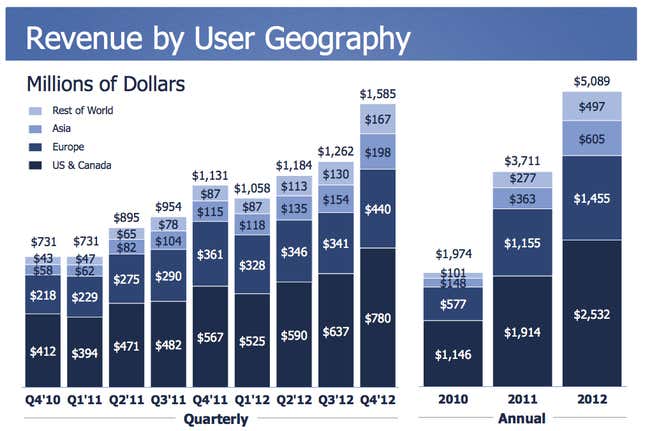
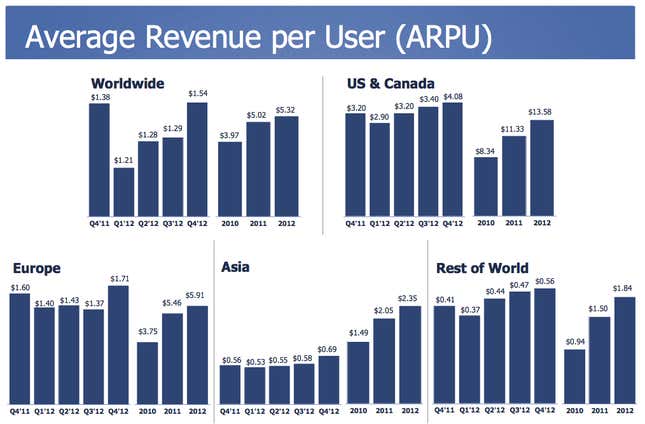
Facebook doesn’t make very much money from its users in growth areas like Africa and Latin America.
Mobile users grew faster than non-mobile users, and 23% of Facebook’s ad revenue came from mobile, up from 14% last quarter.
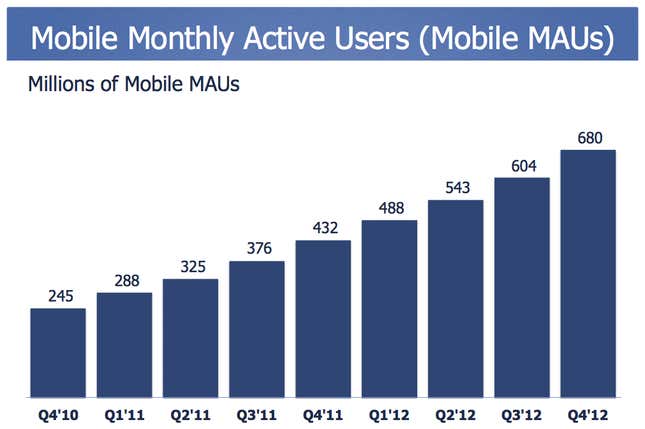
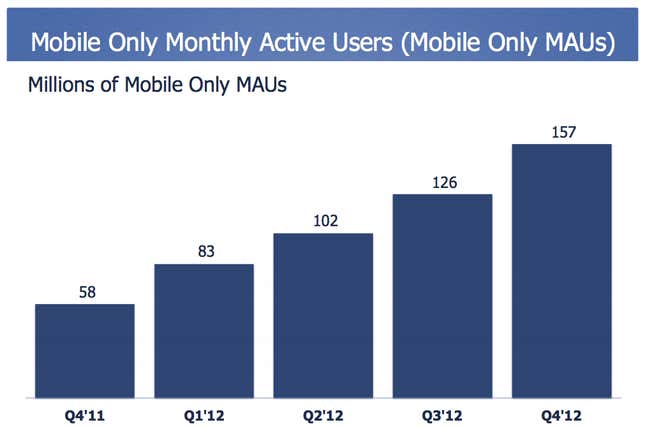
In fact, 157 million Facebook users only use it on their phones.
Advertising continued to represent the vast majority of Facebook’s revenue, and it grew faster than analysts expected.
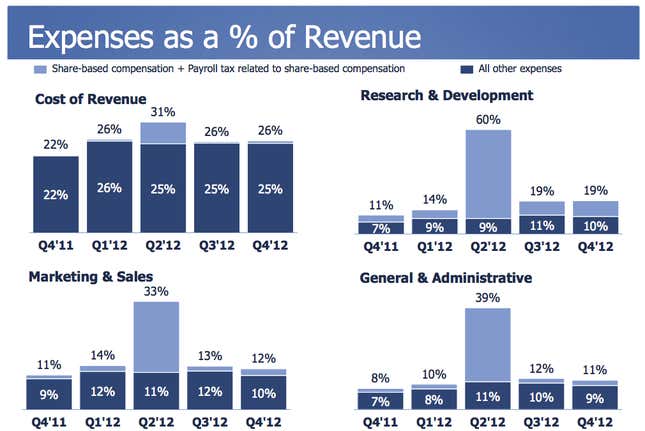
Finally, Facebook is spending a ton on research and development, much more than in 2011.
Correction: A previous version of this post misstated Facebook’s fourth-quarter profit. It was $64 million, not $523 million as originally reported.