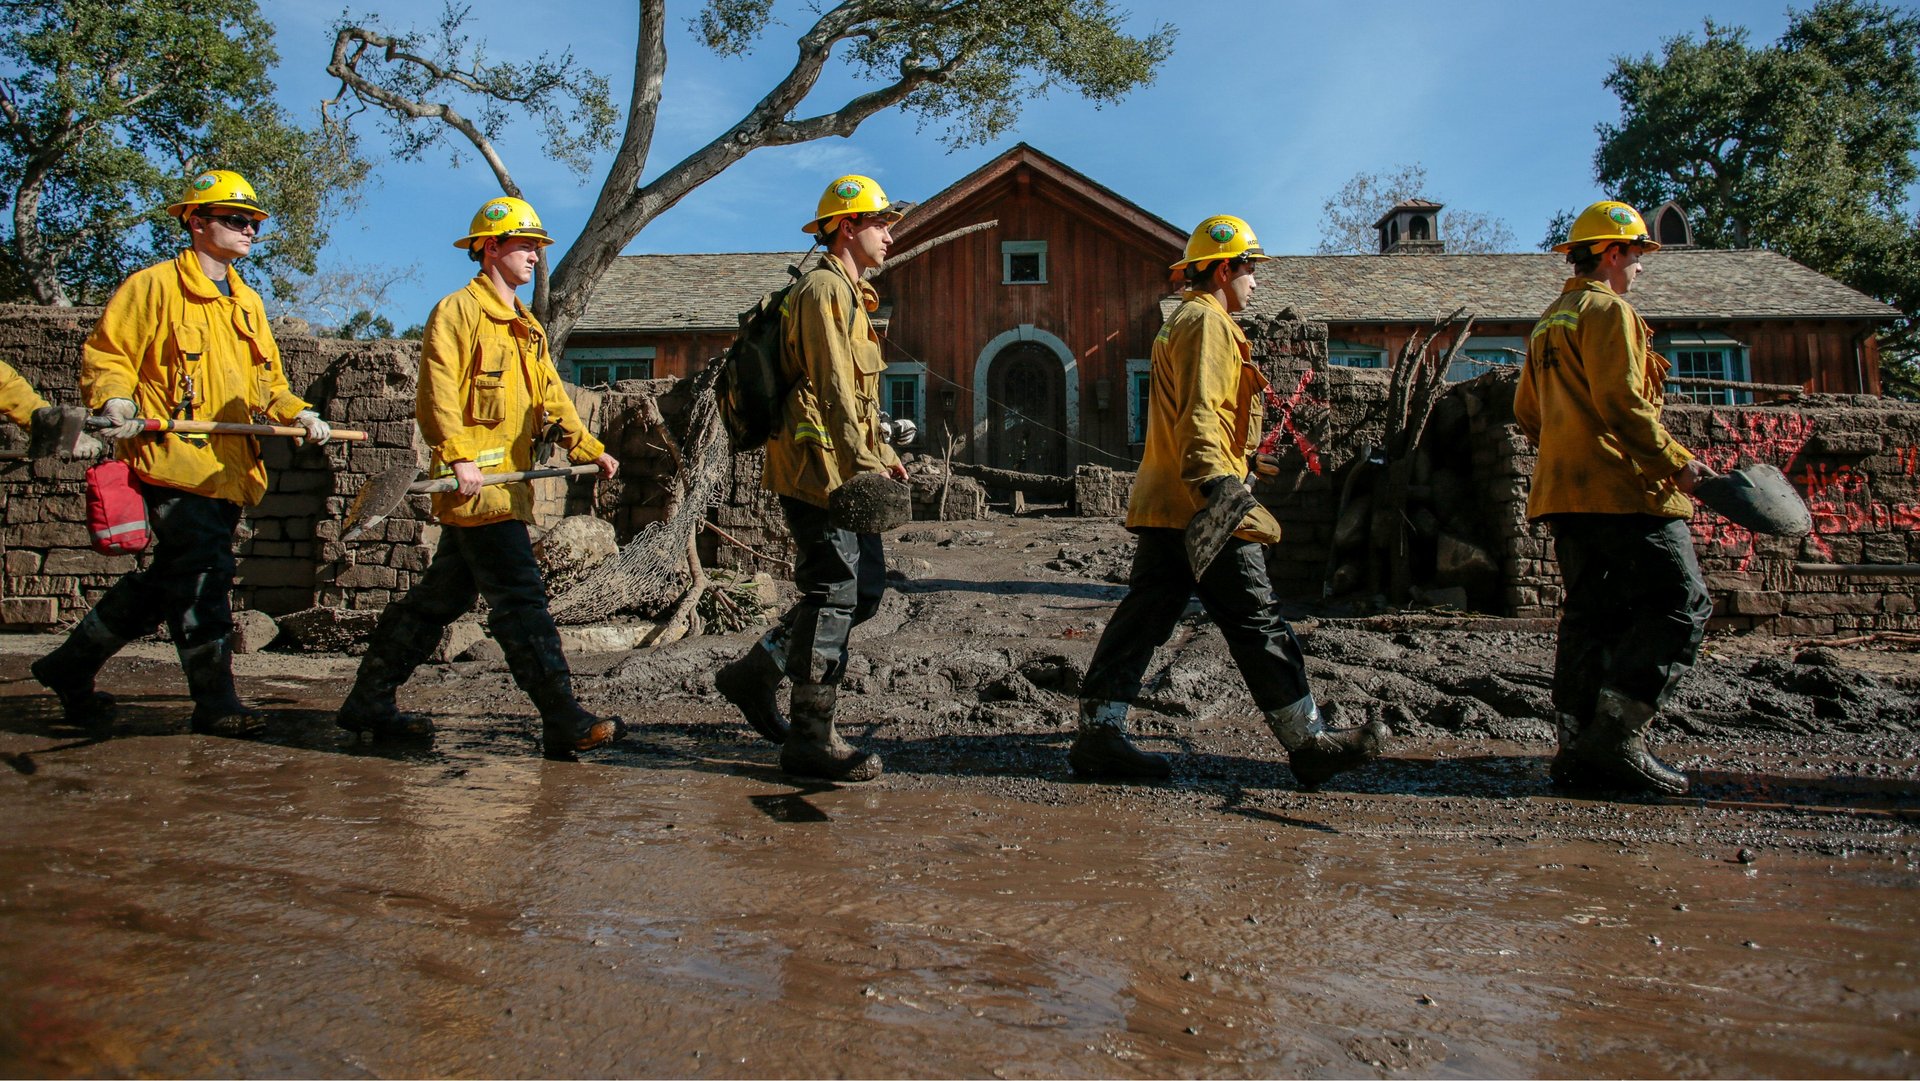
Scenic hill slopes can be inspiring—or deadly, as we are seeing after the disastrous debris flows that have ravaged the community of Montecito, California in the wake of heavy rains on Tuesday, January 9th. At least 20 people are dead, and four remain missing. More than a hundred buildings have been destroyed or damaged by moving walls of mud and boulders that rumbled down creeks and canyons into houses and roads.
As mountains rise, erosion tears them down. And Southern California’s mountains are rising fast, squeezed up by the action of the region’s active faults. This produces steep slopes that erode quickly, though much of that erosion happens in infrequent events, such as big rainstorms right after big wildfires.
We know that risks vary across the terrain and that some places in landslide-prone zones are more dangerous than others. In some regions the riskiest areas are well downslope or downstream of slide-prone slopes, in the places where debris runs out and comes to rest. Unfortunately, few people are aware of these risks when developers build in and around landslide-prone mountains.
The US Geological Survey estimates that landslides kill 25 to 50 people a year in the United States—more than earthquakes or volcanoes. Yet landslides receive far less attention and research funding than other natural hazards.
Part of the problem is that when a large earthquake strikes, the whole region feels it. But landslides tend to impact localized areas, so they rarely attract widespread attention, except in devastating cases like Montecito. Furthermore, different kinds of landslides present very different hazards. Assessing landslide risks requires an understanding of how erosional processes shape Earth’s surface in different regions.
In a general sense, the threat to Montecito was clear. Scientists and planners have known for decades that the mountains of Southern California are shaped by a cycle of fire, rain, and debris flows. Back in 1989, when I was a graduate student studying landslides, journalist John McPhee published his acclaimed book The Control of Nature. In it, McPhee described scenes of devastation resulting from intense rainfall running off of wildfire-charred slopes to roar down canyons around Los Angeles.
The Montecito disaster did not come as a complete surprise. Indeed, the US Geological Survey warned of high potential for disastrous landslides if intense rain fell on mountainsides around Santa Barbara that had been scorched by the Thomas wildfire in December. When that perfect storm landed, it hit bare, baked soil that could not readily absorb water. So the rain ran off, picking up soil, boulders, and debris as it surged down canyons and streams. These debris-charged torrents slowed only where steep channels gave way to gentler slopes.
Most of the damage occurred along the run-out pathways of the debris flows-areas where material can flow after it starts sliding downhill. Yet landslide hazard maps generally don’t show predicted run-out zones. Instead, they typically show only the locations of the source areas where landslides are likely to start.
There are reasons why people keep building homes in landslide-prone areas. Some decide it’s worth the risk. In Seattle, where I live, steep slide-prone slopes tend to offer the best, and most expensive, views. Conversely, in low-income regions such as Appalachia and many developing countries, the poor often are pushed up onto potentially unstable hillsides. Generally, however, I suspect that many Americans living in landslide country are simply unaware of potential hazards that the lay of the land presents to their homes, neighborhoods, and businesses.
Sometimes politics or greed plays a role. After Hurricane Frances hammered North Carolina in 2004, the state legislature approved a program to map landslide hazards. But once the first maps were produced, the program was canceled over concerns that the maps would affect land values and be used to regulate development.
Without this kind of information, residents are physically and financially exposed. “Earth movement,” such as landslides, generally is not covered by homeowner’s insurance policies. And by the time a landslide comes, developers are long gone, leaving homeowners holding the bag.
And, of course, different types of landslides pose different risks. In the slow-moving Rattlesnake Ridge landslide in central Washington state, a 20-acre parcel of land is sliding downhill about a foot and half per week. Residents have been moved out of the at-risk zone, and engineers and geologists are monitoring the site in real time to evaluate and update hazard assessments.
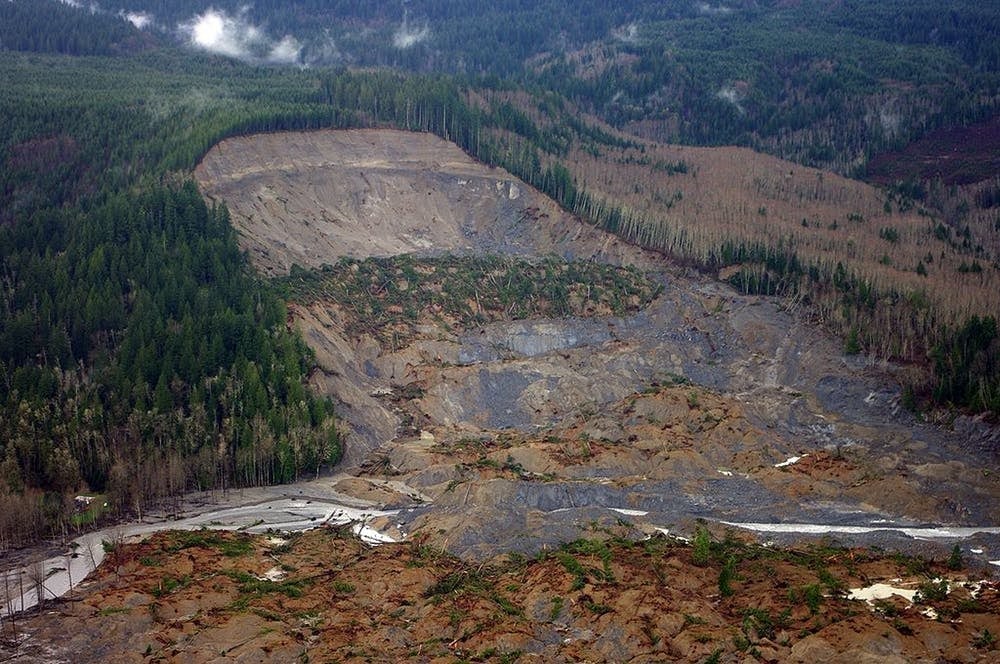
In contrast, the Oso landslide north of Seattle on March 22, 2014 was so large and fast-moving that even a real-time warning would not have prevented tragedy. This disaster killed 43 people in a couple of minutes when an entire hillside collapsed. In response, Washington state has started posting detailed topographical maps online for use in identifying areas at risk for generating landslides. But hazard maps still don’t identify potential downhill run-out zones.
It’s time to get serious about landslide zoning, in the way that the federal government maps areas at serious risk of flooding. Landslide hazard maps delineating potential run-out zones should be part of local land use planning. These maps could help guide zoning decisions and better inform homeowners, banks, and insurance companies of potential risks. Ultimately, the best way to reduce landslide risk is to avoid building things we value in places where run-out is likely. For when there’s no controlling nature, there’s only living with her.
This article was originally published on The Conversation. Read the original article.