The race to build a self-driving car, charted
Earlier this week, the California department of motor vehicles announced it would grant permits for fully autonomous cars on the road starting in April. By this spring, there could be cars driving themselves in the Golden State without a single human inside.


Earlier this week, the California department of motor vehicles announced it would grant permits for fully autonomous cars on the road starting in April. By this spring, there could be cars driving themselves in the Golden State without a single human inside.
California has been active in setting rules for autonomous-car companies, requiring reports from each company tracking how far they’ve driven and how often their cars have had to “disengage” during test drives. Disengagement is when a human test-rider feels uncomfortable or unsure of what the car is doing, and he or she takes the wheel and shuts down the automated driving system. These reports are valuable, because if one of Waymo’s test drivers is uncomfortable with the car’s behavior, it’s reasonable to assume you might be too.
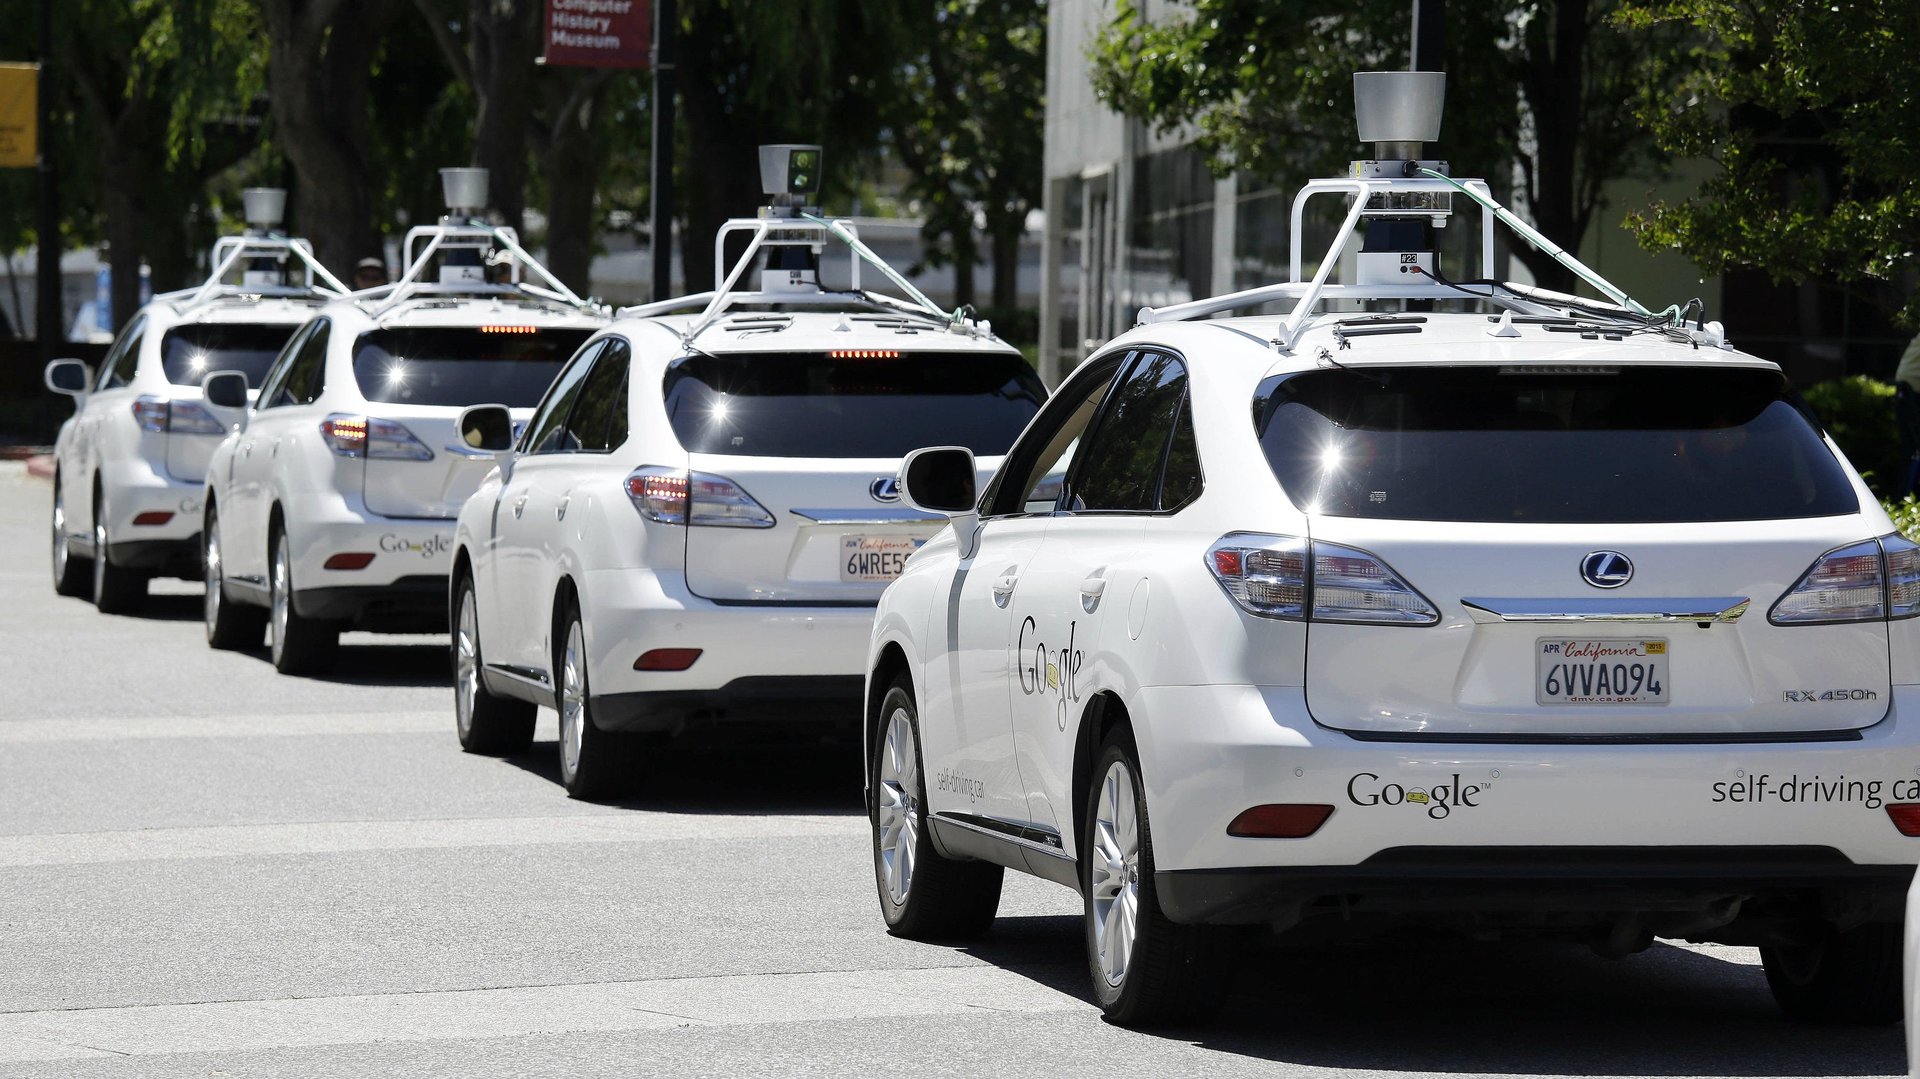
So which car company should you trust to ferry you come April (assuming all of the autonomous car companies currently testing in California apply for a permit)? The answer is resoundingly Waymo, Alphabet’s self-driving car division.
On average in 2017, the Alphabet company drove more than four times the distance without a human taking over than its closest competitor, GM Cruise.
It’s tough to know if these numbers are a perfect comparison, though. Waymo and other companies test all over the world, in places like Arizona, Pennsylvania, and parts of Europe, where these kinds of disclosures aren’t mandatory. In addition, testing on private property doesn’t have to be reported, so this only accounts for test drives on public roads. All public roads aren’t created equal, either. Some companies test in cities, while others test in slower-paced suburban areas. The data are a bit out of date as well, spanning from January to November 2017.
By another standard, each autonomous-car company that drove every month improved over the course of the year. But Waymo improved the most, jumping from about 2,300 miles without a disengagement in June 2017 to some 30,500 miles without one in November.
Below is a table of each company’s miles per disengagement in the first half of the year, compared to the second.
If you’re interested in exploring the data more, you can either pull them yourself from the California DMV site, or take advantage of our hard work and look at them on a spreadsheet here.