An economist gave the most compelling design talk at TED—about doughnuts
There were plenty of great design talks at the TED conference this year. Over the five-day ideas conference held in Vancouver last week, revered architects, urbanists, engineers, and a winsome illustrator took turns regaling the audience about the power of design to create a beautiful, more humane future.


There were plenty of great design talks at the TED conference this year. Over the five-day ideas conference held in Vancouver last week, revered architects, urbanists, engineers, and a winsome illustrator took turns regaling the audience about the power of design to create a beautiful, more humane future.
But it was an economist who arguably gave the most compelling and consequential design talk of all.
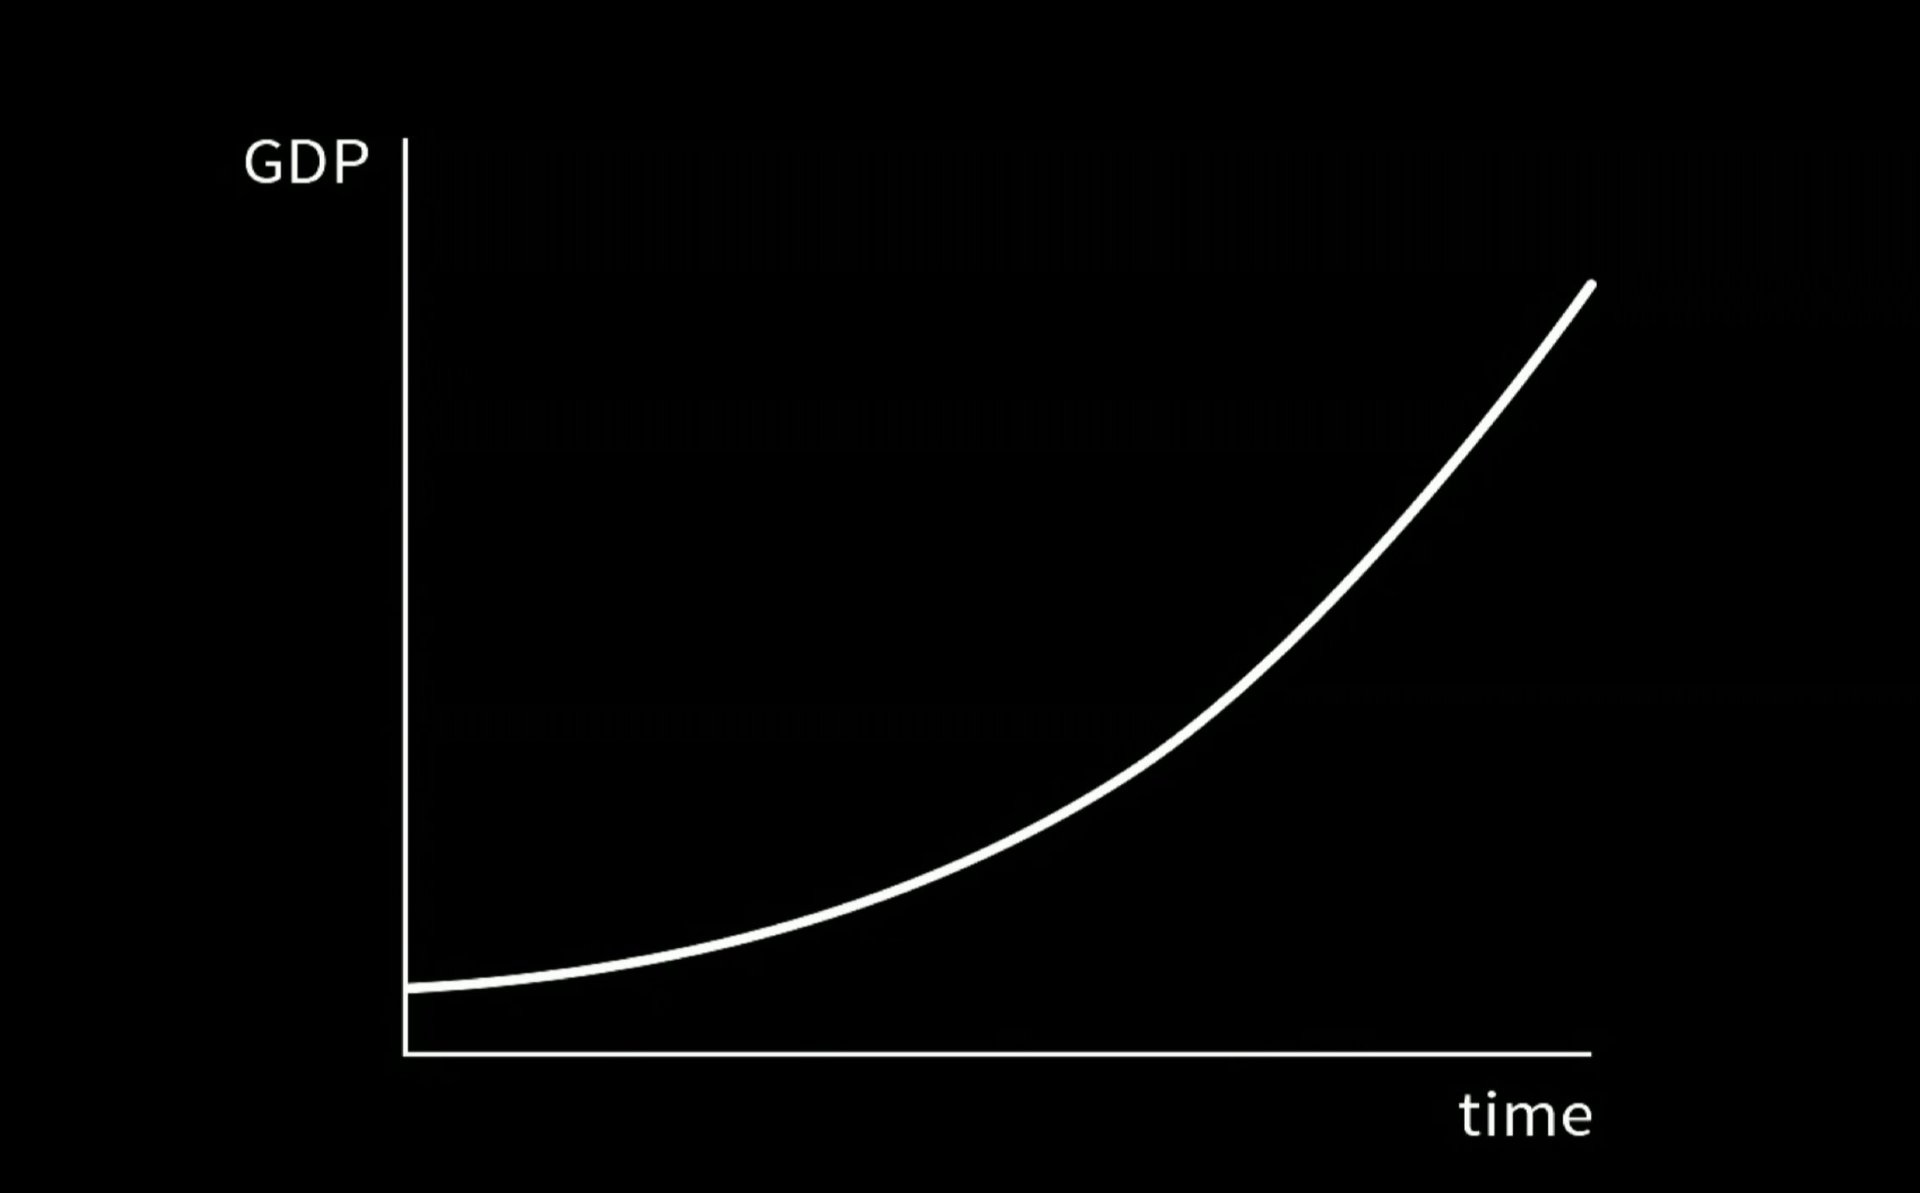
In a 15-minute lecture, Oxford University researcher Kate Raworth traced today’s economic ills to one obsolete graphic: the growth chart. Used by every government and corporation as the single metric for progress since the 1960’s, the growth chart instills the fantasy of unending growth without regard for the finite amount of resources available. Specifically, every government thinks that the solution to all problems lies in more and more GDP growth, she said.

The rage for unlimited upward trajectories was propagated by the American economist Walt Whitman Rostow, an advisor to presidents Lyndon B. Johnson and John F. Kennedy. The author of the seminal 1960 text The Stages of Economic Growth: A Non-Communist Manifesto, Rostow outlined an oft-quoted five-step ladder of prosperity that culminates in what he called the “age of high mass consumption.” At that point, Rostow suggested, economies achieve a utopia in which consumers can buy anything they wish.
“You can hear the implicit airplane metaphor,” said Raworth. “But this plane is like no other because it can never be allowed to land. Rostow left us flying to the sunset of mass consumerism.”
The obsession with growth was also promoted by Edward Bernays, the nephew of Sigmund Freud and so-called “father of public relations.” Raworth explains how Bernays used his uncle’s tactics to to convince the public that buying stuff would make them happy. His most famous ad campaign, “Torches of Freedom,” convinced women that smoking cigarettes was a feminist act.
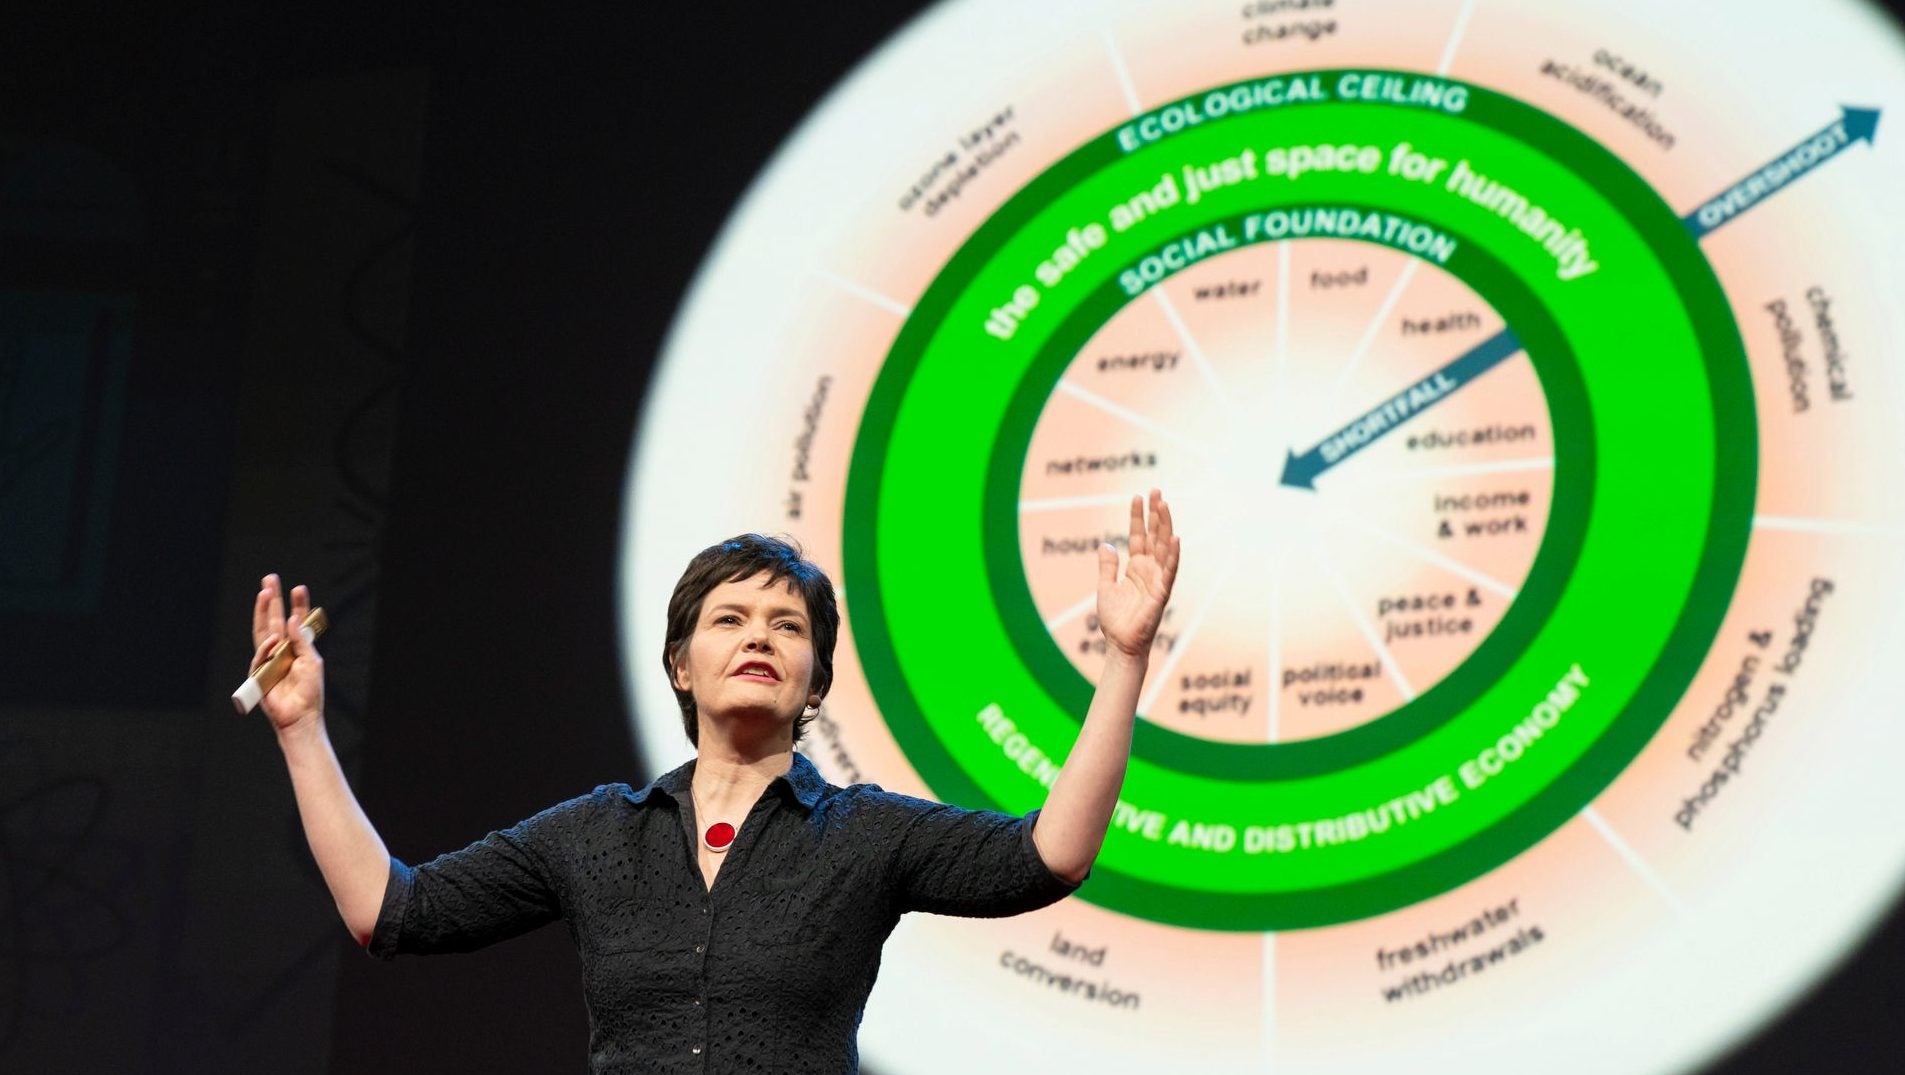
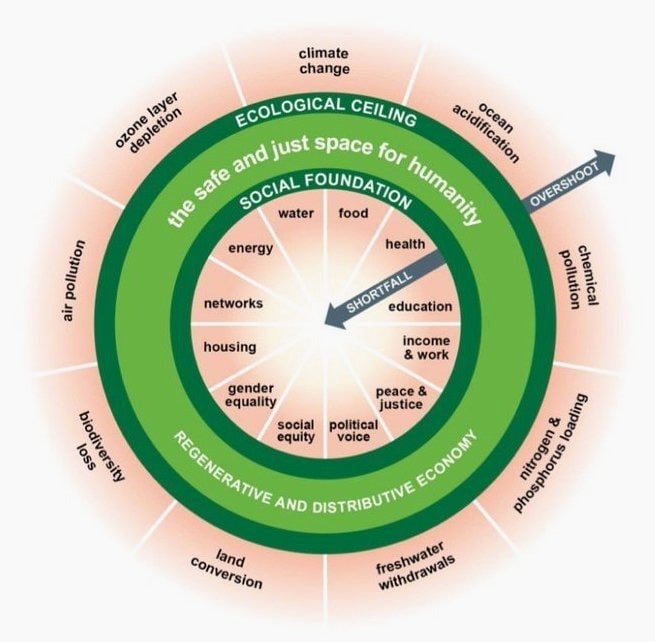
“It’s time to reimagine the shape of progress,” said Raworth, who wrote the 2017 book Doughnut Economics: Seven Ways to Think Like a 21st-Century Economist. Instead of a rising growth chart, she proposes a new design: A dashboard of indicators, shaped like a doughnut. Her emphasis is balance, not growth.
The doughnut of social and planetary boundaries (2017)

In the same way that good designers anticipate their audience’s spectrum of needs, Raworth’s doughnut model considers a range of factors that lead to a higher quality of life. Instead of fixating on material wealth, she lists 12 dimensions of the social foundation based on the 2015 UN Sustainable Development Goals. At the center of her sketch is a green doughnut in which humans thrive, thanks to factors like housing, income, education, gender equality, and sufficient food and water. Beyond that is a ring of 9 environmental indicators, including air pollution, climate change, and loss of biodiversity.
The goal is to get people out of poverty, but not to overshoot the doughnut and deplete the planet’s resources. The doughnut model rejects “this ever rising line of growth,” Raworth said. Instead, the focus is on finding “a sweet spot for humanity—thriving in dynamic balance between the foundation and the ceiling.”