Meteorologists can finally stop throwing out good data on hurricanes
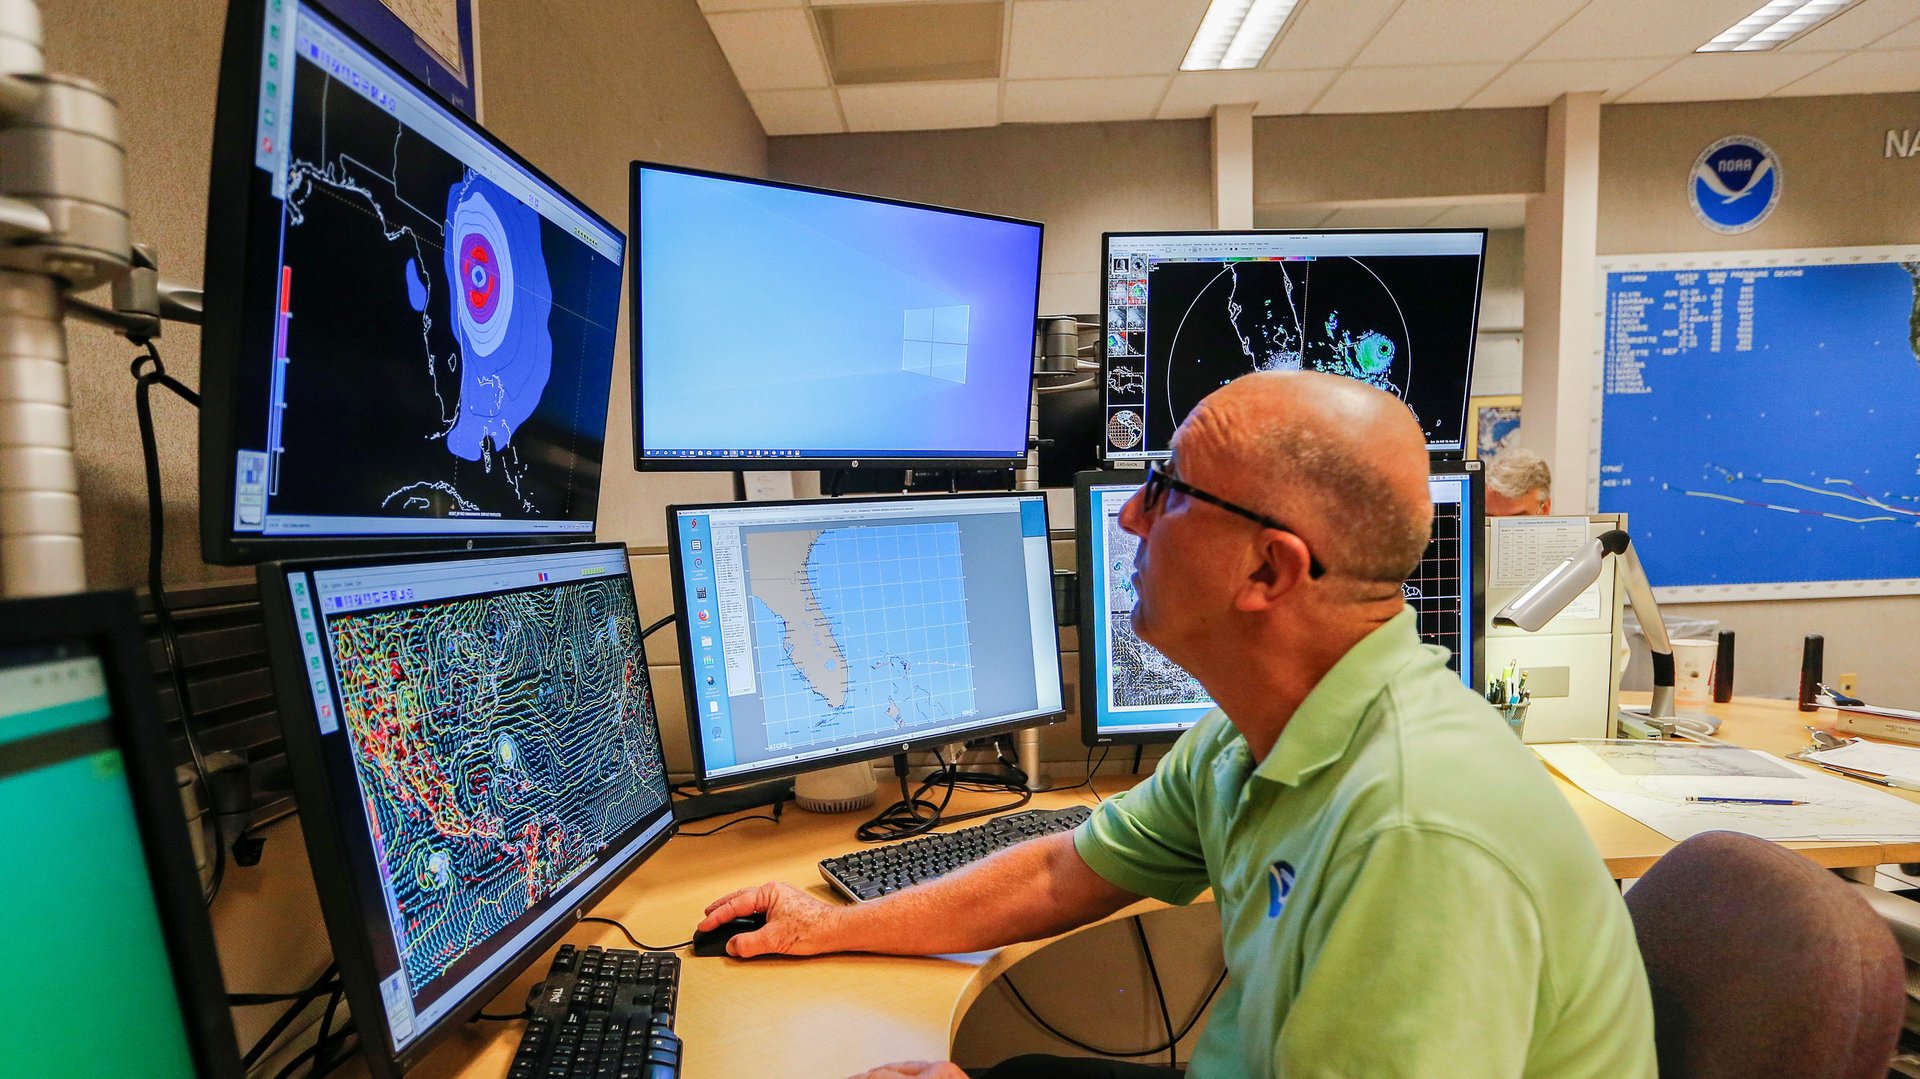
Whenever a hurricane begins to brew in the Atlantic, mountains of data pour into weather models to help meteorologists forecast where the storm will go and how strong it’ll get.


Whenever a hurricane begins to brew in the Atlantic, mountains of data pour into weather models to help meteorologists forecast where the storm will go and how strong it’ll get.
In one end go observations collected by satellites, hurricane hunter airplanes, and dropsondes—tennis-ball-tube-sized devices dropped through a storm to take measurements at different altitudes. Predictions about the storm’s path and intensity come out the other end.
But although we’ve gathered vast troves of storm data since the late 1950s, at the start of this decade, hurricane models used almost none of it. As Hurricanes Irene, Isaac, and Sandy passed by—leaving nearly $100 billion in damage in their wake—the best meteorologists could do was fit a few dropsonde data points into their models.
“We’ve been flying through these storms for years collecting observations and all that stuff fell on the floor,” said Frank Marks, who leads NOAA’s Hurricane Forecast Improvement Program. “In the last five or six years we’ve really started making use of that information.” By the time Hurricanes Harvey, Irma, and Michael rolled around, data from airborne radars and satellite microwave sensors were shaping the forecasts splashed across weather watchers’ TV screens.
Faster computers and stronger weather models developed throughout the 2010s have allowed meteorologists to make major improvements in data assimilation—the process of using real-world observations to improve hurricane models’ predictions. That’s one of the factors that have reduced the average error in hurricane forecasts by two-thirds in the last 25 years. Now, meteorologists are working to exploit new sources of hurricane data to make forecasts even more accurate.
A tempest in a terabyte
Data assimilation is a complicated and resource-intensive computing problem. NOAA’s Hurricane Ensemble Data Assimilation System runs on a 1,500-core processor and churns through 10 terabytes of data to make sense of hundreds of thousands of observations, every six hours. “The big bottleneck is computing power,” said Jason Sippel, who develops data assimilation systems for NOAA. “It’s expensive, and there are only so many dollars to go around.”
The other major challenge has been improving hurricane models enough that they can handle the incoming real-world data. In 2011, the Hurricane Weather Research and Forecasting (HWRF) model, the major US hurricane model, could represent one data point for every 5.6 miles (9 km). But the eye of a hurricane is usually 20-40 miles (30-65 km) wide, so no matter how much data meteorologists recorded from the all-important center of the storm, only a small handful of points could fit into their model.
Because of these limitations, the HWRF model only started incorporating data from doppler radars mounted on the tails of hurricane hunter planes in 2013. Limited uses of satellite data and “high density” plane observations (that is, a reading every few kilometers instead of a few data points for every flight) didn’t make it into the model until 2017. And just last year, the model started using dropsonde data from the roiling inner core of hurricanes.
“I think we’re in an exciting time in terms of our computing capabilities,” said Robert Nystrom, a meteorology researcher at Pennsylvania State University. “There’s a lot of room for improvement in the near future as we begin to pull all these different types of observations together.”
Eyes in the sky
In the next decade, meteorologists will work on bringing new streams of data into their models, especially from satellites. Weather satellites have the advantage of being able to take frequent snapshots of storms, unlike hurricane hunter jets that only fly every six hours.
Satellites may not be able to take direct observations from inside the storm, but they can measure infrared light, which gives them an indirect measure of air temperature, and microwaves, which offer clues about the structure of the storm. Unfortunately, both of these bands of light tend to get scattered and distorted by clouds and rain—which hurricanes have in spades—leading to noisy data that’s difficult to use.
In July, Penn State researchers demonstrated a new method for cleaning up and using infrared data, which they showed would have more accurately predicted the destruction of 2017’s Hurricane Harvey, one of the costliest hurricanes in history. The team drew their infrared observations from a new, high-powered constellation of NASA satellites called GOES-16, which came online in 2017. But Sippel, the NOAA data assimilation developer, says it’ll likely be another three years before meteorologists can use observations from GOES-16 in working models.
Further improvements could come from incorporating observations from CYGNSS, a NASA satellite constellation that launched in 2017 and can measure surface winds over the ocean, and TROPICS, a planned constellation of cubesats that will excel at reading microwaves, Sippel added. But he predicts that figuring out how to clean up that data will take another decade. “We’re not exploiting satellite data nearly as much as we could be,” Sippel said.
But meteorologists see these challenges as a cause for hope.
“We definitely believe that by capitalizing on these studies and making effective use of satellite data we can improve initial conditions and improve forecasts,” said Vijay Tallapragada, who runs the modeling and data assimilation branch of the US National Weather Service. “That is the last missing link in our capabilities to improve hurricane forecasts.”