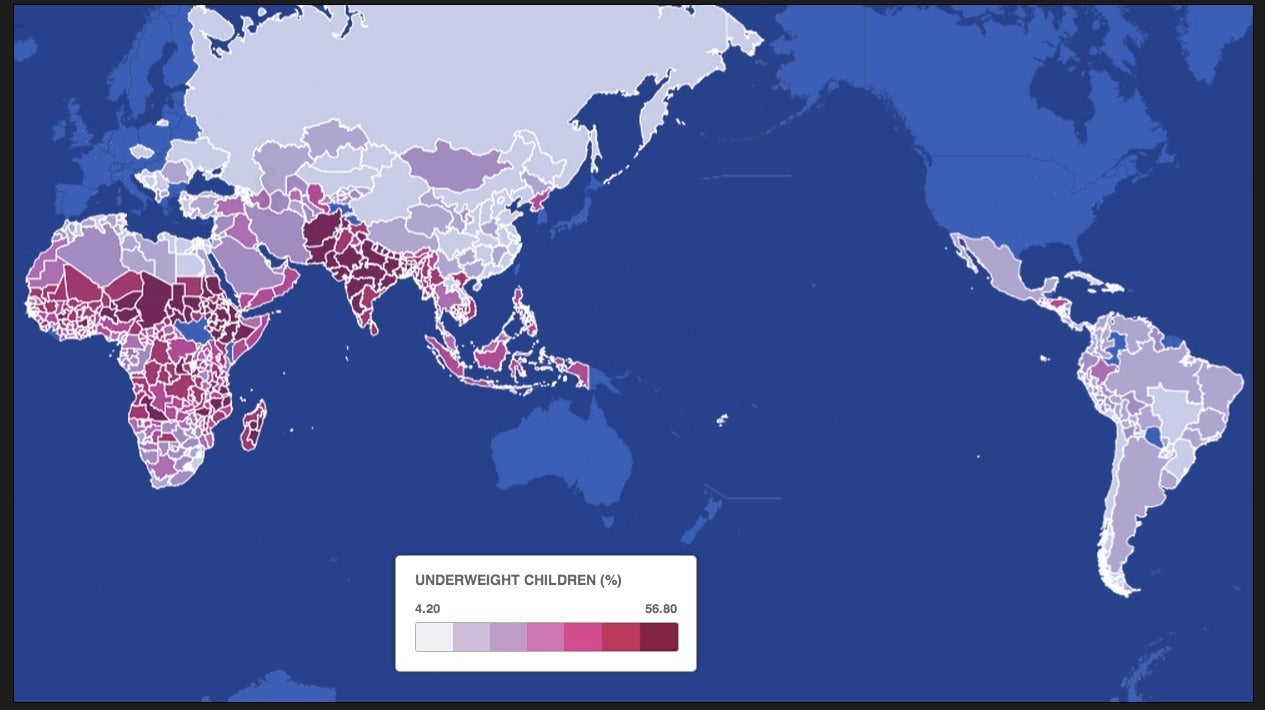
Few maps are more concerning than this one. Created by journalist Tim De Chant, it shows the percentage of children in each country whose weight is “more than two standard deviations below the median of the NCHS/CDC/WHO International Reference Population.”
In other words, this map depicts the percentage of children in each country who are dangerously underweight on account of malnutrition. (Quantifying just how underweight these children are is difficult without knowing the variation in weight in the study population.) Data are from 1990 to 2002 and countries in blue indicate no data was available.
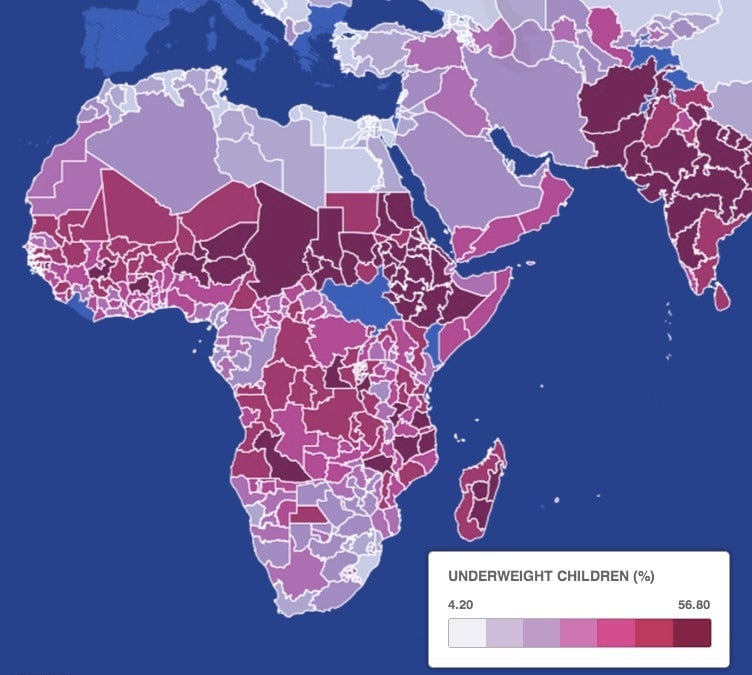
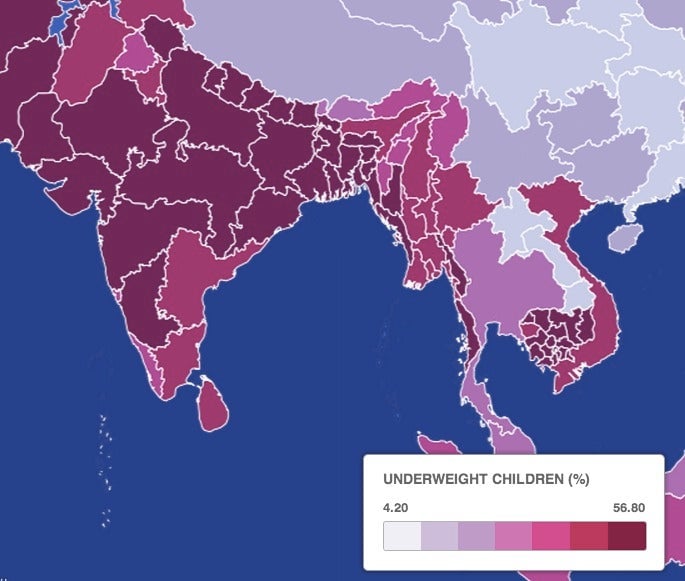
That belt of red stretching from Africa through India, encompassing tens of millions of children, represents perhaps the biggest waste of human capital in history. Children who suffer from malnutrition are more susceptible to disease, less capable of getting an education and are likely to suffer from permanently stunted growth.
Many of the regions experiencing highest population growth are also the ones suffering the highest rates of child hunger.