Congratulations, IMF, you’re doing a great job at stoking the next crisis
The International Monetary Fund just provided a perfect example of doublethink. As coined by George Orwell in his novel 1984, “doublethink” is the act of simultaneously believing that two mutually contradictory ideas are correct. Here’s how the IMF exemplifies this:

The International Monetary Fund just provided a perfect example of doublethink. As coined by George Orwell in his novel 1984, “doublethink” is the act of simultaneously believing that two mutually contradictory ideas are correct. Here’s how the IMF exemplifies this:
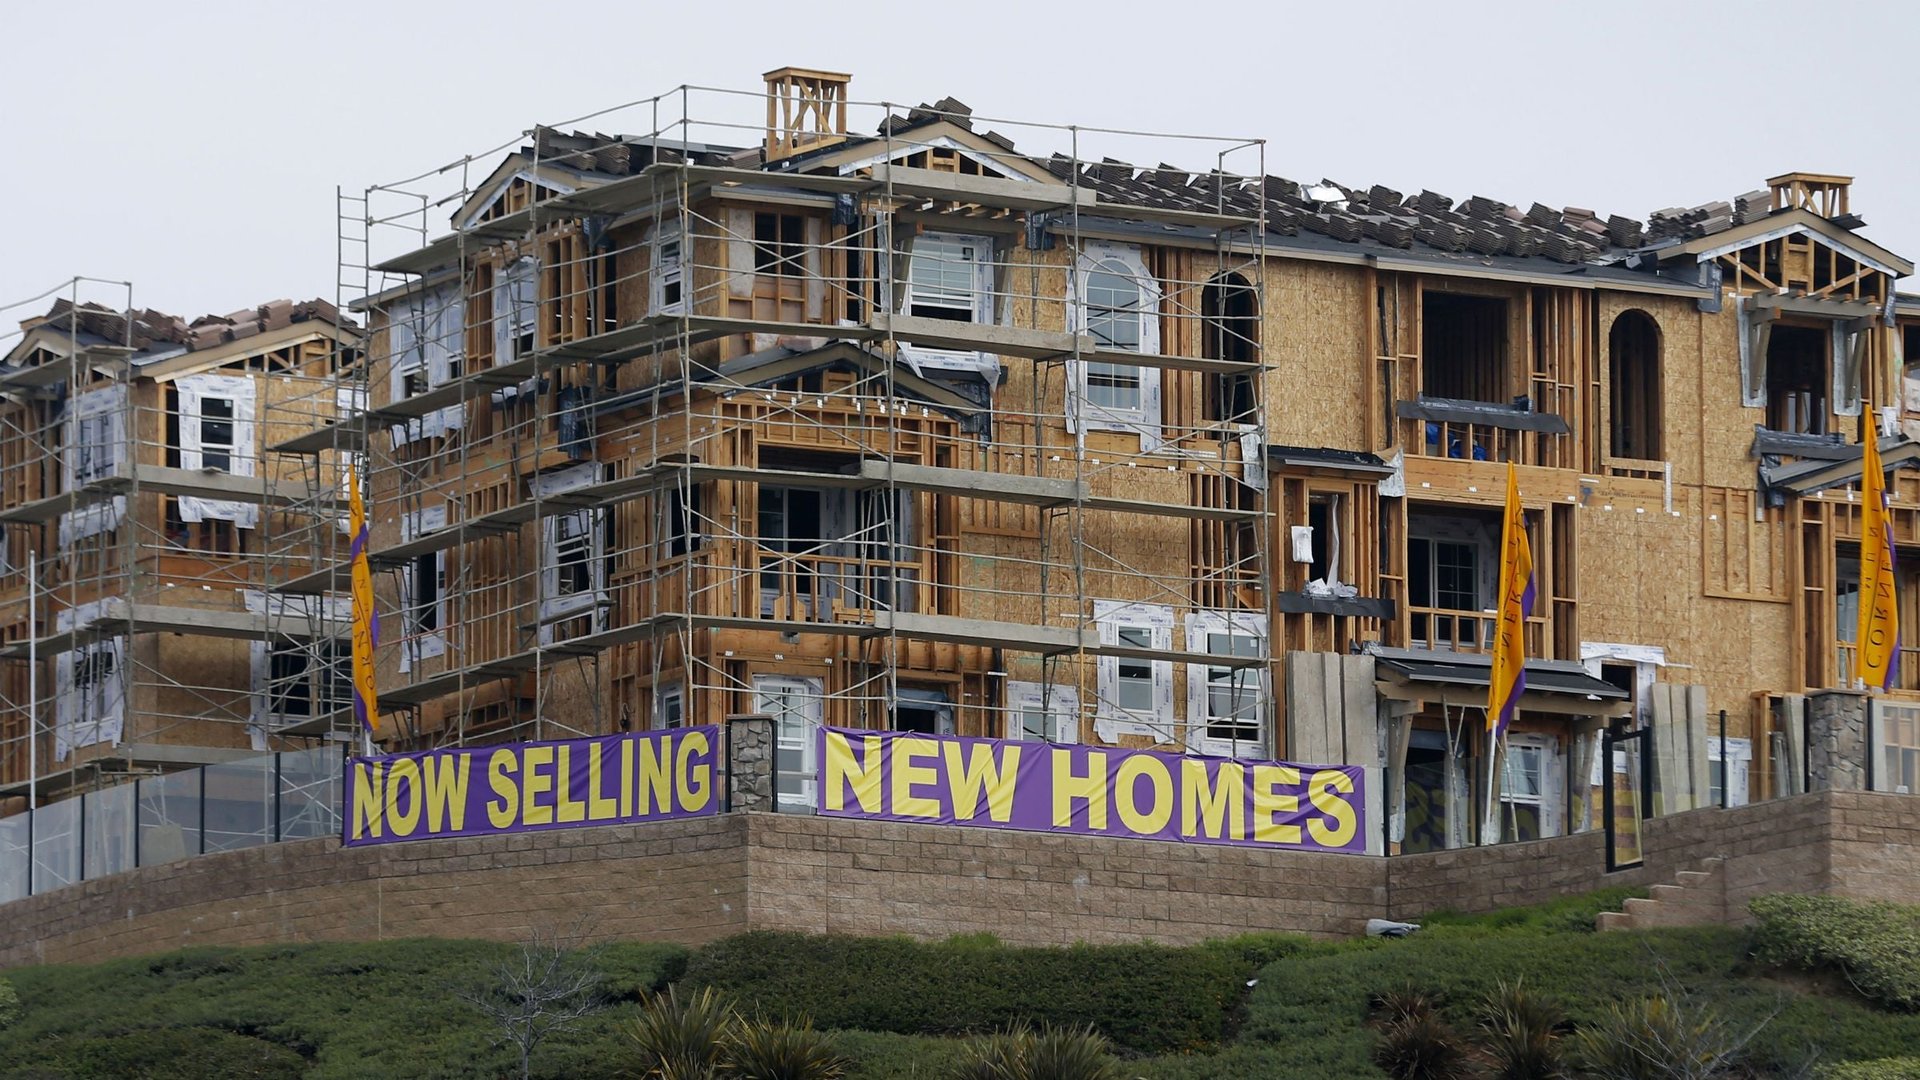
On June 11, Min Zhu, the deputy managing director of the IMF, warned that house prices are well above their historical average in many countries and called for remedial action:
The tools for containing housing booms are still being developed. The evidence on their effectiveness is only just starting to accumulate. The interactions of various policy tools can be complex. But all this should not be an excuse for inaction. [his italics]
Clearly, these words reflect concern over housing bubbles still unpopped in many countries, along with a recommendation that that they should be stopped before they end in crises.
Less than a week later, on June 16, his boss and IMF managing director Christine Lagarde said that the US will have to keep interest rates low for longer than the markets expect, at least until 2015, maybe much longer.
Low interest rates and high asset prices
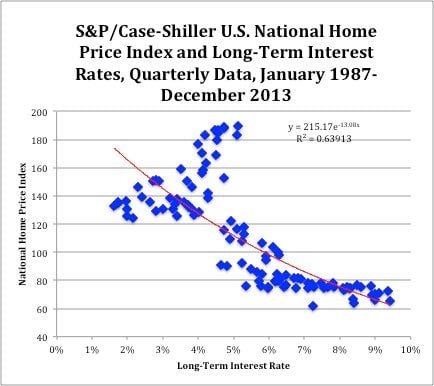
These parallel statements evidence doublethink because very low interest rates—such as those that the IMF is recommending—increase asset prices and create asset bubbles, including housing bubbles. The following graph shows this relationship for housing in the US.
Each diamond represents the interest rate and the housing price prevalent in one particular quarter from Jan 1987 to Dec 2013. You can see that lower interest rates are associated with higher housing prices. The number R2=0.63913 represents the share of the differences in home prices in two different dates that can be attributed to the differences in long-term interest rates. At 63.9%, it is quite substantial.
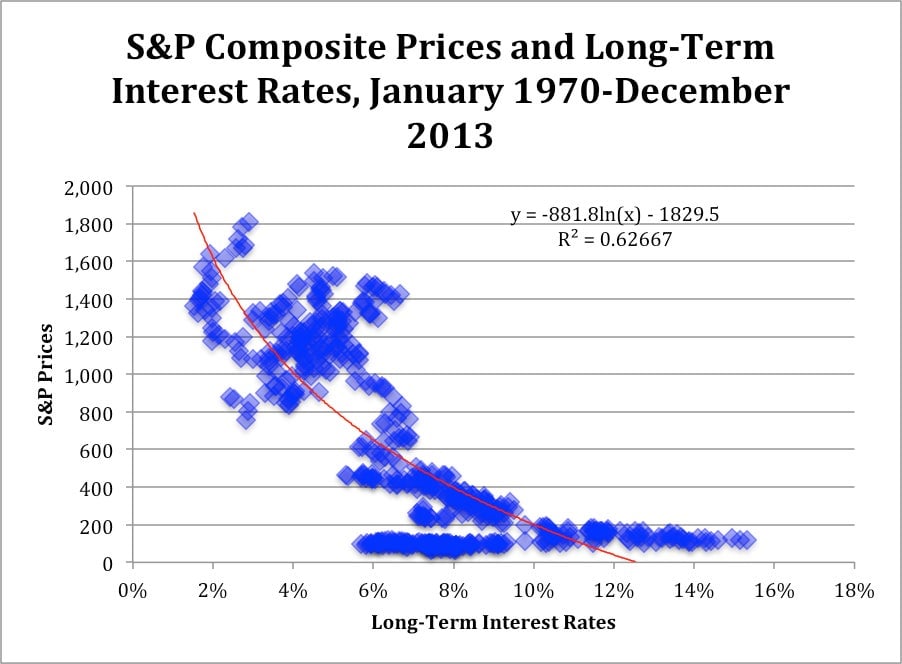
The negative relationship between interest rates and asset prices for equity shares can be appreciated in the next graph. As in the case of housing, approximately 63% of the differences in price levels are attributable to differences in interest rates.
Thus, it seems shocking that the IMF, which has been promoting a policy of extraordinarily low interest rates for a long time, is now expressing concern that these rates are producing what they have always produced: high asset prices. Even more shocking is to focus its concern only in the case of housing, and not in that of equity shares.
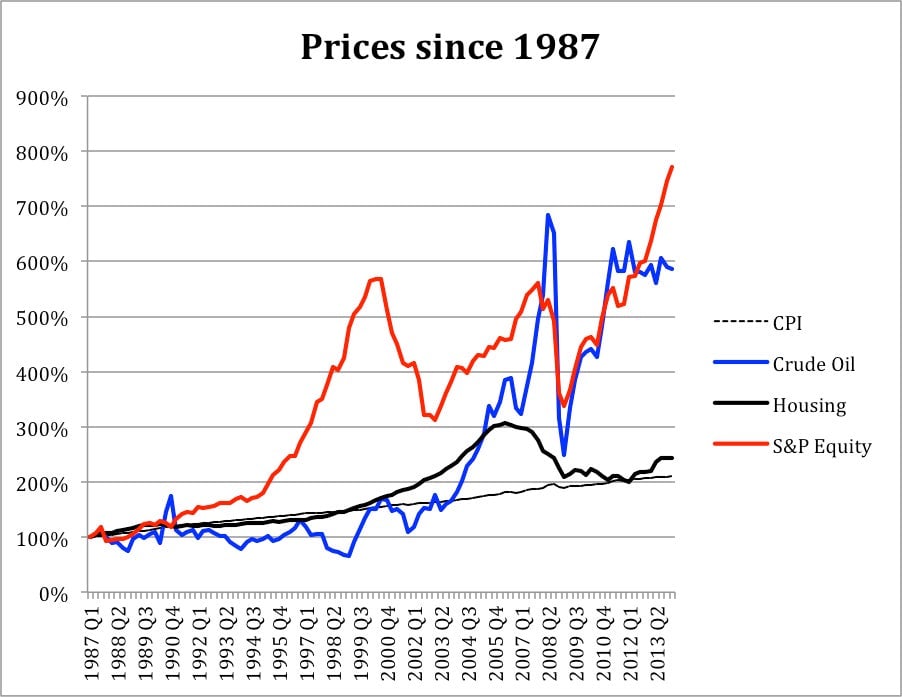
This is even more shocking because, as shown in the next graph, equity prices have increased substantially more that housing prices since former US Federal Reserve chairman Alan Greenspan inaugurated the era of low interest rates and highly expansionary monetary policies. By the end of April 2014, housing prices in the US had increased only 5.3% more than the Consumer Price Index (CPI) in the 27 years since 1987. By contrast, equity shares increased 106.7% in the same period.
If the behavior of housing prices raises fears of a repetition of the crisis caused by the bursting of the previous housing bubble, the fears of a bubble of equity shares should be much worse because they are much more out of line. Also, as it is evident in the graph, shares have had two bubbles in the last two decades. Housing had only one. The IMF data does not put the US in the forefront of the housing risks. Yet, even if they do not mention it, it is obvious from the graph that the equity markets could be at risk.
How high are the risks of a collapse of prices?
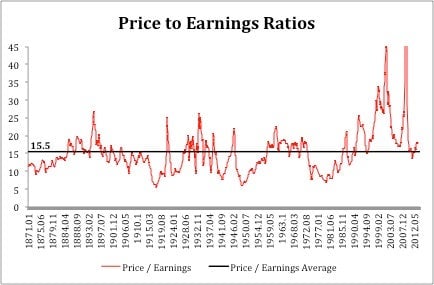
You might argue that the risks of a crisis in equity shares are low because, while their prices have increased enormously, their earnings have increased at almost the same rate. The next graph shows how, at 17.7, the price to earnings ratio (a rough but widely used measure of the value of shares) in June 2014 was only 16% higher than 15.5, its long run average.
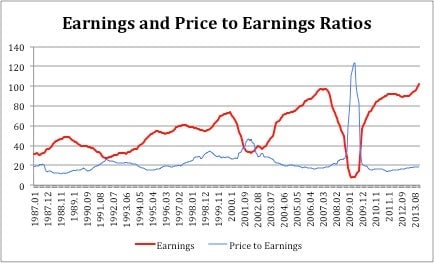
However, putting too much trust on the price to earnings ratio to asses whether equities are overpriced or not may be imprudent because, as shown in the next graph, earnings can fall very quickly during a crisis, turning overnight a reasonably priced share into a highly overvalued one.
For example, note how the price to earnings ratio seemed quite reasonable (similar to today’s ratios) from 2003 on and up to mid-2007. That’s when suddenly earnings went down catastrophically (92% from June 2007 to Mar 2009), increasing the ratio to 120, an unsustainably high level. Prices then fell by 51%. That is how prices fall so abruptly after having been stable or even increasing for a long time. This is likely to happen when a bubble is in progress because the same reasons leading to equity overvaluation (excessive monetary creation) also lead to unsustainable earnings.
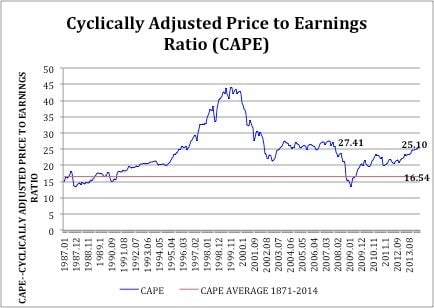
Robert Shiller, winner of the Nobel Prize for economics, produces a modified index to asses the sustainability of equity prices: the cyclically adjusted price to earnings ratio (CAPE), which divides the equity prices not by their current earnings but by the average of their earnings of the last ten years—thus reducing the impact of earnings bubbles in the assessment of the sustainability of the prices. The next graph shows that in June 2014 this measure, the CAPE, was 25.1 while the average since 1871 had been 16.54. Thus, the CAPE is 55% over its long-term average. That is a more risky position. It was 66% over the average in 2007, just before the 2008 crisis began.
Doublethink and thinking straight
Central banks have been trying to spur real economic growth by imposing very low interest rates in the last two or three decades. Rather than spurring higher growth, they have spurred several asset bubbles by increasing asset prices to unsustainable levels. They have kept their policies in place even if they caused two equity shares bubbles, one in housing, and at least one in commodities. Now they are warning the public that still another bubble may be in danger of bursting—a second one in housing. They are not mentioning that their own monetary policies are creating the risk or that such risk also involves equity shares.
If they are worried about another bubble, the central banks should take measures to prevent their formation. All those measures imply an increase in interest rates or an equivalent restriction in monetary creation, which can be done either directly or indirectly through by increasing the banks’ legal reserve requirements (the reserves that banks keep in the central bank), or by increasing the capital required to lend to real estate projects, or through similar measures.
Central banks, however, do not want to take these measures because they would go against their basic policy of keeping interest rates low and monetary creation high. If they do that, they would have to recognize that they do not have anything to do to spur growth and recovery. Faced with this prospect, they rather doublethink than think straight.
But they should recognize that doublethink has daunting costs in this matter, because another crisis would really break the back of the world economy and lead to a crisis without precedent. Their incapacity to solve the problem of growth would be revealed as much as if they start to think straight right now and stop the rising danger posed by the bubbles, but with a much higher cost for the world as a whole.