More and more, the US economy is defined by its metropolitan areas, which produce 90% of its output. On an individual level, some of these metros are themselves quite large. The map below lays this out geographically, including a sampling of how ten cities stack up economically against major nations of the world.

More and more, the US economy is defined by its metropolitan areas, which produce 90% of its output. On an individual level, some of these metros are themselves quite large. The map below lays this out geographically, including a sampling of how ten cities stack up economically against major nations of the world.
The map, by my colleague Zara Matheson of the Martin Prosperity Institute, compares the 2014 projections of gross product for US metropolitan statistical areas to national GDP levels for 2012, the most recent year available worldwide.
Join 500,000+ readers who start their day with Quartz.
By subscribing, you agree to our Terms of Service and Privacy Policy.
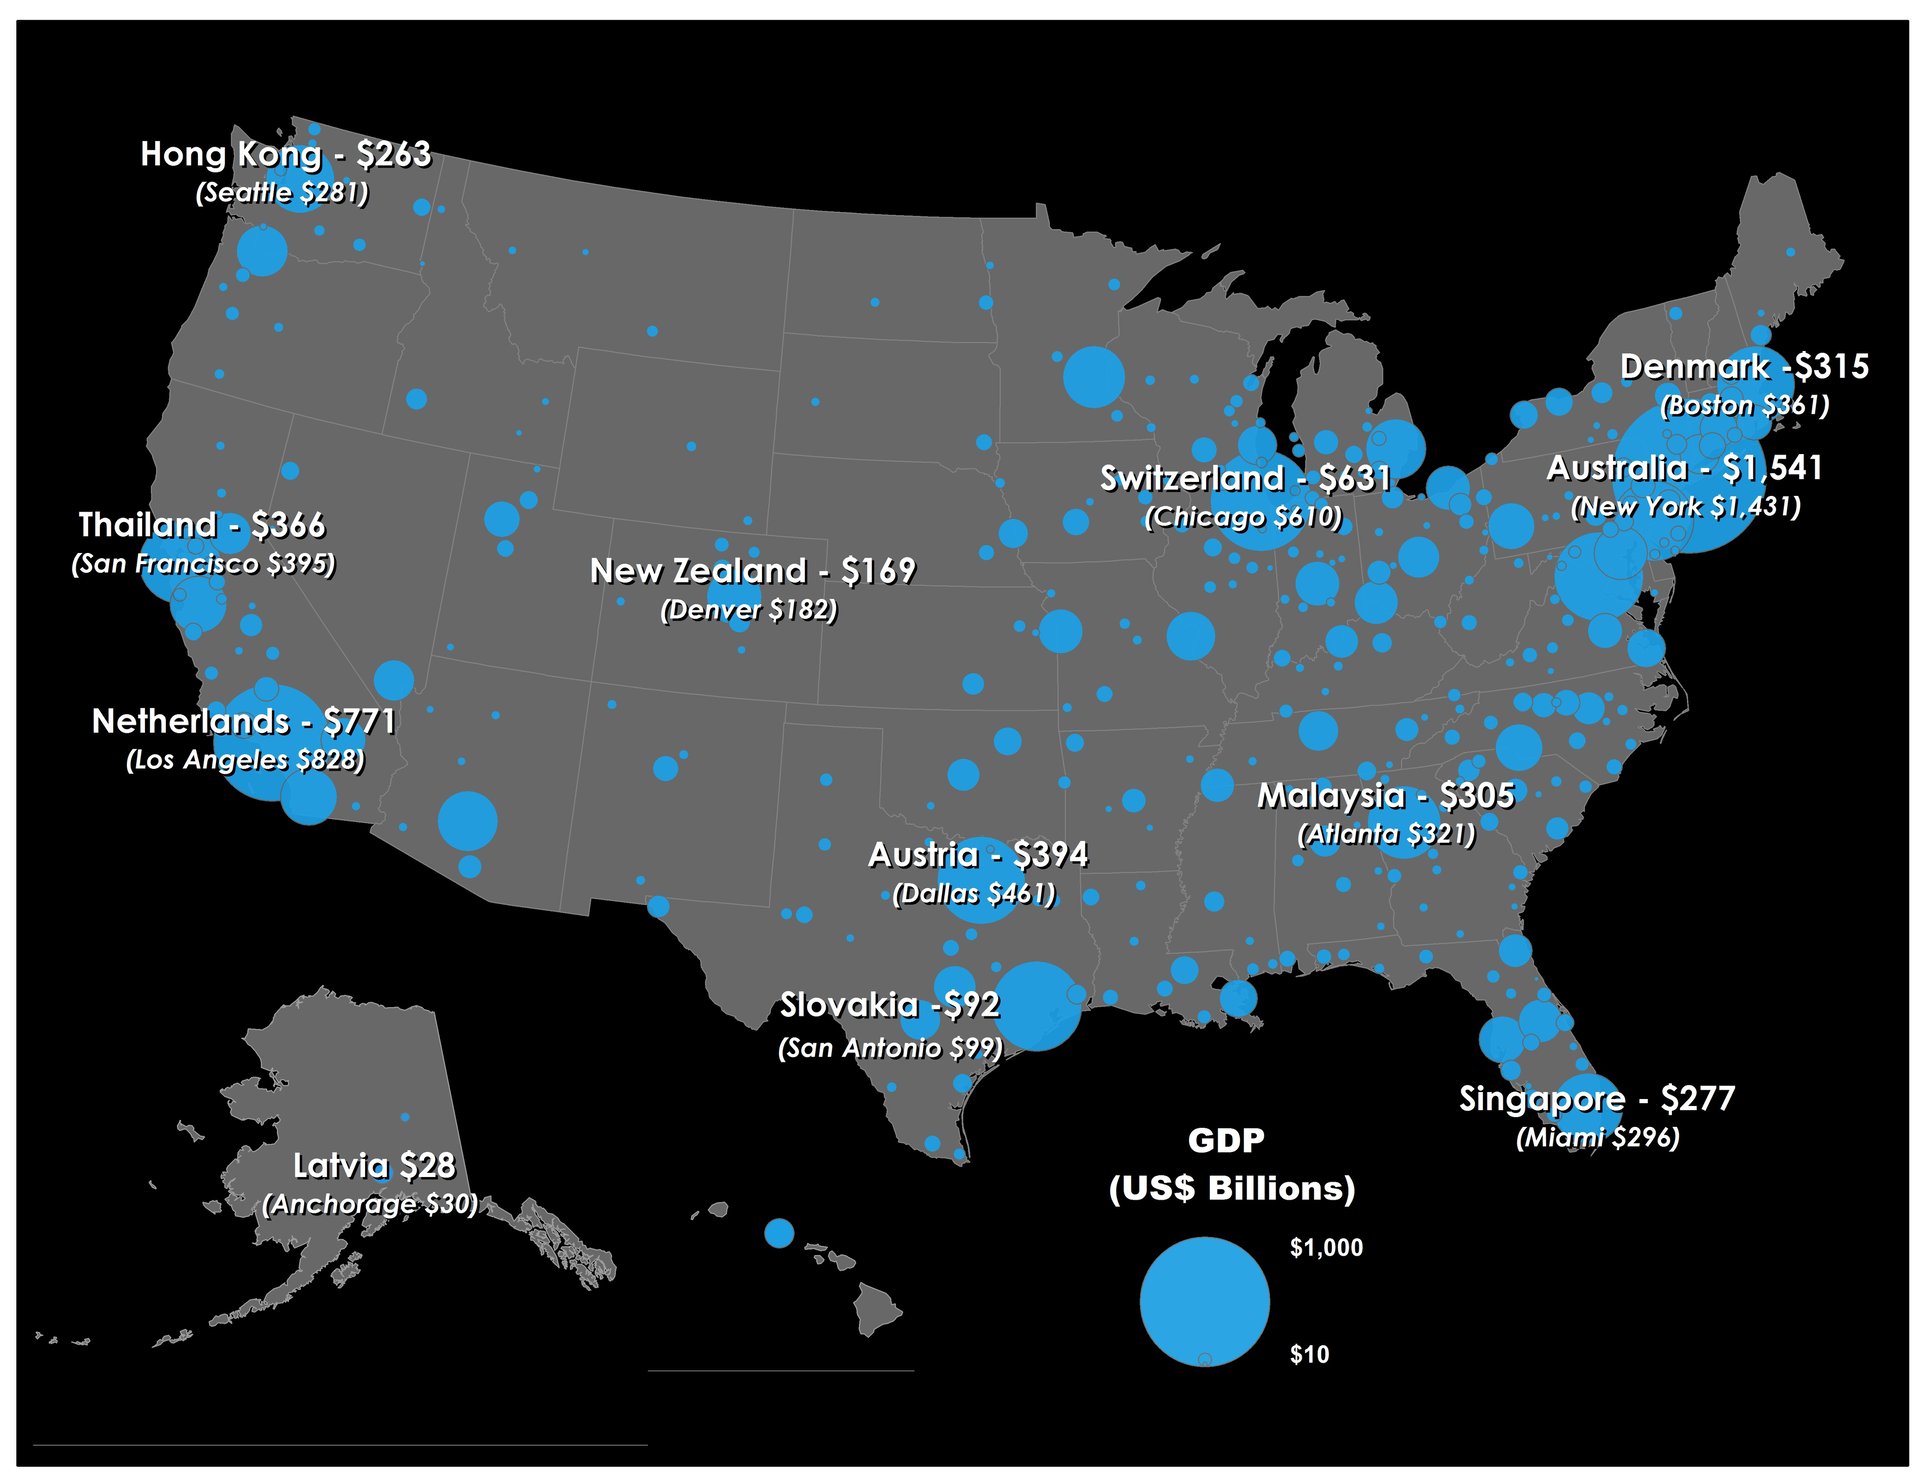
Each of these metros would rank among the 50 largest economies in the world.
And even far smaller metros can outpace some substantial national economies. With $180 billion in GMP, Denver’s economy is comparable to that of the entire country of New Zealand. Even Anchorage, Alaska, projected to produce nearly $30 billion in GMP, is about the same size as Latvia.
