The ability to attract skilled workers is a key factor, if not the key factor, in the growth of cities and metro regions. Cities themselves are understandably keen to tout when their populations are growing, but just tracking overall population can mask the underlying trends that will truly shape the future of our metro areas.

The ability to attract skilled workers is a key factor, if not the key factor, in the growth of cities and metro regions. Cities themselves are understandably keen to tout when their populations are growing, but just tracking overall population can mask the underlying trends that will truly shape the future of our metro areas.
A few weeks ago, I looked at the different places both recent immigrants and US-born Americans are moving since the recession began. But, as I noted then, even these big-picture figures tell us little about the educational levels and skills of the people that are moving and staying. Writing in The Atlantic several years ago, I pointed out that the “means migration”—the movement of highly educated and highly skilled people—is a key factor that shapes which cities will thrive and which will struggle.
Join 500,000+ readers who start their day with Quartz.
By subscribing, you agree to our Terms of Service and Privacy Policy.
What the United States has been seeing is, so to speak, a big talent sort. There have been very different patterns of migration by education and skill, with the highly educated and highly skilled going some places and the less educated and less skilled going to others.
With the help of my Martin Prosperity Institute (MPI) research team, I’ve dug into the numbers on the net migration of Americans by education level, a set of data that tells us about where people of different skill levels have been moving and staying. Karen King, a demographer, broke down American Community Survey data, tracking “net domestic migration” from 2011 to 2012 for several key educational categories: adults that did not complete high school; those with a high school degree or equivalency; those with some college or an associate’s degree; adults who hold a bachelor’s degree; and those with a professional or graduate degree. These data show only one year, rather than longer-term trends, but they effectively track the current net flow of people—that is, the ability of metros to both attract and retain American workers. (Keep in mind that net domestic migration tells only part of the story of population change, as the influx of immigrants and natural growth through births and deaths also affect overall numbers.)
The interactive map, which MPI’S Zara Matheson made with support from ESRI, lets you click through and explore migration by educational attainment for each metro. The size and color of the overall bubbles shows the magnitude of net domestic migration, and the breakdown by education level is available when you click.
The chart below breaks out the net migration patterns by education levels in the 20 largest US metros.
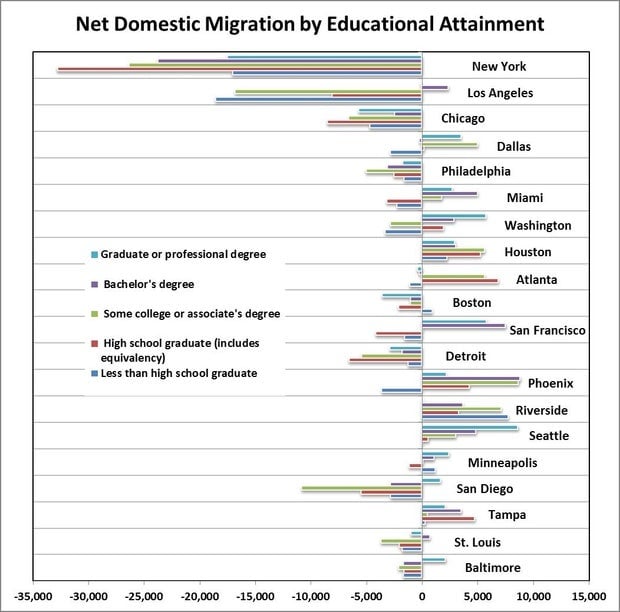
The chart shows the very different patterns of migration occurring across America’s metros. Keep in mind that many of the country’s biggest metros are still gaining overall population, as immigrants continue to flow into places like New York and Los Angeles. But these places are seeing a net loss of Americans of all education levels.
The metros that are attracting educated workers include knowledge and tech hubs like San Francisco, Austin, Seattle, and Denver, and also Sunbelt metros like Phoenix, Charlotte, and Miami.
When we look at just those with professional and graduate degrees, the pattern comes into sharper focus. There have been significant net inflows of educated workers to the true meccas of knowledge work: Seattle, San Francisco, D.C., Denver, San Jose, Austin, and Portland, as well as the banking hub of Charlotte.
These metros, particularly ones with higher costs of living, have been able to attract and retain skilled workers, even while the less-skilled have departed. San Francisco, Los Angeles, Washington, DC, and Miami all saw their ranks of educated residents grow and less educated residents shrink. Lower-paid workers are being priced out, and the jobs that can attract new residents are reserved for the most educated. Boston is one of the few places attracting and retaining more unskilled workers than skilled ones, a perhaps unexpected trend, given its reputation as a center of education and knowledge work.
The pattern for the less educated looks substantially different. The top ten metros that saw the largest net gains among those with just a high school degree were all in the Sunbelt, including Atlanta, Houston, Phoenix, Las Vegas, and Florida’s Fort Myers, Tampa, and Sarasota. And when we consider those without a high school degree or equivalent, the places with the largest net gains were mainly Sunbelt tourist destinations with thriving service economies like Fort Myers and Daytona Beach, Florida, and Lake Havasu City, Arizona.
The chart below provides a summary of the five metros that saw the largest net growth in population by level of education.

To better understand which factors are associated with the migrations of highly versus less educated people, my MPI colleague Charlotta Mellander ran a correlation analysis on several key demographic characteristics. She excluded the greater New York metro from her analysis because its unique migration pattern is an extreme outlier. Here are some of the most interesting findings:
In contrast, our analysis finds that the places where the number of workers without a high school degree is growing are at the opposite end of the economic spectrum: smaller places with lower wages, less robust economies, fewer cultural amenities, less high tech industry, and less tolerance. The net migration of those without a high school degree is negatively correlated to population size (-0.24), economic output per capita (-0.22), high tech concentration (-0.24), artists and cultural creatives (-0.32) and tolerance toward gays and lesbians (-0.12). And we find no correlation between the net migration of the less educated and climate, measured as mean January temperature.
This analysis points to an ongoing and very real sorting process. Overall, larger and more vibrant metros with strong knowledge economies, abundant artistic and cultural amenities, and open-minded attitudes are the ones that are attracting and retaining the most college graduates. On the flip side, these metros are losing less-educated residents who are increasingly unable to make ends meet. They are instead moving to smaller, less affluent, lower-cost places. In fact, we found no statistical association whatsoever between the movement of college grads and the net movement of those who did not finish high school. These very different migration patterns reinforce the ongoing economic and social bifurcation of the United States.