This article is part of an ongoing BULLETIN series exploring GE’s innovation, technology, and manufacturing initiatives in India.
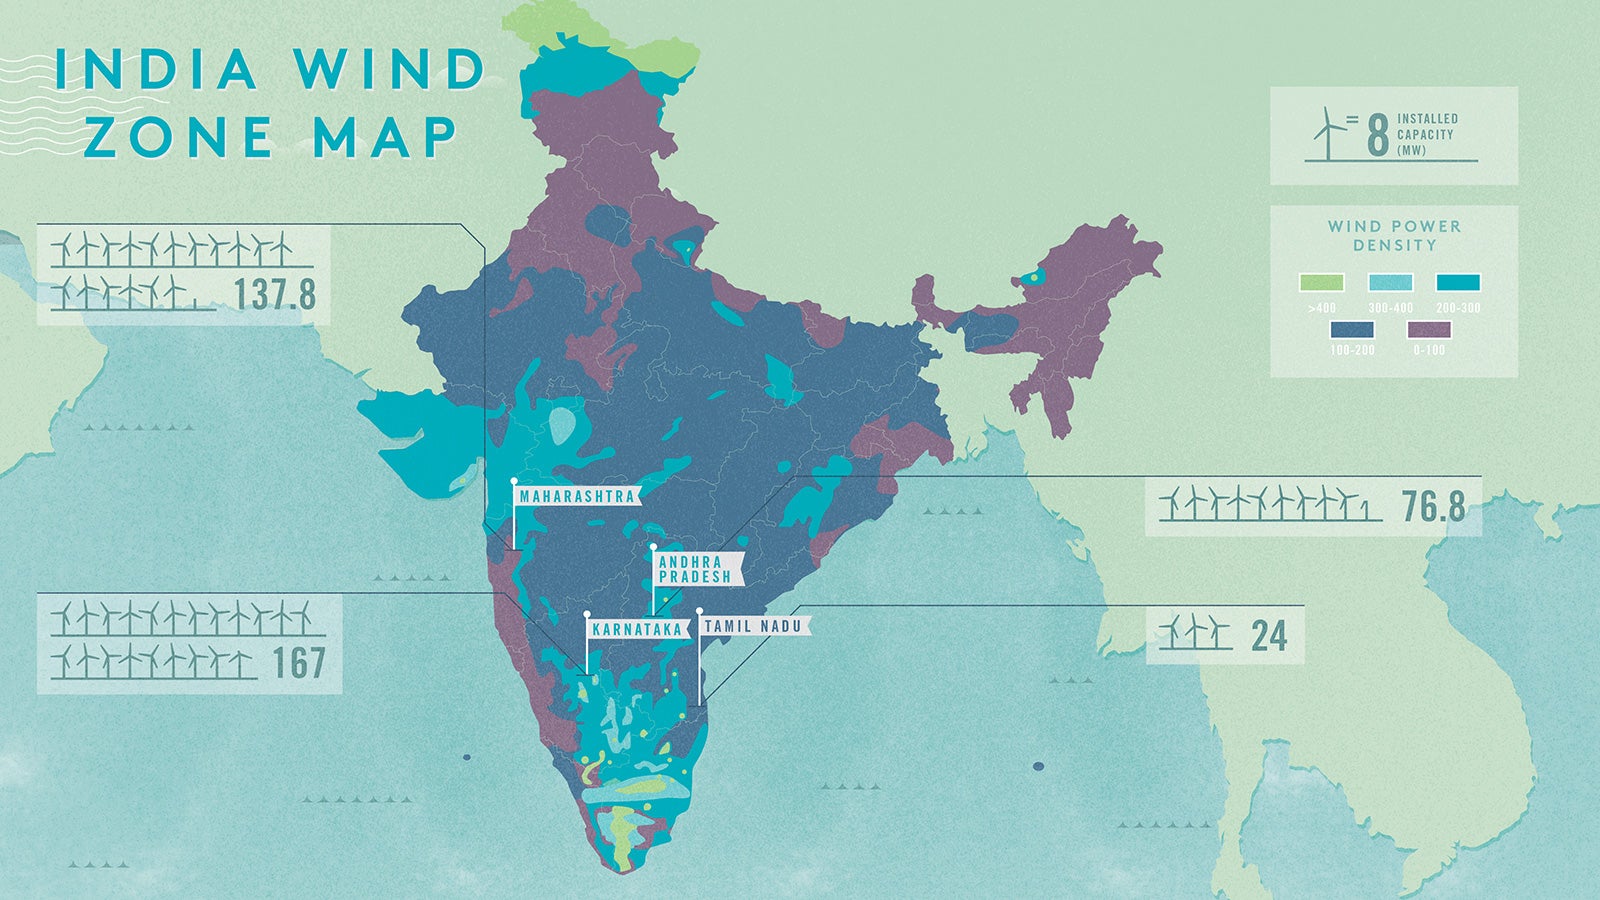
(See the infographic enlarged.)
A continued dependence on dwindling gas production and increasingly expensive imported coal leaves India’s power sector at a crossroads. President Mukherjee has declared that all households in the country will have 24-7 electricity by 2022, voicing the challenging but ambitious vision pursued by Prime Minister Narendra Modi’s government.
To meet India’s growing electricity demands, renewable energy—especially wind energy—is likely to play an important role.
Wind energy is the most popular renewable energy technology in India, accounting for about 67% of the total installed renewable energy capacity. This market share was driven by the country’s enormous wind energy potential, the rapid evolution of wind energy technology, and government-backed investment incentives.
An estimated 103 gigawatts (GW) of wind energy potential exits in India, according to the Chennai-based Centre for Wind Energy Technology. As of this March, 82 GW of that capacity remain untapped, and the vast majority of it is concentrated in eight states located in the north-west, west, and coastal regions of the country.
States like Tamil Nadu, Karnataka, Andhra Pradesh, and Gujarat have the highest wind power potential. While most of the highest wind density sites in these states have already been exhausted, low to medium wind density sites can still be tapped using the latest wind turbine technology.
India’s potential wind project sites are classified into zones, grouped by available wind density. The lower the wind density the higher the preferential tariff project developers would receive for electricity generated. With the availability of high efficiency wind turbines capable of operating in relatively low wind density sites, a sound business case is formed for prospective project developers. The states that have been classified with the highest wind energy potential have sites with wind density ranging between 100 W/m2 and 350 W/m2, which require state-of-the-art wind turbine technology and project designing tools. This is where the expertise of a global innovation leader like GE comes in.
GE recently released its 1.7-103 wind turbine, an advanced technology turbine specifically developed for low wind speed conditions in India. The 1.7-103 wind turbines offer up to a 47 percent increase in swept area (compared to the GE 1.6-82.5 turbine), which can result in a 24 percent increase in annual energy production. Additionally, GE has introduced a new service, WindLAYOUT, which scouts locations for optimal wind power plant sites, has also been introduced by GE.
In order to promote grid discipline, Indian regulators recently implemented the Renewable Regulatory Fund mechanism, which requires wind energy project developers to forecast the expected electricity generation with a considerably high degree of certainty. Real-time data gathering and visualization solutions such as WindSCADA can help the project developers monitor their machines and make short-term forecasts of the expected electricity generation based on analysis of historical data.
However, technological capacity—while crucial—is just a long first stride in moving steadily to wind energy. To continue to attract investment, the policy environment will need to be conducive for land acquisition. As the government begins implementation of the National Wind Energy Mission, the technology is in place for wind energy to grow into the resource that can help the country realize Mukherjee’s vision of 24-7 electricity for everyone. With the help of Mother Nature, of course.
This article was produced on behalf of GE by the Quartz Marketing team and not by the Quartz editorial staff.
INFOGRAPHIC NOTE: Installed capacity shown represents GE wind turbine projects only.