Data visualizers could learn a thing or two from this 1898 urban population chart
If reading up on 19th century US city population rankings sounds like a fun way to spend an afternoon, have we found the charts for you.

If reading up on 19th century US city population rankings sounds like a fun way to spend an afternoon, have we found the charts for you.
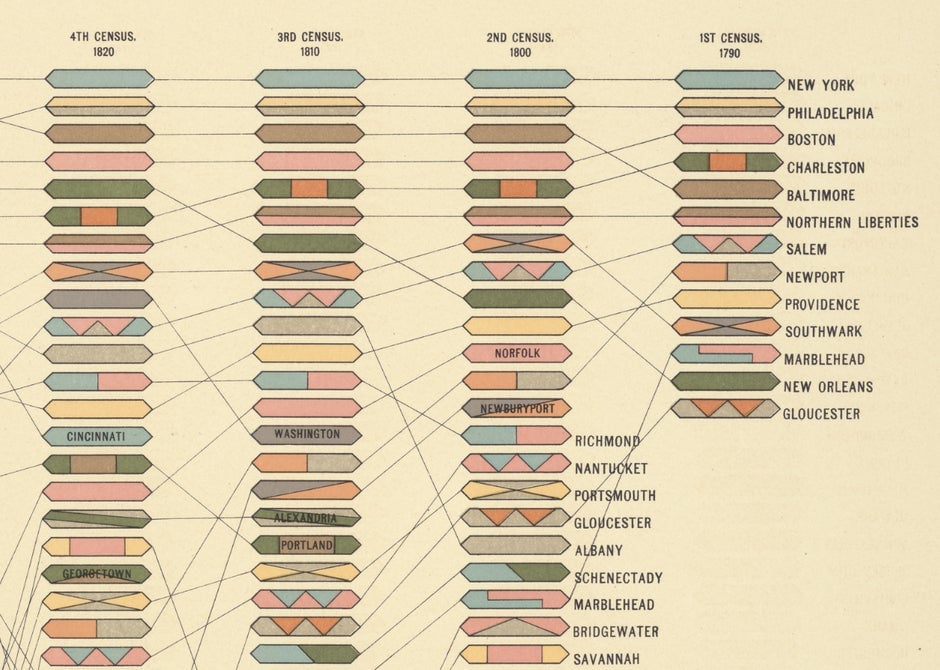
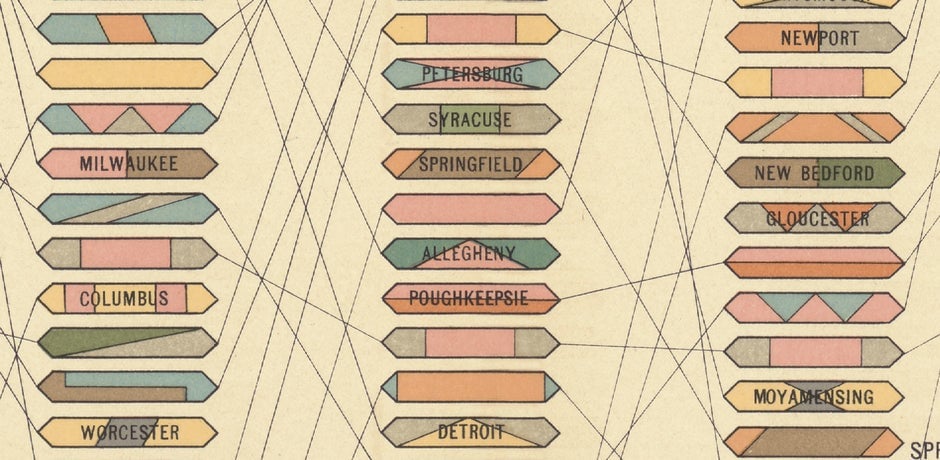
Originally published in the Statistical Atlas of the United States in 1898, Larry Gormley of HistoryShots (a company that designs and restores data visualizations) first came across this old census visualization over at David Rumsey’s online map database. Compelled by its restrained use of shapes, colors, and lines, Gormley, who scours map and book fairs in his native New England, eventually tracked down a printed copy to restore.

Originating from a 30 by 20-inch, nearly 120 year-old atlas, the two-page spread was restored by Gormley over the course of a month using Photoshop, removing any trace of blemishes and most notably, the original page fold.
Its design manages to neatly display over 450 data points using only 10 colors to differentiate dozens of cities. Once the viewer adjusts their eyes to the right-to-left timeline, one can see just how much the US had grown in its first full century.

Just after the Revolutionary War, New England towns like Gloucester, Marblehead, and Salem were some of the biggest in the newly formed country. Southwark and Northern Liberties, Pennsylvania, big towns on their own, were eventually incorporated by even bigger Philadelphia in the 1850s.
As you move your eyes left, you see the country expand in all directions as colonial-era towns crawl down the population rankings in favor of newer cities in the Northeast and Midwest.

The chart also shows the emergence of frontier towns and West Coast cities. Although Los Angeles had not yet cracked the top 50, San Francisco had become the country’s eighth-biggest city (just under 300,000 people) by 1890. Denver, number 50 in 1880, jumped up 24 places by the following decade.
Of course, at the top the whole time, and to this day, is relentlessly big New York City. In 1790 it had 33,000 residents. By 1890, two years after Manhattan annexed its neighboring boroughs, its population had reached 2.5 million; about six million less people than today.
This post originally appeared at CityLab. More from our sister site:
Russians will vote by app on the fate of a modernist Moscow landmark