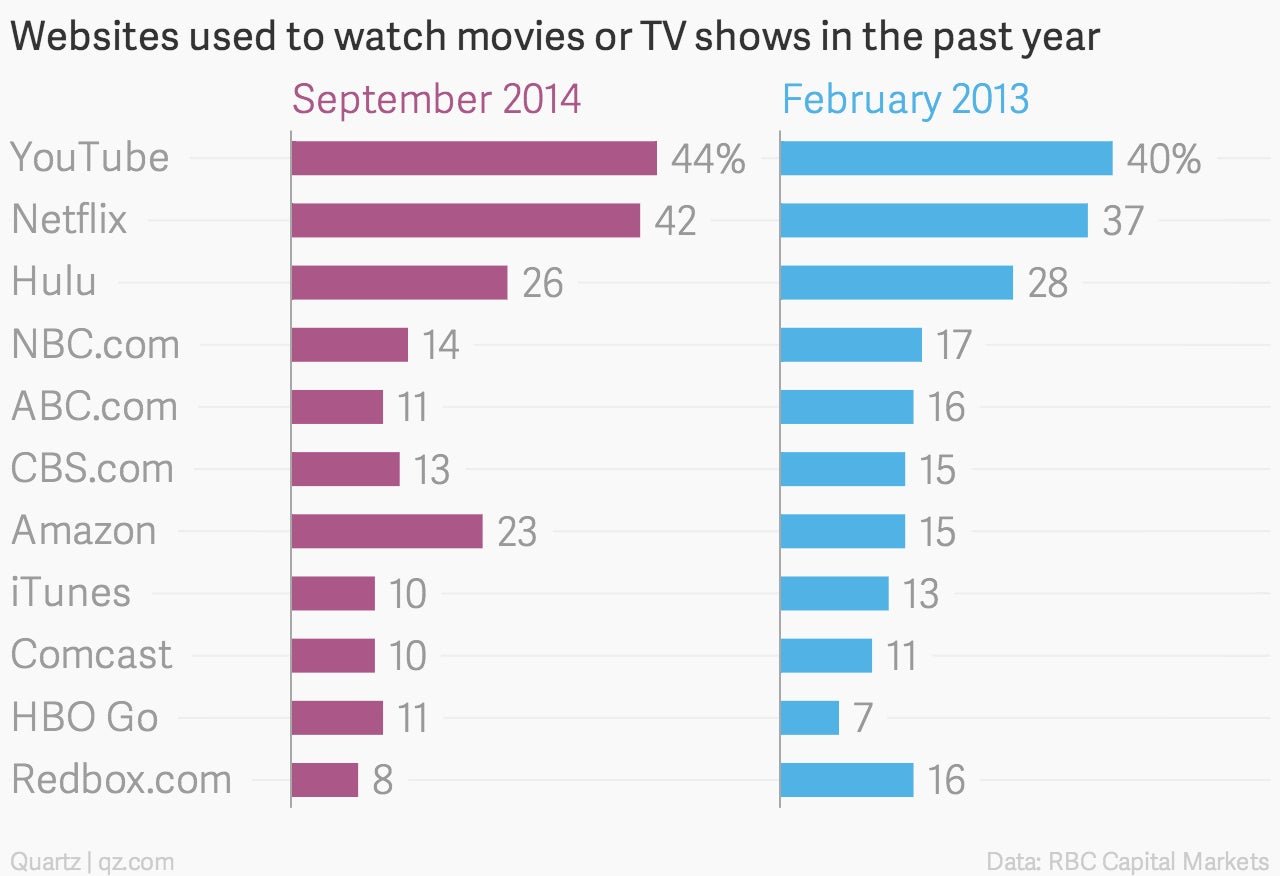
The above chart, which comes from a survey of 1,007 Americans conducted by RBC Capital Markets and was published in a note this morning—I tweeted out RBC’s more detailed but harder to read chart earlier today—gives a nice illustration of what’s happened in US online television over the past 18 months.
YouTube, Netflix $NFLX, and, in particular, Amazon $AMZN continue to capture eyeballs. The commercial TV networks continue to lose them—in this case not for their linear broadcasts, although that is happening too, but for their online properties. (To be fair, the networks’ content still is being consumed online, just not necessarily through their websites).
Another thing that stands out: HBO Go really is a niche service, at least according to this survey. Another way to look at it, though, is that there is plenty of room for it to grow.