
America’s economic and social fabric has been remade over time through a series of great migrations: settlers heading west; farmers and new immigrants to great industrial centers; blacks from the rural South to the urban North; the middle class from the urban centers to the suburbs; and more recently, from an ongoing dual migration of the skilled and less skilled I dubbed “the means migration.”
But which metros have proven best at attracting the creative class, the roughly 40 million workers (a third of the US workforce) whose occupations span science and technology; arts, design, media and entertainment; and the knowledge-based professions, like medicine and law?
A recent study [document download] from Charlynn Burd, a geographer at the Census Bureau’s Journey to Work and Migration Statistics Branch, provides important new detail on where the creative class moves. Her study uses detailed data from the Census Bureau’s American Community Survey to trace the migration of the creative class from for various time periods between 1995 and 2011.
She traces these moves by age, by race, and by three major types of creative class workers: workers who draw on “synthetic knowledge,” like scientists, software and computer workers and mathematicians; those who draw on “analytical knowledge,” mainly engineers and architects; and those who draw on “symbolic knowledge” and work in arts, music, film, design, entertainment and media.
***
Let’s start with age. Many confuse the creative class with young workers. The reality is that the creative class spans all age groups. Younger members of the creative class are far more likely to move than older ones, which is in line with broader trends. Just slightly fewer than half of creative-class workers moved between 1995 and 2000.
The graph below, from Burd’s study, illustrates how moves decline as members of the creative class grow older. As the chart shows, the age-related decline in creative-class moves is far less pronounced than that of other types of workers.
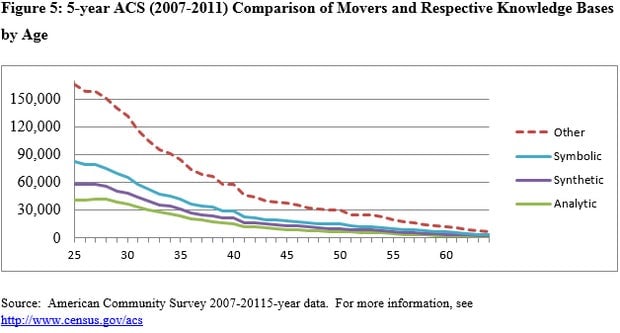
The pattern is similar for all three types of creative-class workers. The analytic creative class had the largest total number of movers (613,251 in total), while the synthetic creative class was the least mobile (with only 12.4% having moved during the study period).
The US has long been a magnet for the world’s creative-class workers. Burd’s study shows that the US attracted 38,035 creatives from Asia and another 14,313 from Europe between 2007 and 2011.
***
But where are the members of the creative class going?
To get at this, Burd charted migration of the creative class overall and its three main types of workers across US metros, comparing the period 2006-2008 to that of 2009-2011. The table below shows the key trends.
(Source: American Community Survey 2006-2008 and 2009-2011 year data. Note: an asterisk (*) reflects a statistically significant difference between the two periods.)
Washington, DC, was the big winner, attracting significant numbers of creative class workers in both periods and leading the nation in the later 2009-2011 period. Other metros that attracted considerable numbers of the creative class include Houston, Boston, San Jose, Los Angeles, Dallas, San Francisco, Seattle, and New York.
The second chart below shows the pattern for the three major types of creative class workers: analytic, synthetic, and symbolic.
(Source: American Community Survey 2006-2008 and 2009-2011 year data. Note: an asterisk (*) reflects a statistically significant difference between the two periods.)
Washington, DC, led in attracting analytic creative-class workers, those in science, computing, software, and mathematics fields. San Francisco, Seattle, New York, Atlanta, San Jose, and Houston also attracted a considerable number of the analytic creative class.
Houston led in attracting synthetic creative-class workers, mainly engineers and architects. (Houston is a major center for engineering and has seen a construction boom as well). Seattle, Dallas, San Jose, San Diego, DC, and Boston were other leading destinations for the synthetic creative class.
Austin led in attracting the symbolic creative class of artists—designers, media, and entertainment workers. Las Vegas, with its large entertainment complex, also did well, as did Portland, Dallas, New York, and LA.
Washington, DC, was the overall leading city, scoring highly across all three types of creative-class workers. Seattle, New York, San Jose, Houston, and Dallas each did well in two types.
***
The third chart below traces the movement of the creative class between metros.
(Source: American Community Survey 2006-2008 and 2009-2011 year data. Note: Excludes movers from abroad and intra-metropolitan moves.)
The biggest flows were mainly between adjacent metros like San Jose and San Francisco; DC and Baltimore; and New York and Philadelphia. But the pattern for the symbolic creative class was different than for the others. There was a considerable flow of artists, designers, media, and entertainment workers away from New York to LA and from Miami to New York.
The fourth chart traces creative class moves within metros, which comprise the largest number of total moves. Burd traced creative class moves within metros, including moves within larger consolidated metropolitan areas, which include two core cities, like Washington-Baltimore or San Francisco-San Jose.
(Source: American Community Survey 2006-2008 and 2009-2011 year data. Note: an asterisk (*) reflects a statistically significant difference between the two periods.)
Large metros tend to have more moves simply because they have more people. So it is not surprising that New York and LA have large numbers of creative-class moves across all three types of workers. But Chicago, the nation’s third-largest metro, fails to make the top five for the synthetic creative class. Dallas, the fourth largest, does not make the top five for the analytic creative class. And Houston, the fifth largest, does well on the synthetic creative class but does not place on the other two. Smaller metros like DC (seventh largest), Boston (10th largest), San Francisco (11th), and Seattle also rank among the top five in various categories; and Miami (8th largest) registered big gains in the symbolic creative class.
Four metros—DC, Los Angeles, San Francisco, and Seattle—had statistically significant increases in the analytical creative class between the two time frames, while two—LA and Houston—had statistically significant increases in the synthetic creative class. Three—LA, San Francisco, and Miami—had statistically significant increases for the symbolic category. LA was the only metro to register statistically significant gains in all three creative groups.
***
Generally speaking, creative-class workers are much more likely to move within metros or to adjacent metros, say between Baltimore and DC or between San Jose and San Francisco, than they are to make long-distance moves.
But Burd’s work does point to one exception: the symbolic, or more artistic, creative class, for whom longer-distance moves, say from New York to LA, are more frequent. Maybe Moby and David Byrne were right—maybe higher housing prices are pushing artists and musical creatives away from New York.