Quartz
Subscribe
Quartz
Subscribe
Edition
Business News
A.I.
Technology
Money & Markets
Leadership
Lifestyle
Latest

Get Quartz in your inbox

Free daily briefing on global business news.

Business News
AirlinesAutomobilesFoodPharmaceuticalsPolitics & GovernmentRetail & EcommerceSpace & AerospaceEarnings
Technology
A.I.ComputingConsumer TechSpace & AerospaceEarnings
Money & Markets
Economic IndicatorsMarketsPersonal FinanceEarnings
Lifestyle
Cars & BikesCollectingEntertainmentFood & Fine DiningHealth and FitnessReal EstateTravel
Quartz

Global business news for a smarter world

Topics

  • Business News
  • Money & Markets
  • Tech & Innovation
  • Generation A.I.
  • Lifestyle
  • Leadership

Products

  • Daily Brief
  • Weekly Digest
  • Member Benefits
  • Quartz Pro

Legal

  • Sitemap
  • About
  • Accessibility
  • Privacy
  • Terms of Service
  • Advertising

© 2026 Quartz Media, Inc. All rights reserved.

Business News

These are the US’s worst cities for commuters

Americans agree: We hate commuting more than just about anything. Of course, most of us do it anyway: on average, about 25 minutes each way.

By Zach Wener-Fligner·1 min read·Updated July 21, 2022
Add QZ to Google

Americans agree: We hate commuting more than just about anything. Of course, most of us do it anyway: on average, about 25 minutes each way.

But commuting is a lot worse in some places than in others. Yesterday, I mapped the severity of commutes US counties. (The suburbs of New York and Washington, DC, were the worst offenders.)

Daily Brief

The essential business news, delivered fresh every morning.

Join 500,000+ readers who start their day with Quartz.

By subscribing, you agree to our Terms of Service and Privacy Policy.

The length of the weekday slog also varies a fair amount by city. The chart below shows how commutes stack up in the 25 largest US metro areas.

Once again, New York and DC top the list. Tough break.
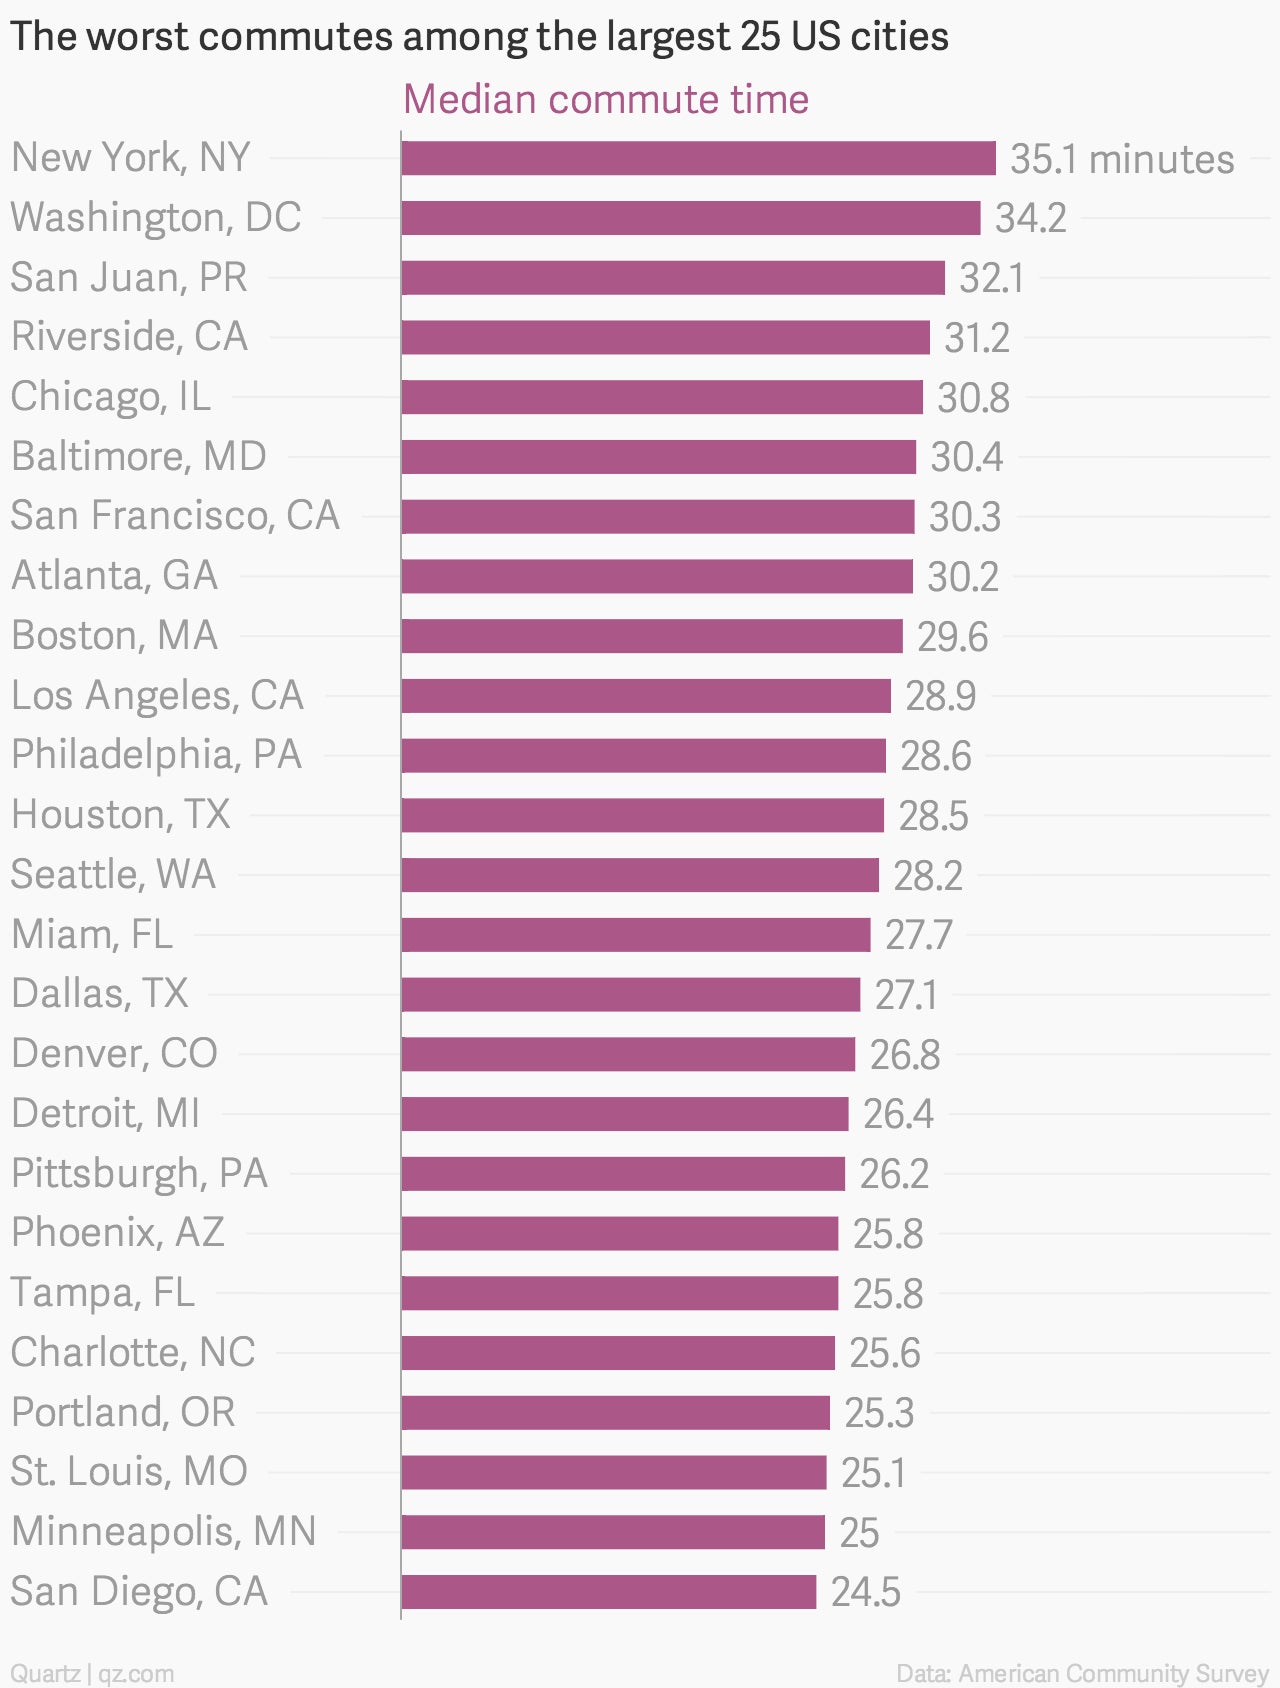
This data comes from the 2013 three-year American Community Survey taken by the US Census Bureau. Measurements are taken for areas with a population of over 20,000, and they represent average values for 2011 to 2013.
