China’s buy-out of corporate Europe, in maps and charts
From Hutchison Whampoa’s $15.3 billion deal for O2, the UK mobile network owned by Telefonica, to Pirelli’s acquisition by a Chinese state-run chemical company, deal-making between Chinese and Hong Kong buyers and European sellers has been fast and furious in recent weeks.

From Hutchison Whampoa’s $15.3 billion deal for O2, the UK mobile network owned by Telefonica, to Pirelli’s acquisition by a Chinese state-run chemical company, deal-making between Chinese and Hong Kong buyers and European sellers has been fast and furious in recent weeks.
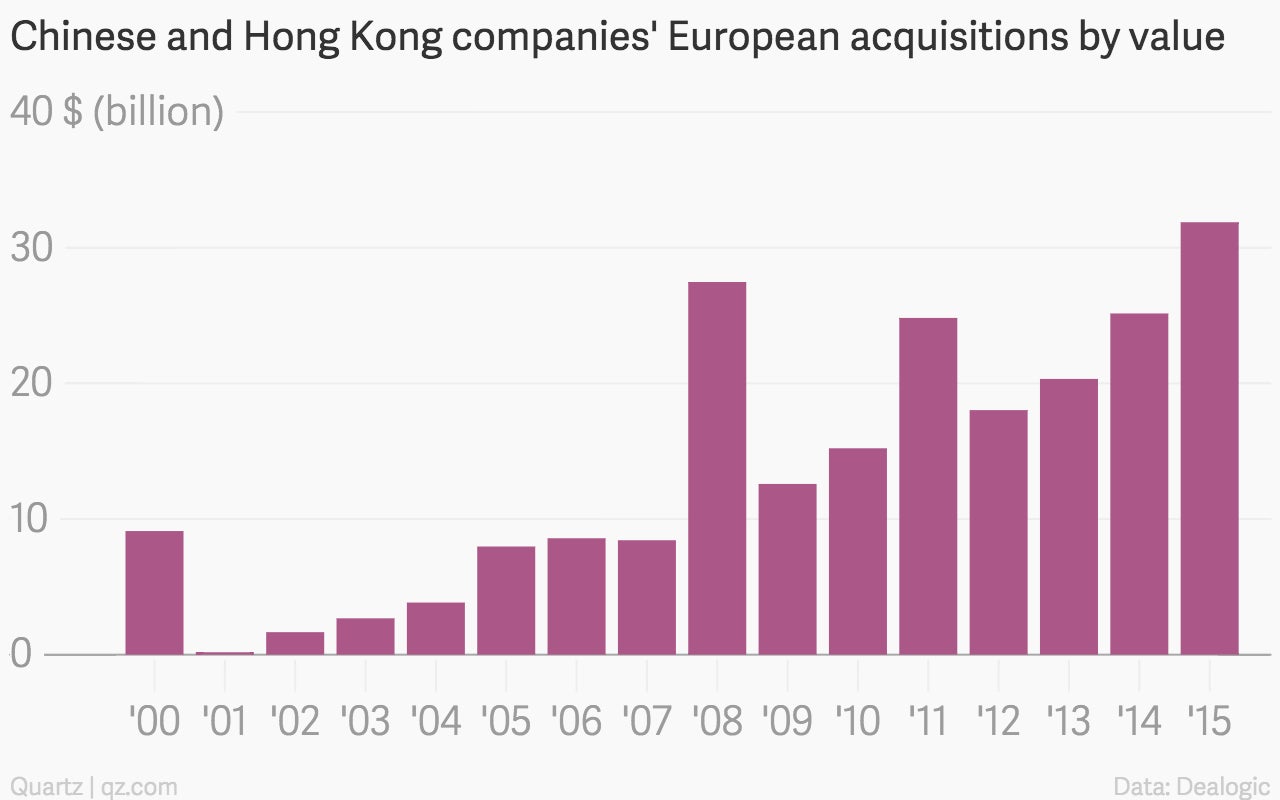
The Chinese government has encouraged state-owned enterprises to buy international companies for years, to acquire technological know-how and grow as the domestic economy cools, and Europe’s moribund economy has created a fertile shopping ground. The euro’s recent drop means prices are even more attractive—in just the first three months of 2015, Chinese and Hong Kong companies spent more doing European deals than in any of the past 15 years.
Weaknesses in the European economy historically correlate to a rise in the value of takeovers by Chinese and Hong Kong companies, but even in the in-between years deal-making is getting stronger:
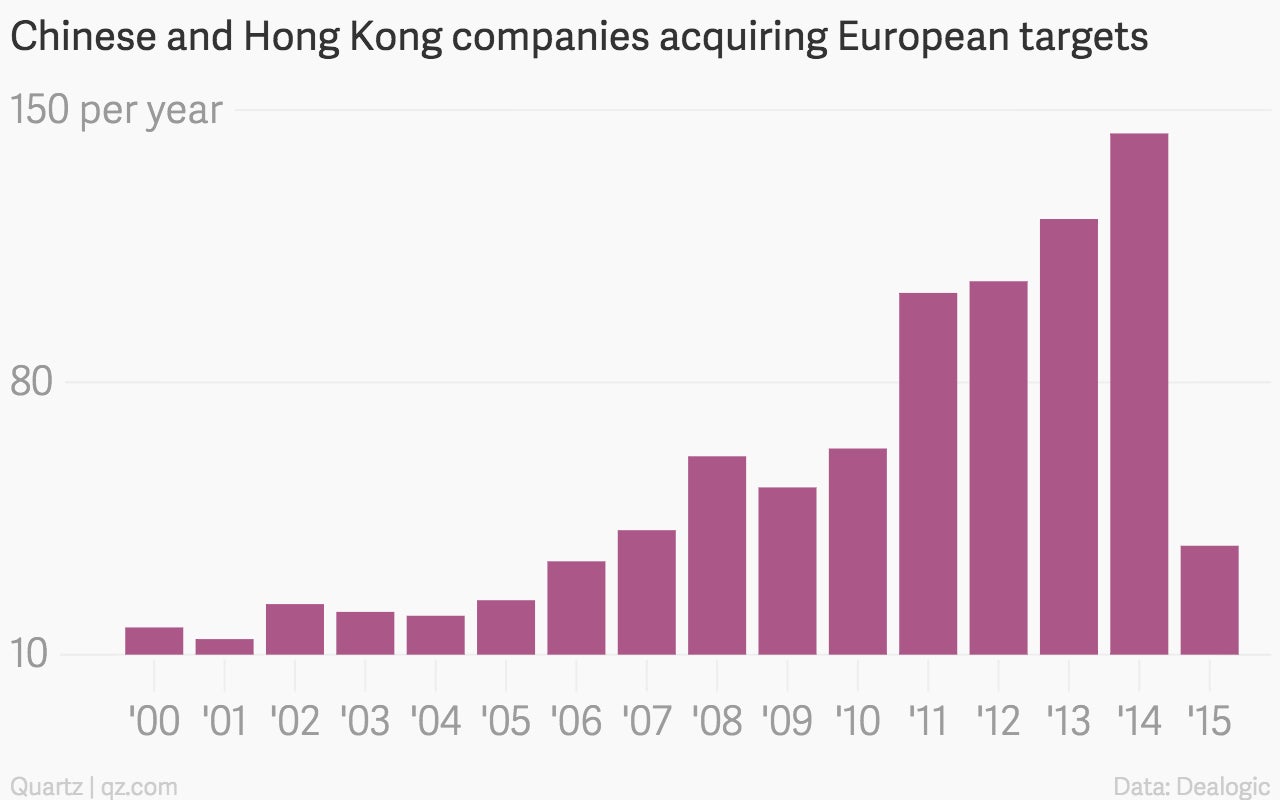
This year’s new record high is skewed by Hutchison’s recent deal for O2. But if you look just at the number of acquisitions, not their value, 2015 still looks like it may be a strong year for European takeovers by Chinese and Hong Kong buyers:
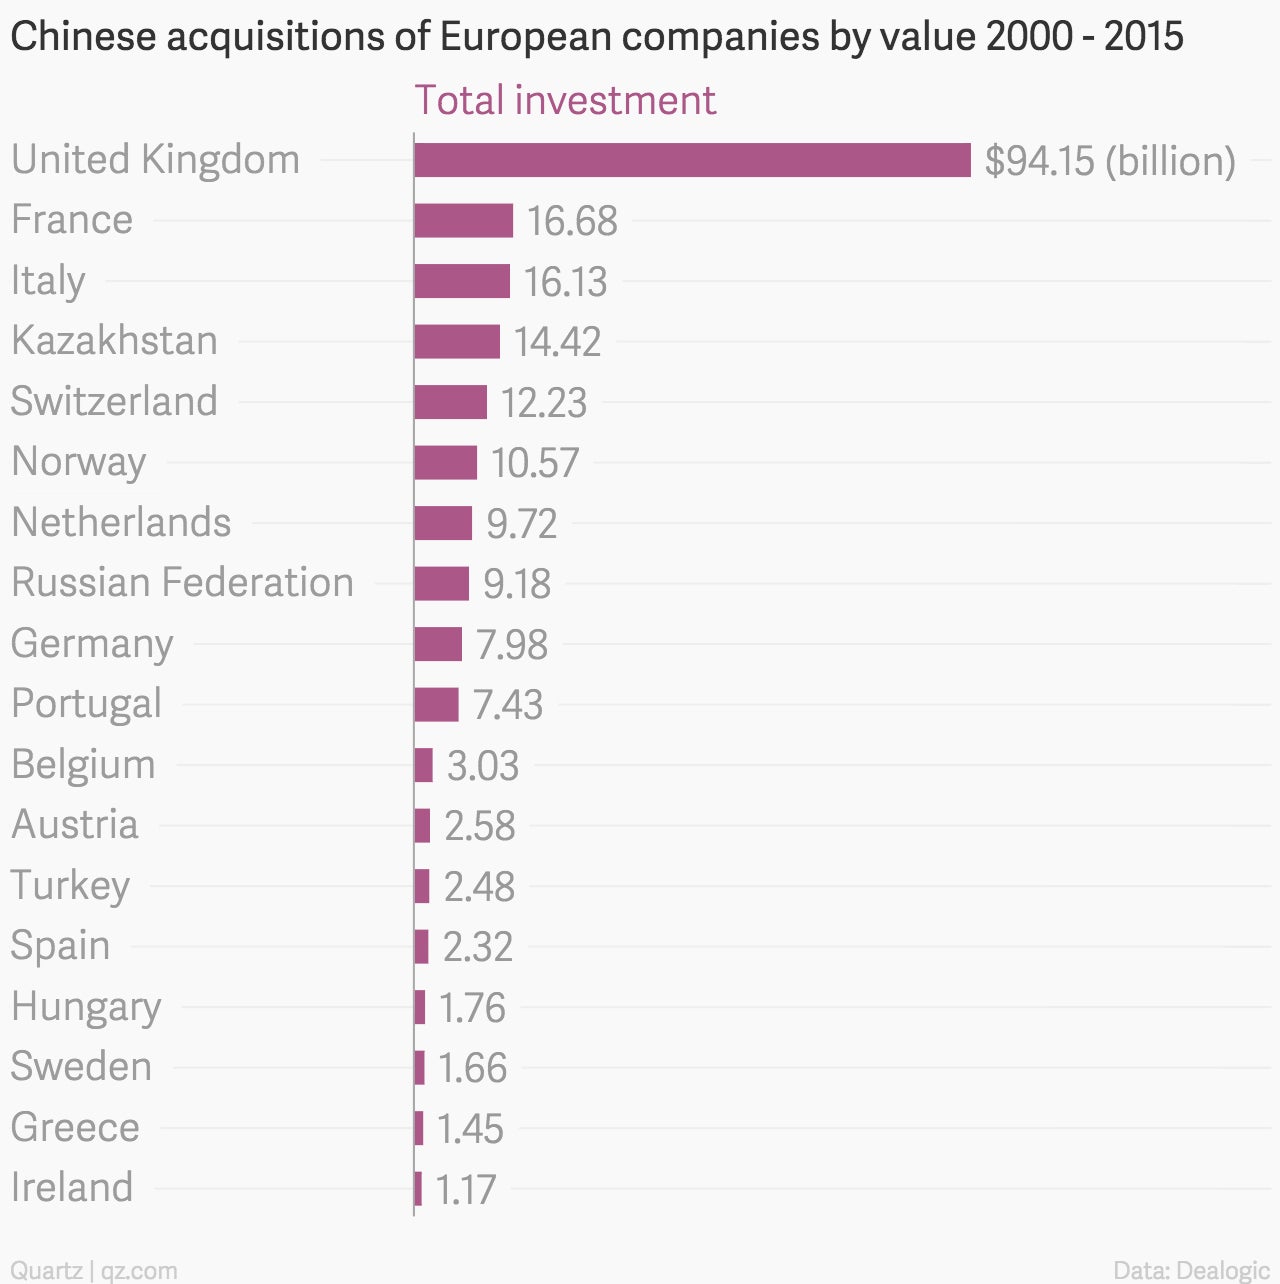
And one country stands out as the in terms of both the sheer number of takeovers and the total value: Britain.
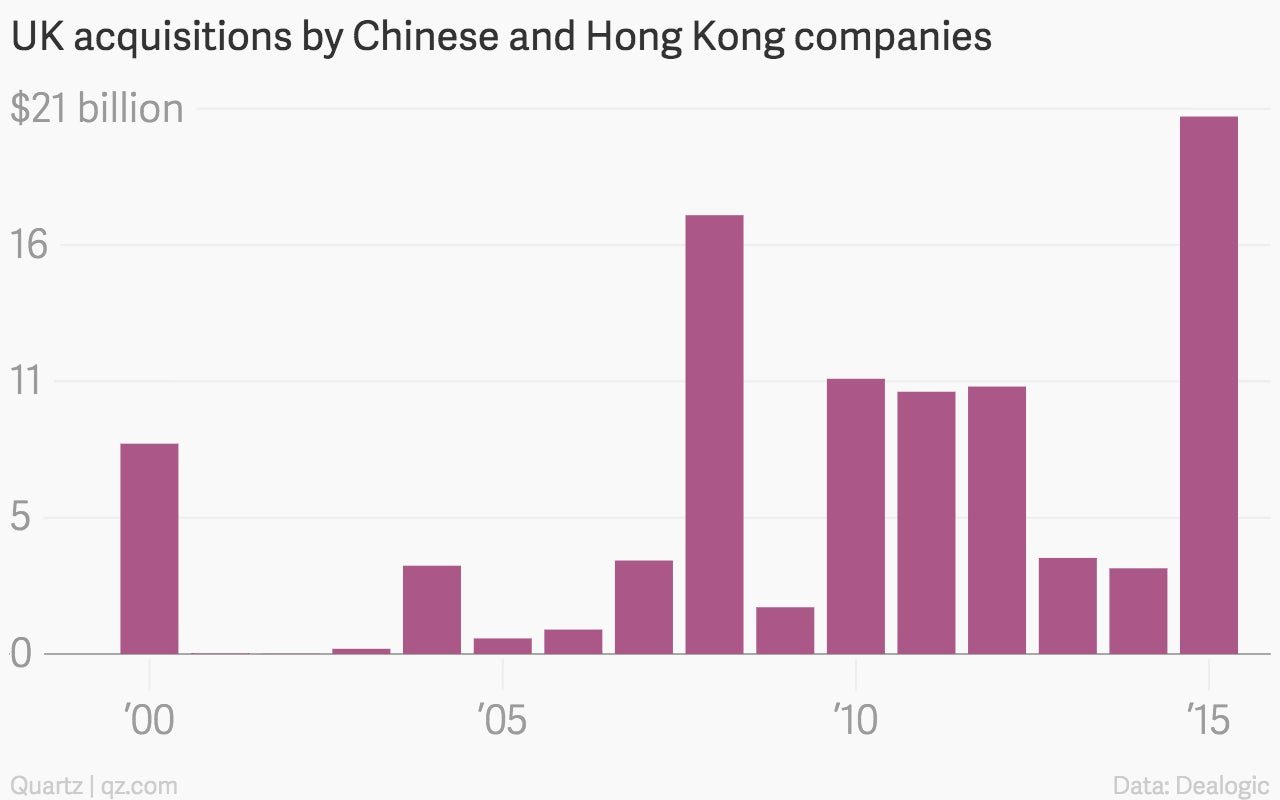
Of the total European acquisitions between 2000 and today, British companies accounted for almost half, or $94 billion. The amount Chinese and Hong Kong companies spent buying UK businesses in the past 15 years was almost six times the amount they spent in the next-highest target country, France.
Chinese takeovers in the UK have pretty much followed the pattern of deal-making across Europe—buying heats up when the economy suffers. Deal targets have varied from cereal maker Weetabix to London’s business development Chiswick Park.
The amount of UK takeovers has been so outsized, compared to the rest of Europe, that a “heat map” of Chinese and Hong Kong takeovers in Europe is completely skewed when Britain is included—all other countries would simply fade to light pink. This map below shows deals, by value, for the past 15 years, with Britain excluded:
