Finally, some good news in a depressing US income inequality chart
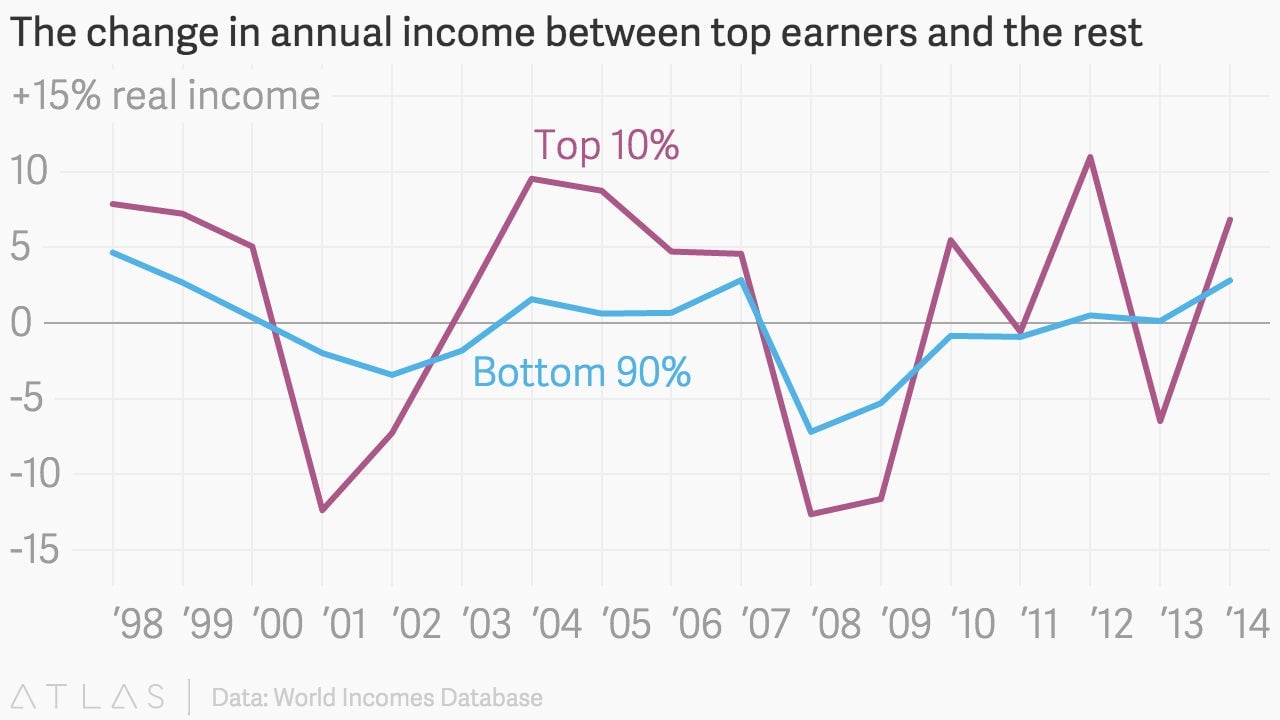
The latest estimates are in, and yes, the rich are getting richer. But wait—it turns out 2014 is the first year since 2007 when the change in real income for most American families rose by something more than a fraction of a percentage point:

The latest estimates are in, and yes, the rich are getting richer. But wait—it turns out 2014 is the first year since 2007 when the change in real income for most American families rose by something more than a fraction of a percentage point:

USA! USA! That’s right, 2.8% average income growth for the bottom 90% of Americans, a bit of real zip in their wallets for the first time in eight years. With the recession in the rearview mirror and unemployment nearly at normal levels, wages—which edged up 0.5% in 2012 and 0.13% in 2013 after several years of declines—are really on the rise now.
But the increase was nothing compared to that of the top 10% earners, who saw their real income income rise 10.8%—part of a decades-long pattern of outsized gains accruing at the top.
And that’s the focus of the economists at the World Top Incomes Database, who released these numbers last week after compiling them from IRS tax data. UC Berkeley economist Emmanuel Saez writes that even though tax increases in the US reduced top incomes in 2013, they haven’t dampened the trend. Indeed, “the top 1 percent of families captured 58 percent of total real income growth per family from 2009 to 2014.”
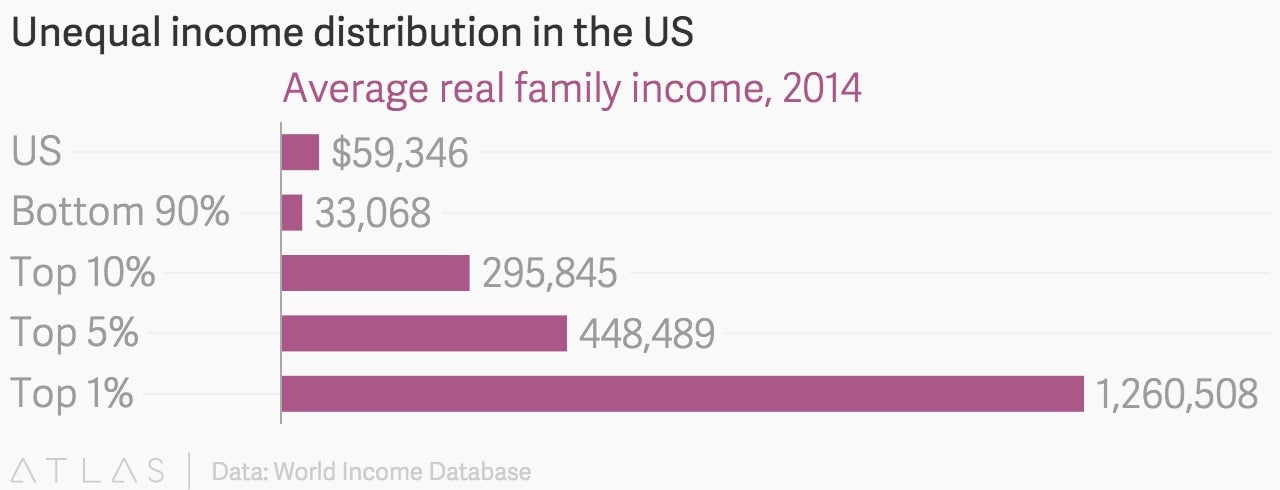
And what does that result in, on average? Something like this:
