Can you guess the banks behind these brutal earnings charts?
It’s hard out there for European banks. In their home markets, economic growth is weak, unemployment is high, and interest rates are low (or even negative). On top of that, global markets are volatile, plunging energy prices are hurting big borrowers, and a slowing Chinese economy is putting a damper on just about everything.

It’s hard out there for European banks. In their home markets, economic growth is weak, unemployment is high, and interest rates are low (or even negative). On top of that, global markets are volatile, plunging energy prices are hurting big borrowers, and a slowing Chinese economy is putting a damper on just about everything.
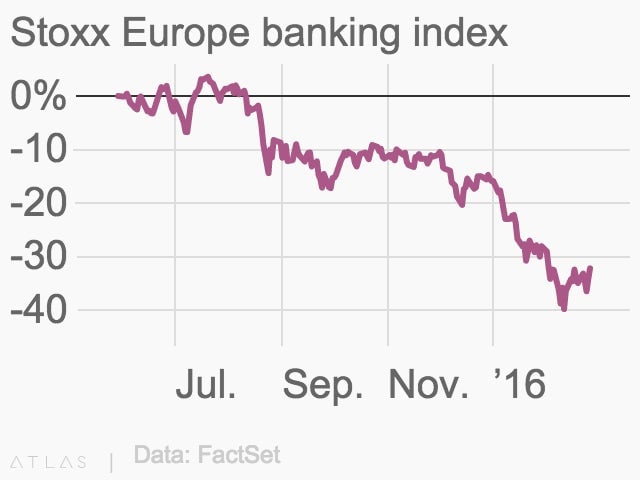
This all adds up to subdued activity and sour loans, which has been reflected in some truly awful earnings reports. Indeed, shareholders have been horrified by some of the annual results released in recent weeks, dumping bank stocks in droves.
Quartz makes a lot of charts, and even we were taken aback by some of the truly gruesome graphs we’ve seen come across from banks of late. Below are three of the most horrific profit charts from the current earnings season. See if you can guess which basket case of a bank is behind each one. (Scroll to the bottom for answers.)
Bank 1: A lack of vision
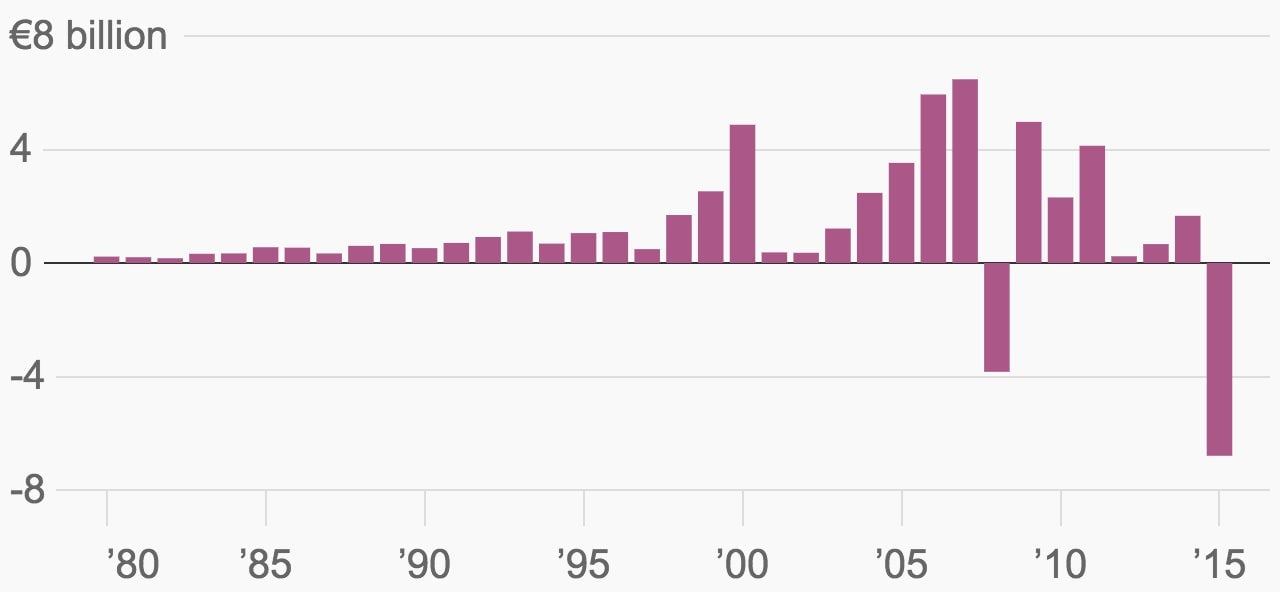
What happened? This bank posted a record loss in 2015 because of a jump in restructuring charges and more than doubling of litigation costs. The bank’s shares have lost a third of their value so far this year, and at one point the markets forecast a one-in-four chance that it would default on its junior debt. Its current market value is only about a third of the book value of its assets, meaning that shareholders think more pain is in store.
What did the boss say? ”It’s hard to stand up and smile a lot and give much of a vision for a bank.”
What did the analysts say? ”Has the place been swept clean or is there still more to come? We need clarity on where earnings will come from.”
Bank 2: Soul searching
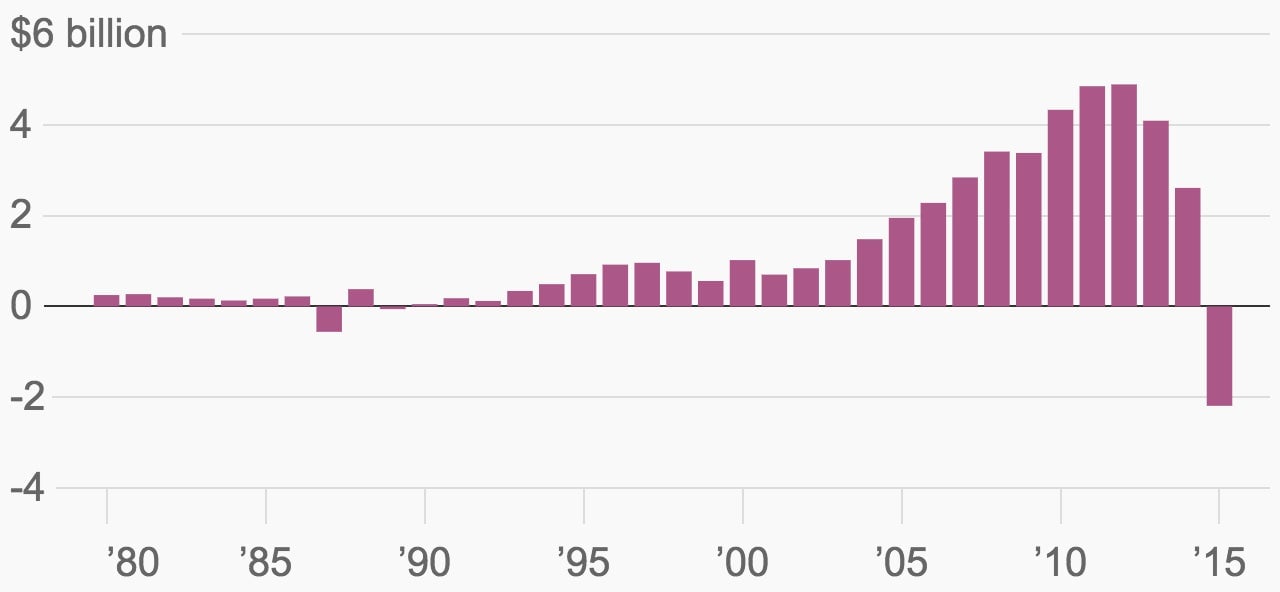
What happened? The bank’s first annual loss since 1989 was thanks to worse-than-expected restructuring costs and loan impairments stemming from bad loans to energy companies and the reversal of an aggressive global expansion under previous management. In response to all the red ink, the bank’s current CEO is considering clawing back bonuses previously awarded to 150 senior managers. The bank’s shares have lost more than half their value over the past year.
What did the boss say? ”It rips at our soul every time we look at these numbers and we don’t ever want to have to stand up and tell this story again.”
What did the analysts say? “Every line looks weak, with sizable revenue attrition, little evidence of cost savings and huge impairments.”
3: Here we go again
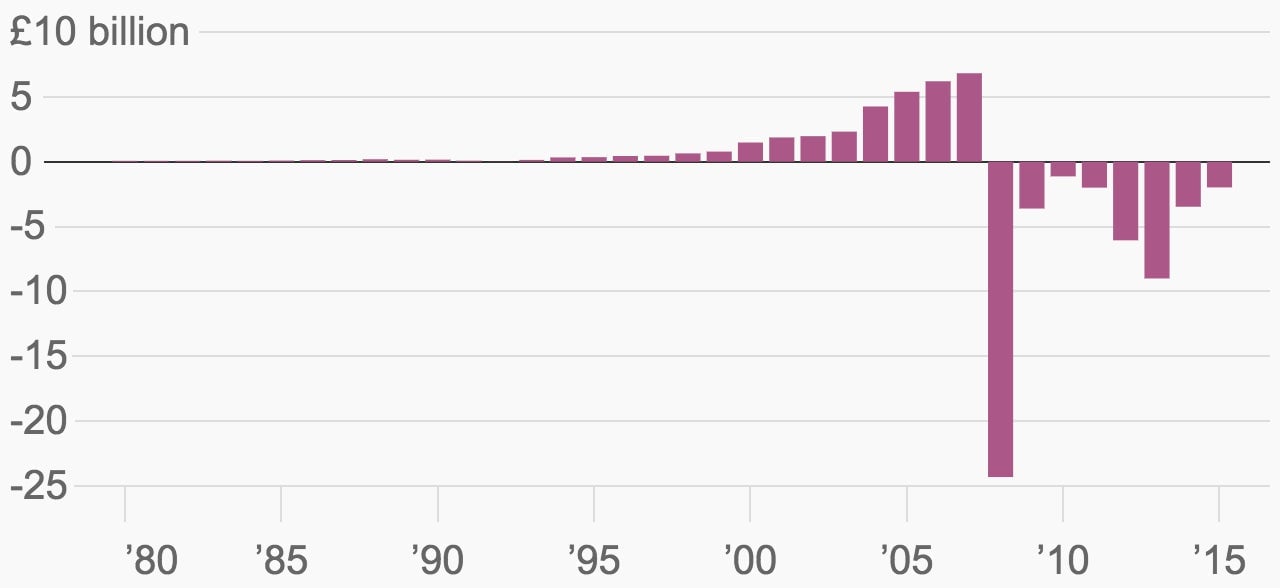
What happened? The bank recorded its eighth consecutive annual loss in 2015, with charges related to restructuring, litigation, and impairments all moving in the wrong direction. Even the bank’s long-suffering shareholders were surprised by the severity of its problems; the stock has lost a quarter of its value this year alone. Making things worse from a PR perspective, a stock-based bonus from previous years recently vested and doubled the CEO’s pay from the year before.
What did the boss say? ”I’ve said before, and I will say it again, that this is a very, very complex process.”
What did the analysts say? ”Every year we hope that the time has come for the bank to turn a corner and every year we return disappointed.”
⬇ Answers below ⬇
Have you made your guesses?
No peeking.
OK, here we go…
Bank 1: Achtung! It’s Deutsche Bank
Bank 2: Standard Chartered 📉👎😱
Bank 3: The not-so-regal Royal Bank of Scotland