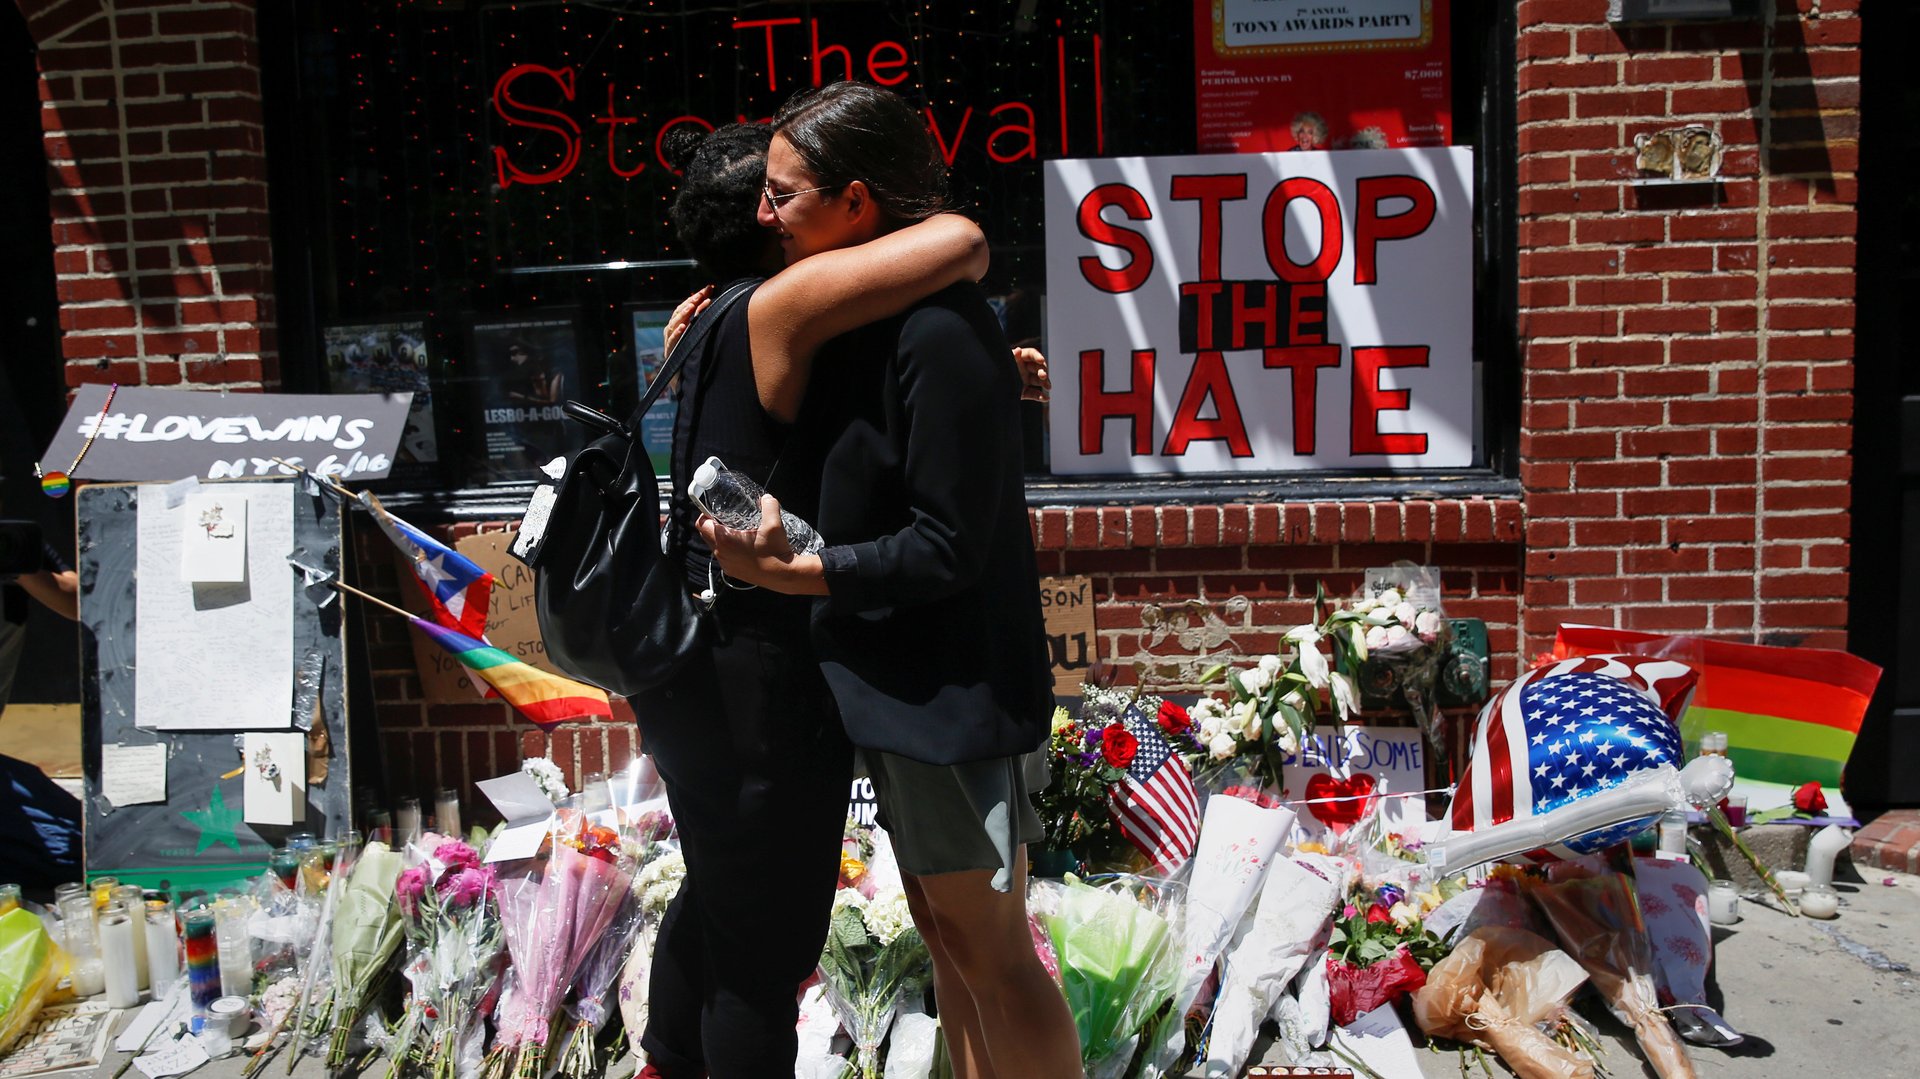
There was another mass shooting in Florida this week. It seems like this is happening more and more, that this is shaping up to be an awfully bloody summer in the US. What is it? Does the oppressive summer heat bring this on? Are things really worse or is everything just more heightened after a spate of bad news?
After Christopher Ingraham, a Washington Post data reporter, shared the above on Twitter $TWTR, we decided to take a look.
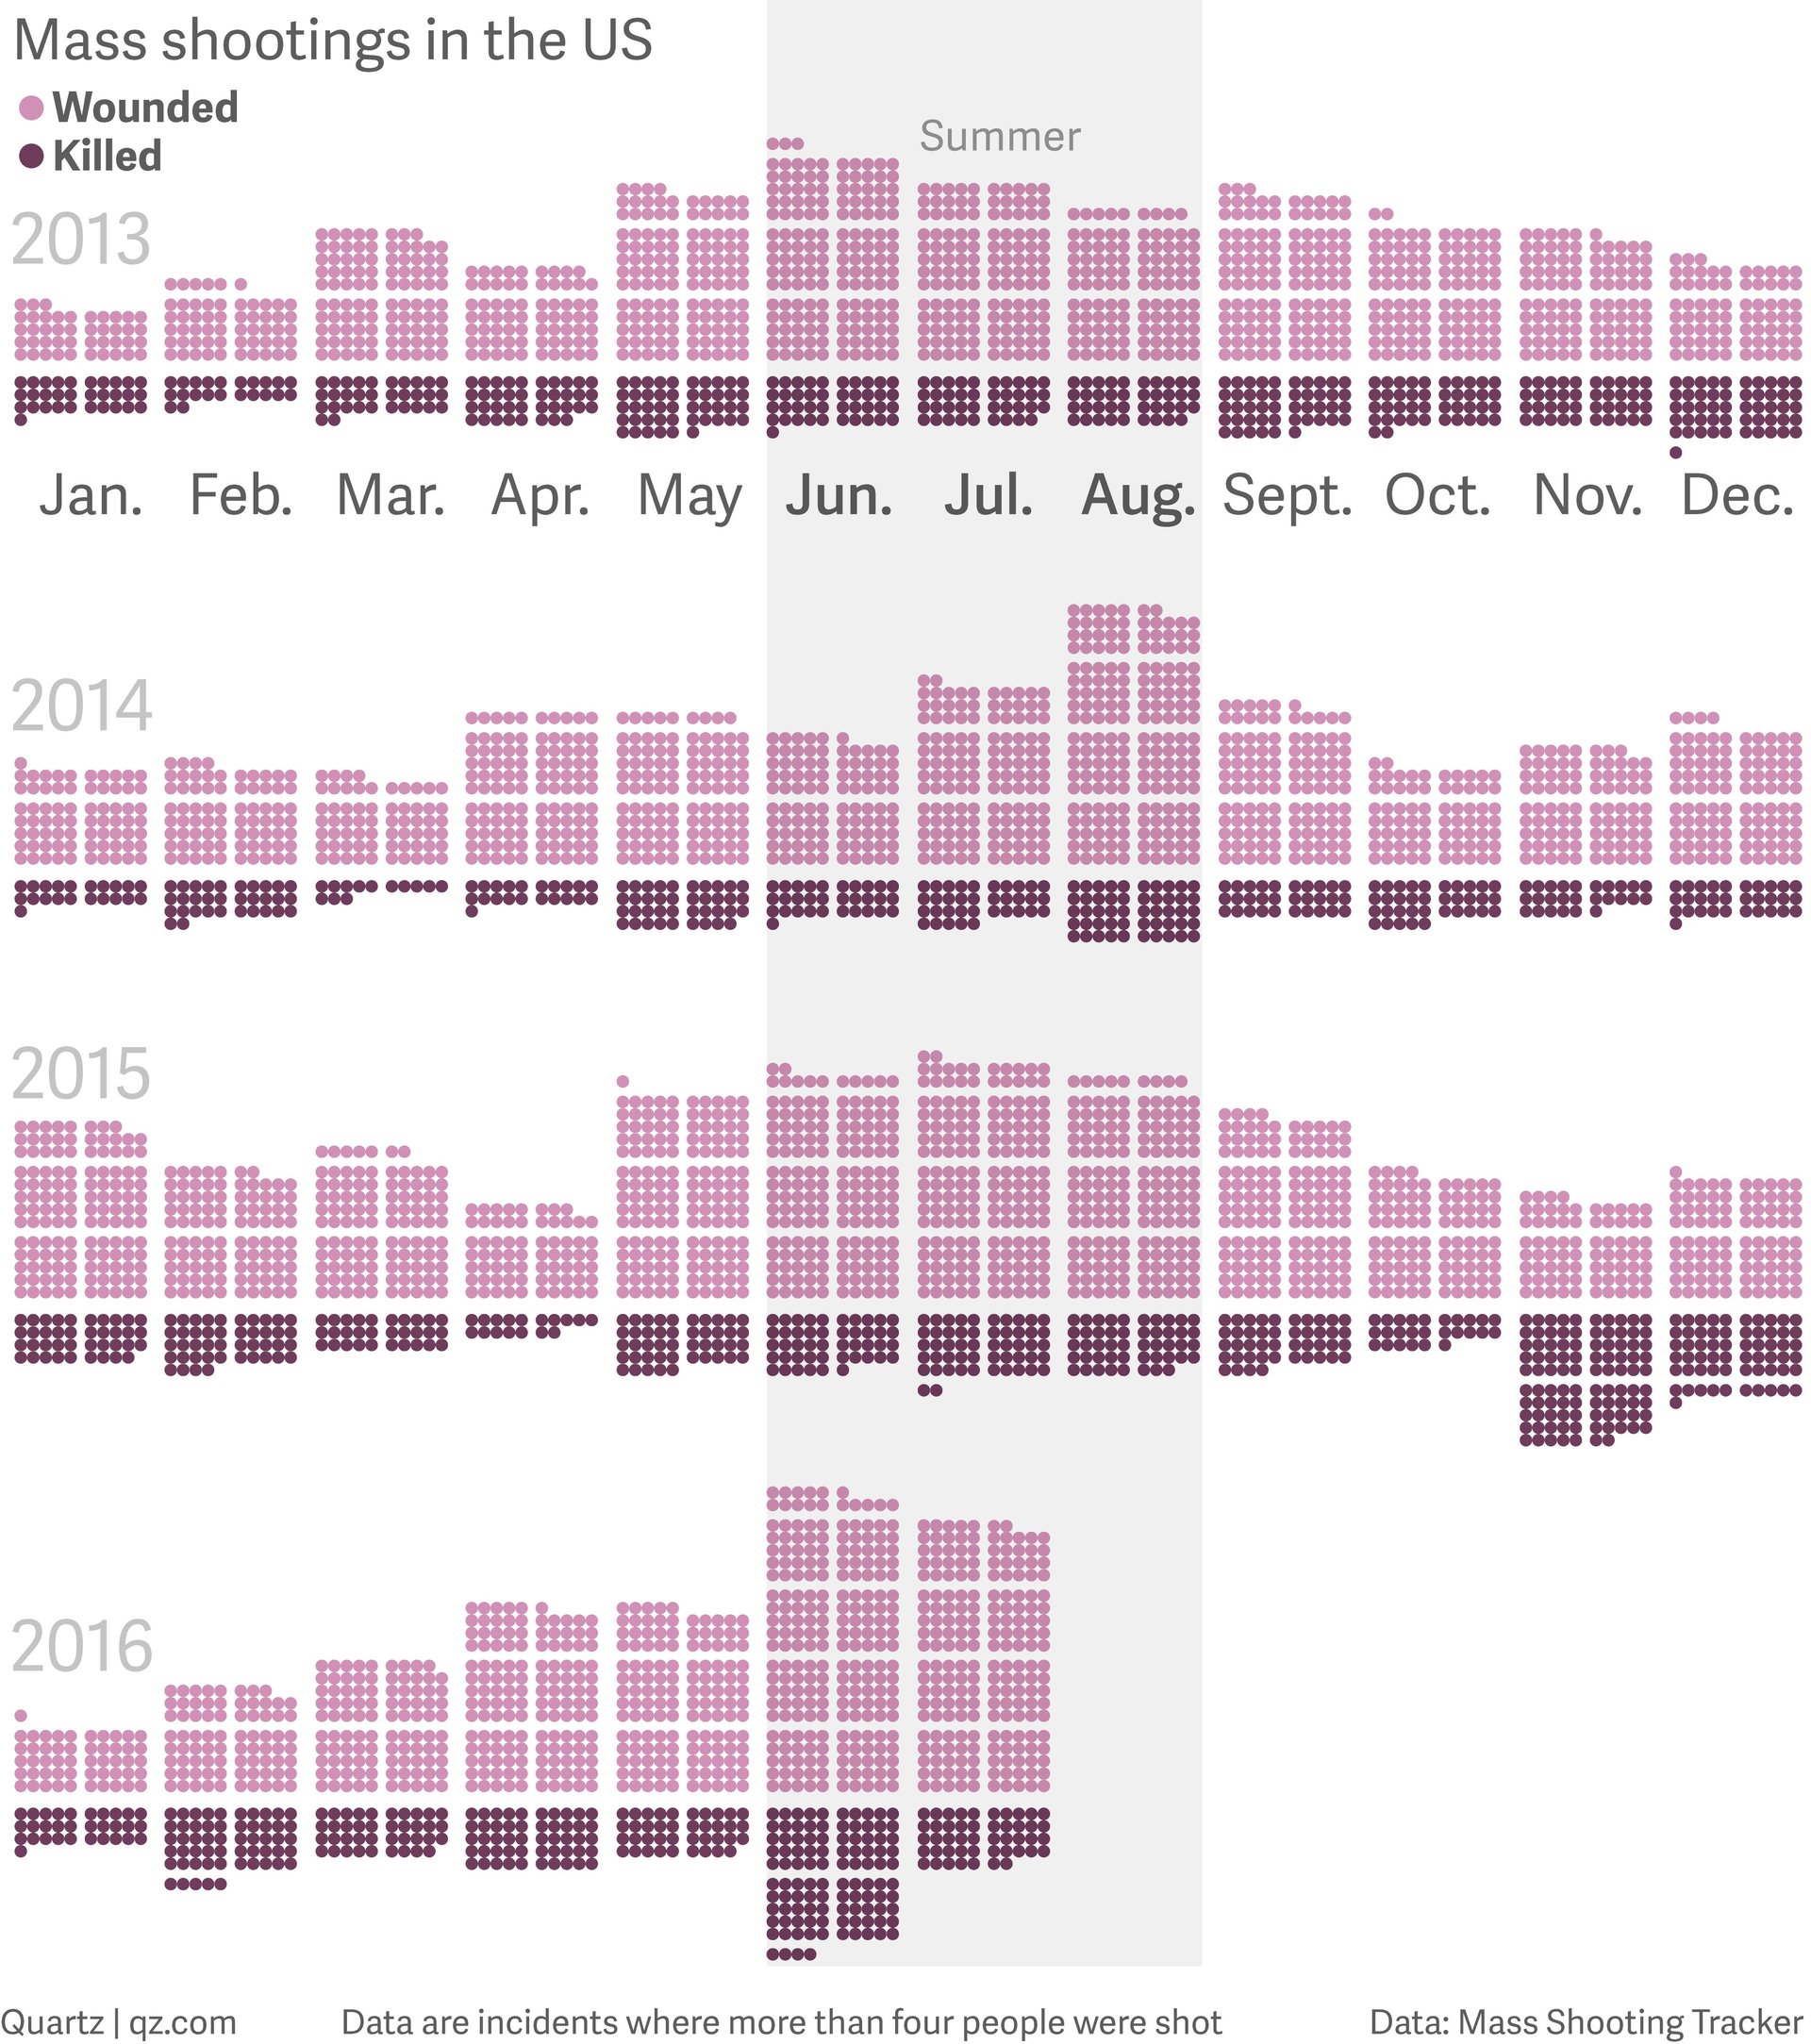
The chart below shows deaths and injuries in mass shootings. The data is from Mass Shooting Tacker, which defines a mass shooting as “an incident where four or more people are shot in a single shooting spree.” It includes police shootings and counts the gunman’s death if applicable.
So how does this summer compare to the last few? As of July 25, 574 people in the US were killed or wounded during a mass shooting. This time last year, there were 432. Last summer in total: 639. No matter how you count, it’s not looking good.
The figures in the chart above are crowd-sourced. The FBI doesn’t keep the numbers. To be clear, there is no one “right” place to find statistics for this type of violence. To see more, the Washington Post has one of the best visualizations on this topic. The Guardian has an excellent one as well.