
Inequality is one of the thorniest economic issues of our time. Economists still don’t fully understand what a more unequal economy means for long-term growth and prosperity. But one thing is for certain, inequality is rising and many Americans are anxious and unhappy about it.
It is tempting, therefore, to long for the days when things were more equal, when a high school diploma got you a stable, union job and a standard of living similar to everyone else you knew. In short, the popular imagination of the 1950s and 60s. According to some economists, inequality was much lower then and has exploded since. But a new paper uses tax data to suggest that although inequality has indeed risen in recent years, it was much, much higher than commonly believed back in the post-war years.
The best measures of inequality use tax data to measure incomes. The widely cited study (pdf) by economists Emmanuel Saez and Thomas Piketty found that income inequality was very bad in the early part of the 20th century, but declined substantially after WWII—the top 1% only accounted for 8% of total earnings in the 1960s, in large part because of the high income tax rates. This data shows inequality skyrocketing starting in the 1980s (when income taxes were lowered). Today, the top 1% gets more than 20% of overall income.
But this might not capture the full picture. Higher earners tend to own their own businesses, and this gives them scope to manipulate earnings in order to lower tax bills. Until the 1980s, when there was a major tax reform, corporate income tax rates were much lower than for personal income taxes. To avoid taxes, rich people could retain some of their earnings as corporate income.
In the 1980s, income tax rates were lowered, putting them below corporate rates. The wealthy responded by declaring more of corporate income as regular income. That made it look like personal incomes grew strongly for the top 1%, who were more likely to benefit from the tax change. Conor Clarke of Yale and Wojciech Kopczuk of Columbia, authors of a new study (pdf) on business incomes, speculate that income inequality may not be rising as fast as think, because it was much higher we thought in the past.
The figure below is the share of income going to the top 1%. The red line incorporates retained earnings from businesses into income measures. The blue and maroon lines show the more traditional measures derived by Saez and Piketty:
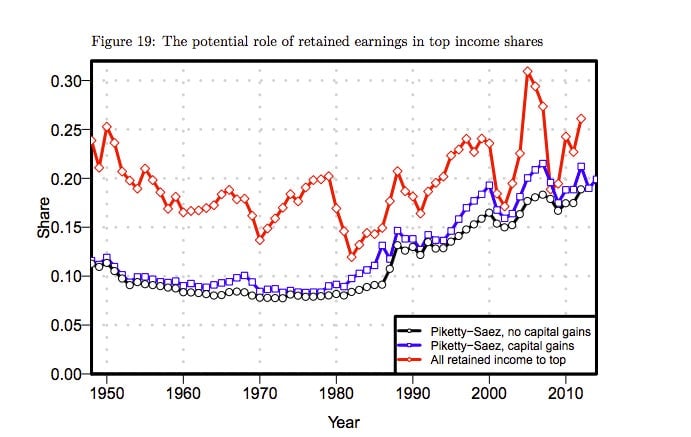
This figure, Kopczuk explains, assumes all retained earnings belong to the top 1%. “Effectively, it gives you an upper bound,” he says. “The true picture of inequality is somewhere between Piketty and Saez and the red line.”
So there is good news and bad news. The good news is that income inequality may not have risen as significantly as some estimates suggest. The bad news is that this is because inequality was already high in the first place, because back in the 1950s and 60s, high tax rates pushed the rich to arrange their incomes in different ways. That said, Kopczuk stresses that it remains important to understand why income inequality has increased over time, especially since the 1980s, even if the actual change hasn’t been as dramatic as some may think.