Irrationality, not weak supply, caused the gold bubble that you’re now watching burst
There is no doubt that in recent years the gold market has been a bubble, and it now seems to be bursting. I equally thought so in September 2011, when I recommended avoiding investments in gold; then gold was priced at $1,780, a time when investment gurus Marc Faber and Jim Rogers were strongly in favor of gold. And I reiterated that advice in 2012 when gold was at $1,622.


There is no doubt that in recent years the gold market has been a bubble, and it now seems to be bursting. I equally thought so in September 2011, when I recommended avoiding investments in gold; then gold was priced at $1,780, a time when investment gurus Marc Faber and Jim Rogers were strongly in favor of gold. And I reiterated that advice in 2012 when gold was at $1,622.
Here’s why.
The foundations of gold supply
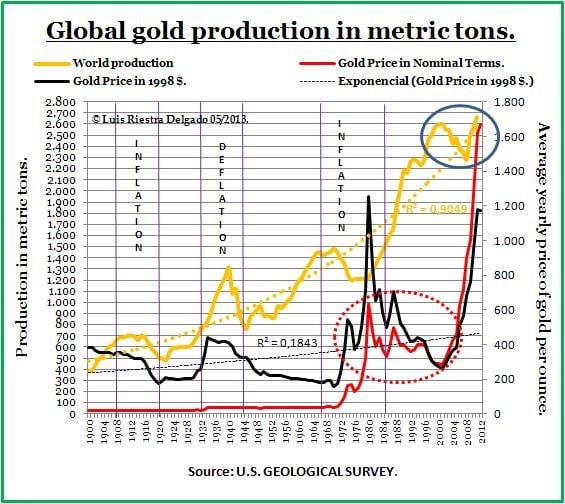
Historically, there’s been no problem supplying the market at a wide range of price levels; in fact, gold production has an exponential correlation to price over time (R^2=0.9). The correction you see in the blue circle of the chart came after producers contracted production as some central banks decided to sell gold. In addition, according to the World Gold Council (WGC) close to 35% of the supply comes from recycling, demonstrating that there is little in the way of production constraints.

There has also been a premature concern with reaching Peak gold, since underground reserves have for many years been close to what would amount to 12 years of production (WGC, point 22). The fact is, we are dealing with a well-managed industry that doesn’t overinvest in exploration. We aren’t near Peak gold conditions—the time will come, but not just yet.
The foundations of the demand
As a result of the bubble, the foundations of demand have suffered a deterioration, causing jewelry sales, the main and most solid demand driver, to fall more than 30% since the year 2000. Additionally, the industrial demand, mainly from electronics and dentistry, has fallen almost 10% since its peak in 2010, as both sectors work to substitute gold in their activities.
As speculation became rampant, bars, coins, and ETFs jumped from being close to 8% of total demand in 2000 to close to 35% in 2012. This purchasing driver includes demand to treasure (to build reserve of value), to invest and to speculate. The accumulation of high quantities at the wrong price is at least a prologue of a short in buying if not a selling force.
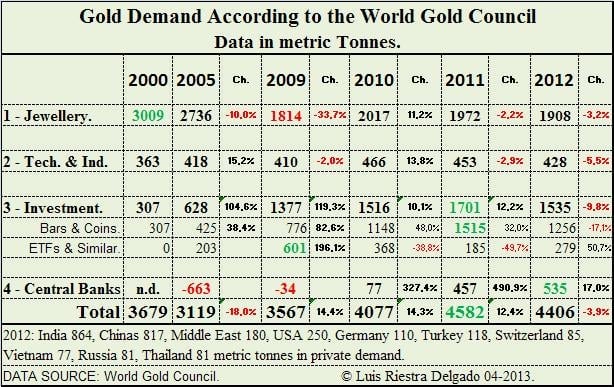
Central banks as bubble makers
There is much talk on the role of central banks as inflationary forces in commodities and assets through quantitative easing (QE). But there is another side to the equation. Central banks are gold buyers, too, and thanks to them, the global demand of gold is above 2010 lows. Countries like Russia, which holds 289.2 metric tons, Turkey which holds 259, México which holds 116.5 (their reserves where too low) and Kazakhstan which holds 41.7 have helped keep demand afloat, but it is reasonable to expect that they and others will begin to reduce their acquisitions of gold.
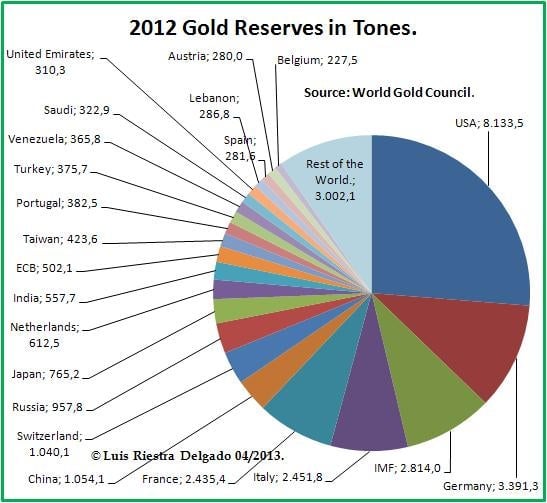
Concerns that after the Cyprus event some of PIIGs central banks would sell part of their reserves (like Portugal, which has 382 metric tons) are also adding fuel to the bearish sentiment surrounding the gold market today.
A champagne cup and the risky pennant
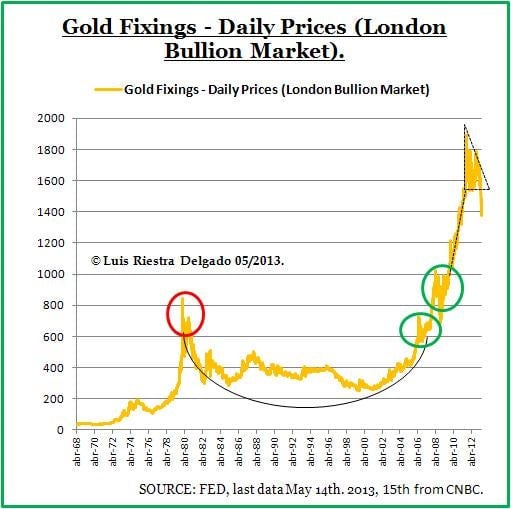
A champagne cup, similar to a cup a with handle pattern, is a formation that precedes a bull market and has a paradigmatic example in the yield of corporate bonds between 1930 and 1970, and in gold between 1980 and 2006. After that technical formation, the gold market has developed a dangerous flag figure; this formation usually breaks up if foundations are solid, but they aren’t and this time it became a bull trap.
The myth of gold as a safe heaven
Looking back 100 years in history, there is no basis to say that gold will beat inflation or deflation for sure. In fact, in real terms 1998 dollars, the $382.6 Troy ounce (31.1 grams) of 1900 (displayed in the right axis of the chart below) was valued at 1,117.3 in 2012 (yearly average), representing a compound return per year of 1%: 1.117,3 = 382.59*[(1.01)^113], not considering storage costs. This $1,117.3 is the equivalent to an average nominal price of $1,669 for 2012; that is another reason why I think now is not time to invest in gold, now is time for speculation.
From irrational exuberance to crash
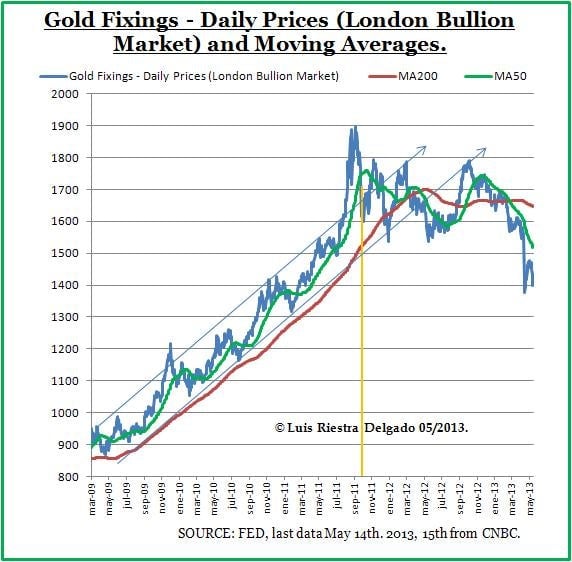
It is a classic pattern. After following a rising channel broken up by exuberance, came a lateral move to sign distribution until the line of 50 sessions moving the average parameter (MA50, green line in next chart) became a resistance impossible to cross and it all fell apart. This was the last technical signal of many others, like crossing the MA200 (red line in next chart).
From now on we can expect that the price of gold will get close to its MA50, and there we will see how the bulls use the moves of the bears to gauge how much ammunition they each have. Recent data has added new concerns for the bulls, as the return to crossing the $1,400 level may be the prelude to a market entering into a bouncing-ball style drop downwards. As an investor, I think we should wait until the market makes another lateral move, one of accumulation which will provide a solid bottom base.
Though I give you my analysis, the responsibility of your investment is your own. You can find more details of this disclaimer on my blog.