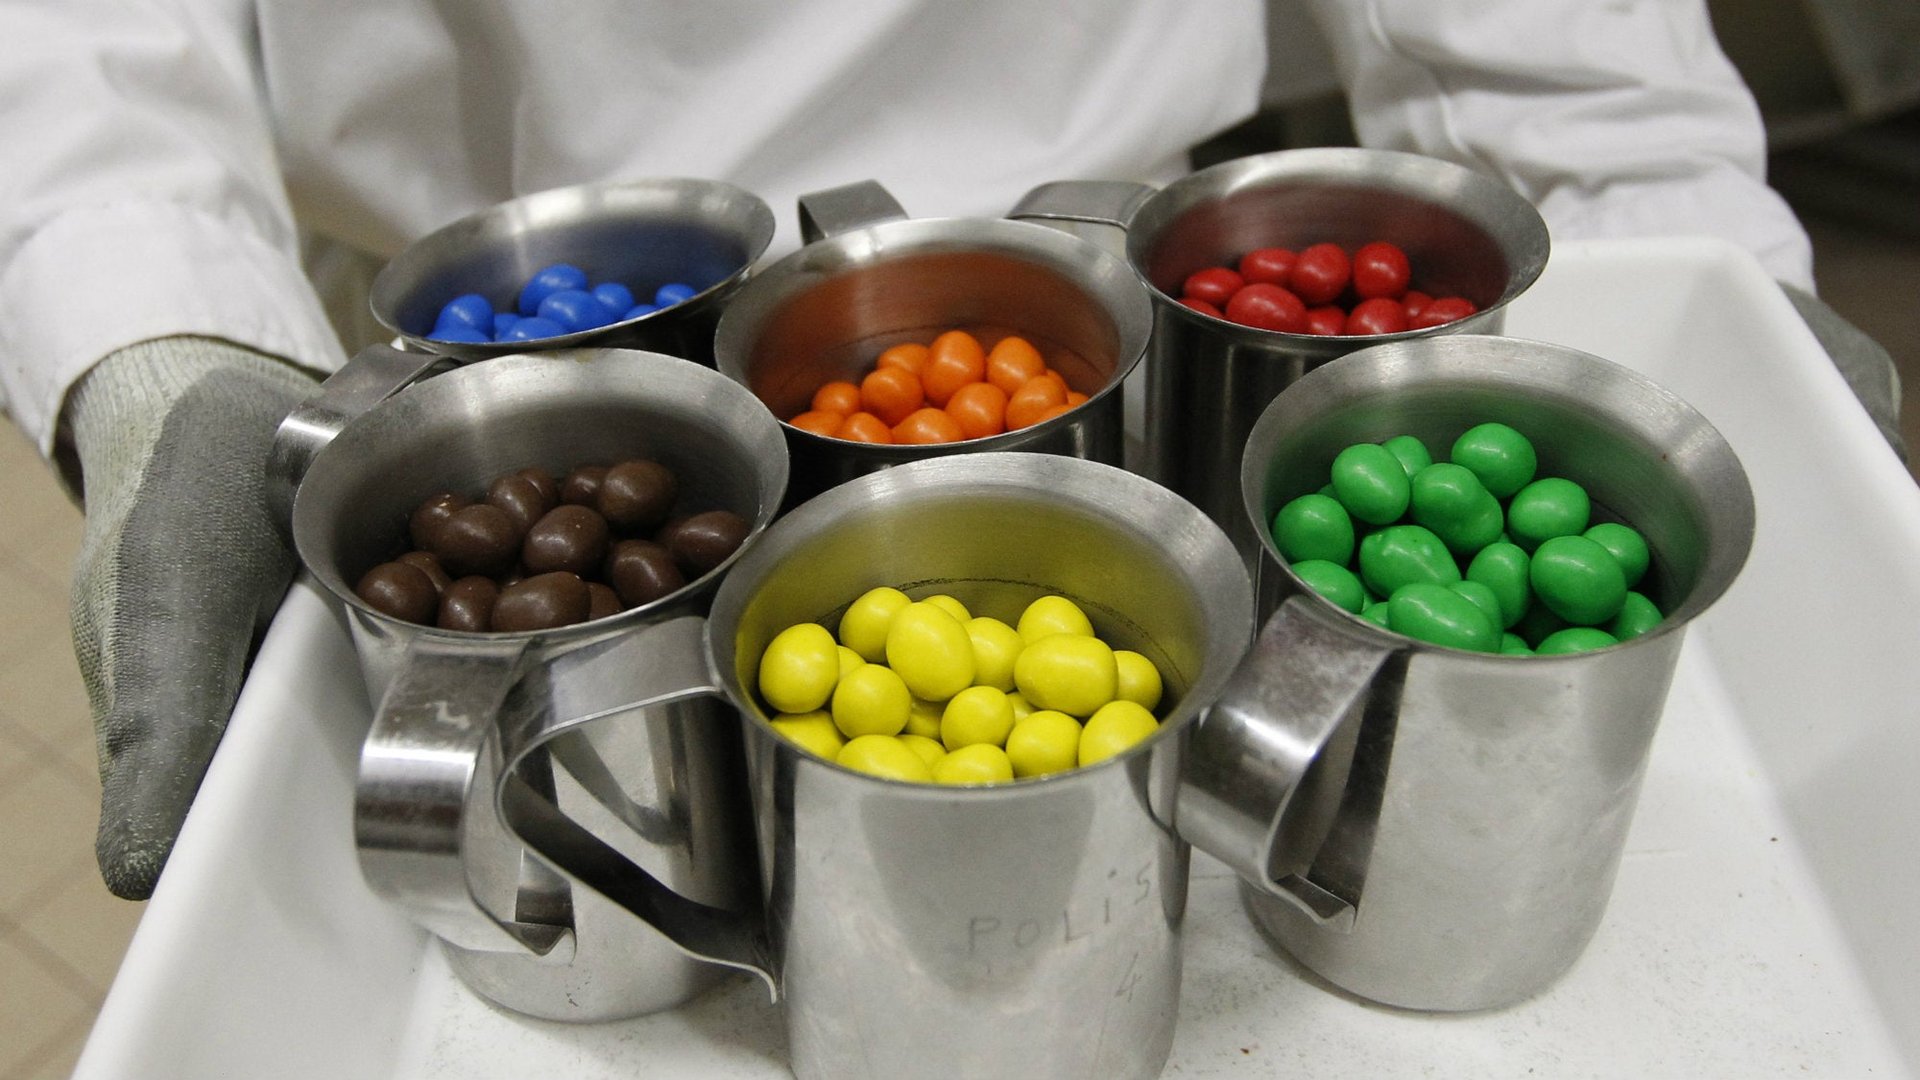
A statistician got curious about M&M colors and went on an endearingly geeky quest for answers
Troves of internet literature document the things that engineers and scientists do when left alone with candy. To this compendium we can now add a definitive investigation of M&M colors.


Troves of internet literature document the things that engineers and scientists do when left alone with candy. To this compendium we can now add a definitive investigation of M&M colors.
Patented in 1941 by candy kingpin Forrest E. Mars, Sr., M&Ms were a shameless rip-off of UK treat Smarties, which Mars may or may not have seen British soldiers eating during the Spanish Civil War. (Debates on the relative merits of Smarties and M&Ms are also a big internet thing, but that’s a separate issue.)
Since then, there have been many colorful (sorry!) moments in the M&M rainbow’s history: the 1976 coup replacing red with orange, after red’s original dye was found carcinogenic; red’s triumphant, non-cancer-causing 1986 return; the 1995 landslide popular election that installed favorite blue in place of boring, buzz-killing tan.
In the late 1990s, Mars began publishing the candy’s color breakdown on its website. In 1997, a typical bowl of M&Ms was 30% brown, 20% yellow, 20% red, 10% orange, 10% green, and 10% blue.
Over the next 10 years, according to figures on the site in 2008, the proportions changed to favor blue, orange, and green over yellow, red, and brown: 24% blue, 20% orange, 16% green, 14% yellow, 13% red, and 13% brown.
Then, sometime around 2008, the online color distribution was just…gone. Through a spokesman, Mars refused to say when or why the information was removed.
Faced with a lack of easy answers, most people would just shrug and pop another handful of M&Ms. Most people do not have a PhD in applied mathematics. Most people are not Rick Wicklin.
Wicklin is a computer programmer and statistician at the Cary, North Carolina-based software company SAS. He also spends a lot more time than most people do in proximity to M&Ms. His employer claims to be the biggest corporate consumer of M&Ms (Mars was mum on this point, too).
SAS company lore has it that CEO Jim Goodnight instituted “M&Ms Wednesday” upon the company’s founding in 1976, after falling in love with the snack during one late-night work session. Ever since, bowls in every SAS office are refilled once a week with the candies. Wicklin still remembers the warning at orientation when he joined SAS 20 years ago: “Pace yourself, as if you’re here for 20 years, you don’t want to put on 20 pounds of M&Ms.”
Given the chocolatey bounty of his workplace, Wicklin had plenty of opportunities to ponder the statistical distribution of M&M colors. Then inspiration struck.
“One day I was in the break room and I saw those M&Ms and thought, I can’t believe no one at SAS has done this,” he says. “I’ve got all this data, in the form of overflowing, never-ending M&Ms.”
The first step was to collect his data: two scoops of M&Ms a week from a jar in the closest break room over several weeks in late 2016 and early 2017. He eventually collected 712 candies, or about 1.5 pounds.
Then he got counting.
He compared what he found to the color breakdown published on Mars’s website in 2008, the most recent numbers available. They did not match. Something was afoot.
Wicklin contacted Mars, which disclosed that plain M&Ms in the US are manufactured in Tennessee and New Jersey, and each plant makes colors in different proportions. The company obligingly sent both factories’ proportions to Wicklin, who compared them to his data. (Quartz asked Mars for the same data; the company said no.)
When Wicklin compared his sample to those above, it seemed clear that he was eating Tennessee M&Ms. (He also published a detailed description of his software and methods.)
Thanks to his intrepid sleuthing, it is now confirmed that M&Ms have moved away from the brown-heavy color palette of the 1990s to one that heavily favors blue and orange in New Jersey (are Mets fans running the plant?) and blue, orange, and green in Tennessee. And if you want to double-check the original data? Too bad.
“I did eat my samples,” Wicklin says. “The evidence is gone.”
Correction: An earlier version of this story misstated the location of one of the M&Ms factories. The candies are produced in Cleveland, Tennessee, not Cleveland, Ohio.