No one thinks buying a house in London is easy. We know it’s expensive. But new data from the UK’s Office for National Statistics shows how staggeringly unaffordable housing has become in the past two decades.
No one thinks buying a house in London is easy. We know it’s expensive. But new data from the UK’s Office for National Statistics shows how staggeringly unaffordable housing has become in the past two decades.
First-time house buyers might want to look away now…
Join 500,000+ readers who start their day with Quartz.
By subscribing, you agree to our Terms of Service and Privacy Policy.
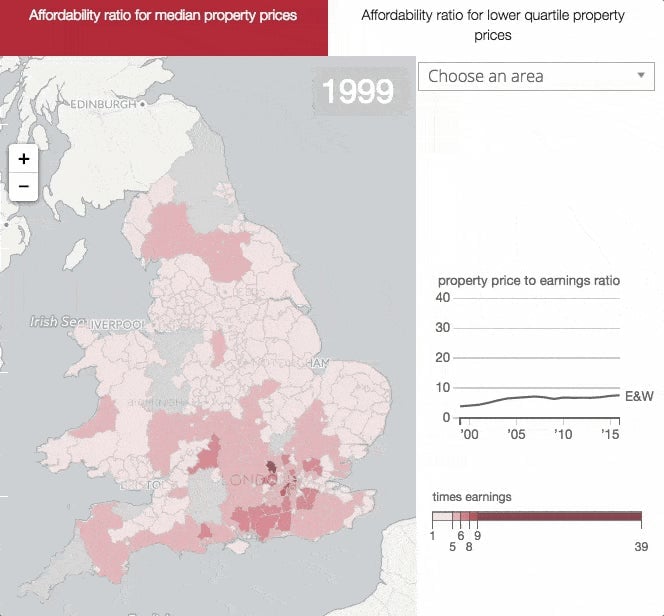
In 1997, house prices in the British capital were on average four times the annual earnings of the average worker. By 2016, Londoners could expect to pay 12 times their annual earnings to buy a home.
The situation isn’t much better across the rest of the country. On average in England and Wales, workers spend 7.6 times their annual earnings to buy a home, more than double the ratio of two decades ago.
The problem is two-fold. Since 1997, the median price for housing in England and Wales increased by 259%, which averages about 7% a year. In London, prices have climbed 421%, or 9% each year on average. The British capital has long been suffering from a shortage of housing and an influx of foreign cash using property as a haven to stash money. The pool of affordable housing has shrunk, while promises to build more homes haven’t met demand. Meanwhile, the UK’s vote to leave the EU did little to cool London’s housing market, as some economists had expected. In fact, the pound’s sharp depreciation has made the city more affordable for foreign buyers.
Meanwhile, wages haven’t increased at anywhere near the same pace as house prices. Median annual earnings have increased by just 68% in England and Wales since 1997. In London, earnings have risen 74% over the same period. Both represent an annual increase of about 3% over the two decades. While Londoners haven’t seen a substantial increase in pay like the rest of the country, house prices have skyrocketed in comparison, creating the massive disparity in the affordability ratio.
Of the top 10 areas the ONS said housing affordability had deteriorated the fastest, nine of them are in London. The least affordable area is Kensington and Chelsea in London—long out of reach for the average buyer—where house prices are almost 40 times the median gross annual earnings. The ONS created an interactive map that tracks affordability across the country. Watch it and weep.