The '10 Americas': How geography, income, and ethnicity shape life expectancy in the U.S.
A new study reveals a 20-year gap in life expectancy between the longest and shortest-lived groups in the U.S.

The gap in life expectancy across the United States between people who live the longest and the shortest has widened dramatically over the past two decades, growing to 20 years in 2021, up from 12 in 2000, according to a new study published in scientific journal The Lancet (RELX).
The analysis reveals stark differences in how long Americans live, shaped by income, race and ethnicity, and geographic location. These disparities divide the nation into what researchers describe as “ten Americas,” underscoring the significant inequalities in opportunity and health outcomes across the country.
“The extent and magnitude of health disparities in the USA are truly alarming. In a country with the wealth and resources of the USA, it is intolerable that so many are living in conditions and with health outcomes akin to those of an entirely different country,” wrote the researchers—coming from the University of Washington and the Council on Foreign Relations, a think tank.
Find out more about the 10 Americas in the following slides.
2 / 11
America 1: Asian individuals

“America 1" is made up of Asian and Native Hawaiian and Pacific Islander (NHPI) populations living in counties where NHPI individuals made up less than 30% of the total Asian and NHPI population in 2020. This group had the highest life expectancy in 2021 at 84 years old.
3 / 11
America 2: Latino individuals in counties outside the Southwest

Latino individuals in counties outside the Southwest, as opposed to Latinos living in the Southwest—which represent their own “America” in the study—had a life expectancy of 79.4 years old.
4 / 11
America 3: White (majority), Asian, and American Indian or Alaska Native (AIAN) individuals in other counties

“America 3" is made up of white, Asian and American Indian or Alaska Native individuals who lived in areas not included in other Americas. This group had a life expectancy of 77.9 years old.
5 / 11
America 4: White individuals in non-metropolitan and low-income Northlands
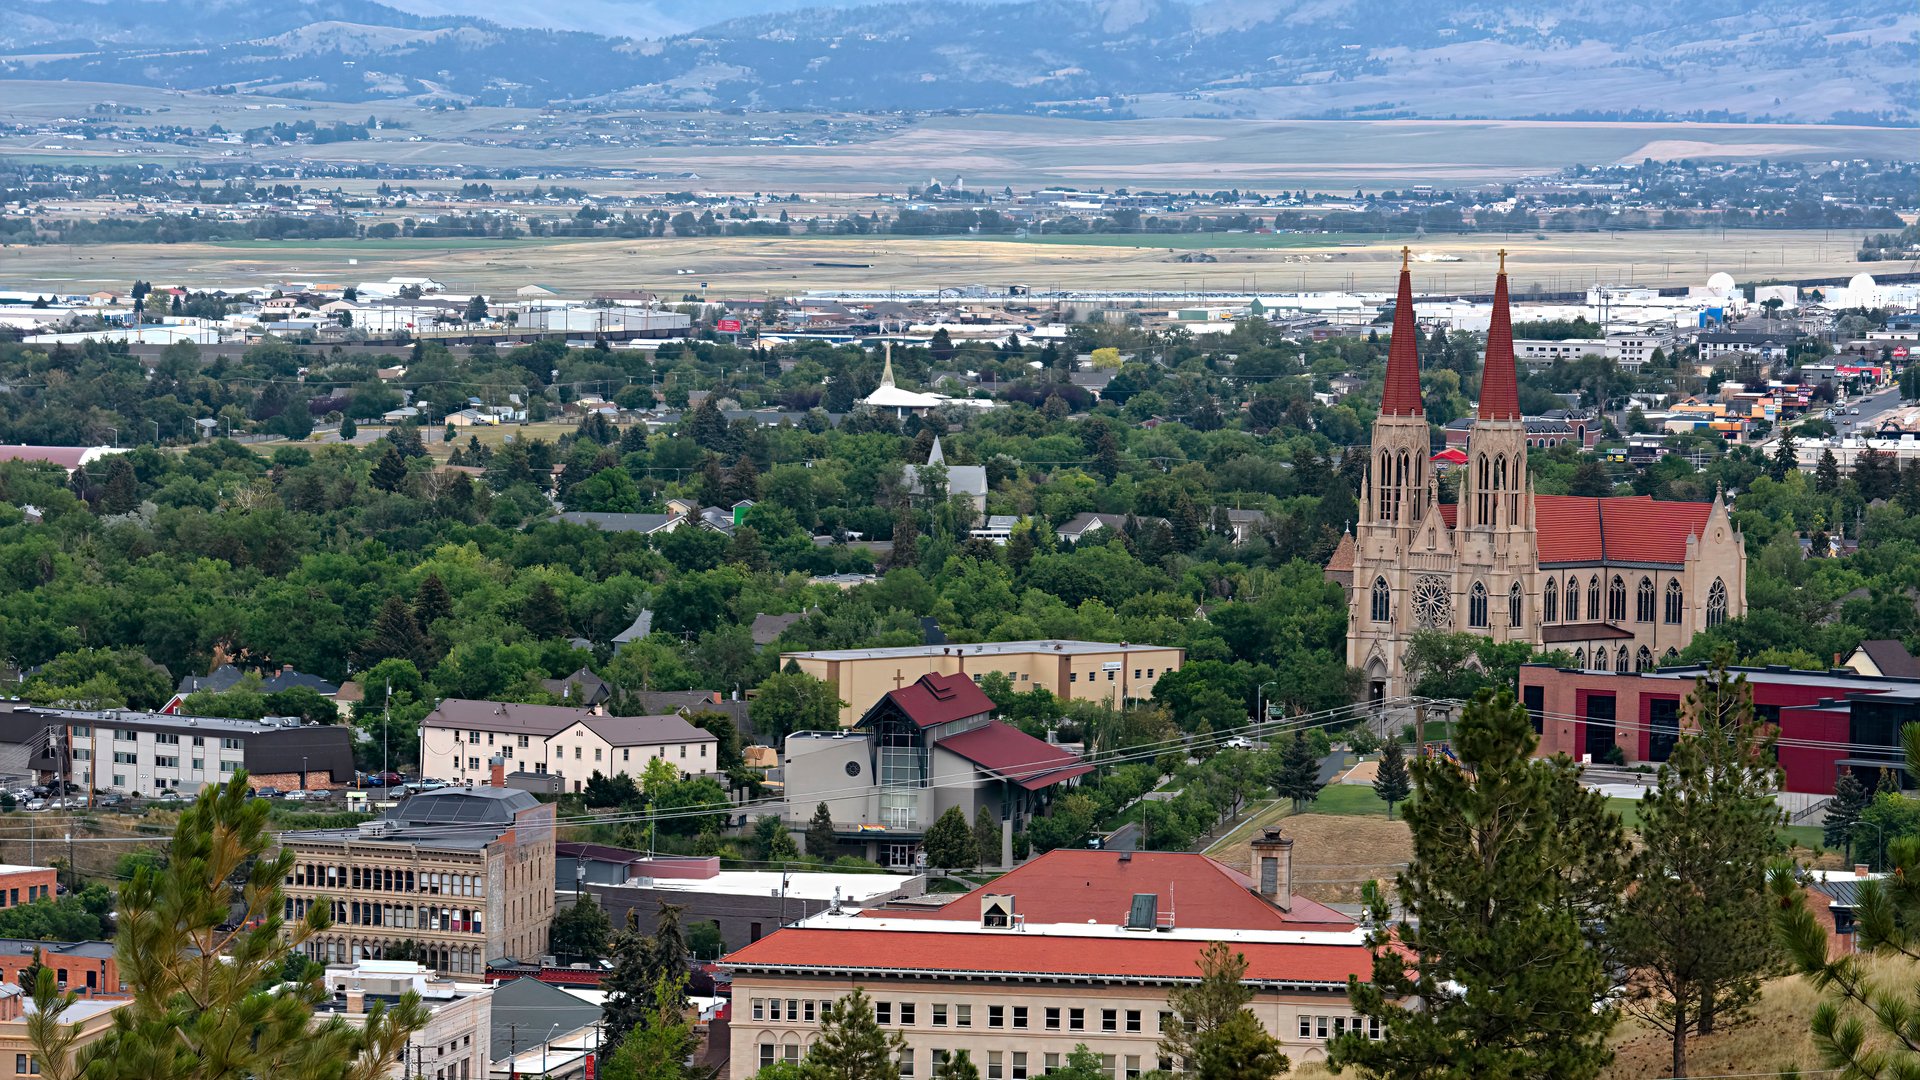
This group is made up of the white population living in non-metropolitan counties in Iowa, Minnesota, Montana, Nebraska, North Dakota, and South Dakota, where income per capita was below $32,363 in 2020. Their life expectancy in 2021 was 77 years old.
6 / 11
American 5: Latino individuals in the Southwest
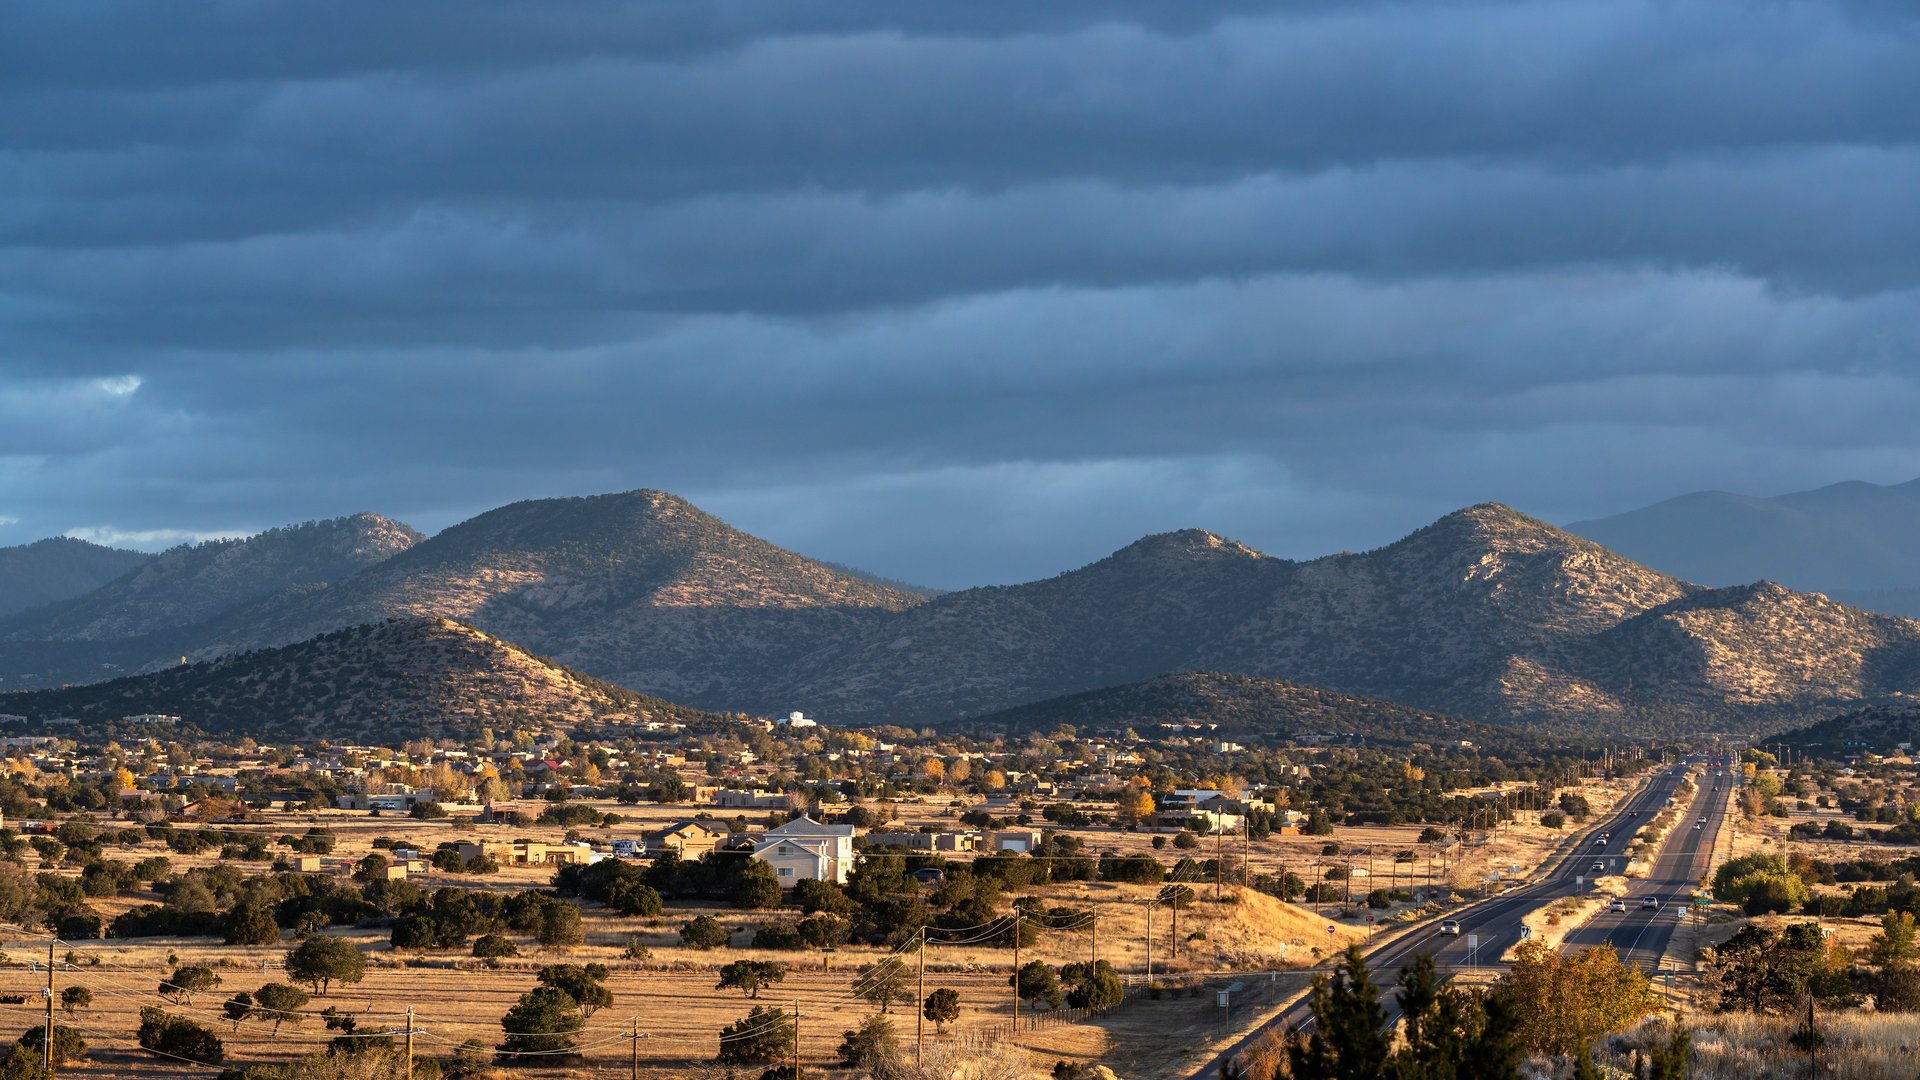
Latinos living in the Southwestern states of Arizona, Colorado, New Mexico, and Texas had a life expectancy of 76 years old.
7 / 11
America 6: Black individuals in other counties

Black individuals who lived in areas not included in the study’s other “Americas” had a life expectancy of 72 years old.
8 / 11
America 7: Black individuals in highly segregated metropolitan areas

The study’s“America 7" is made up of Black individuals who live in highly segregated, high-population metropolitan counties. Their life expectancy was 71.5 years old.
9 / 11
America 8: White individuals in low-income Appalachia and Lower Mississippi Valley
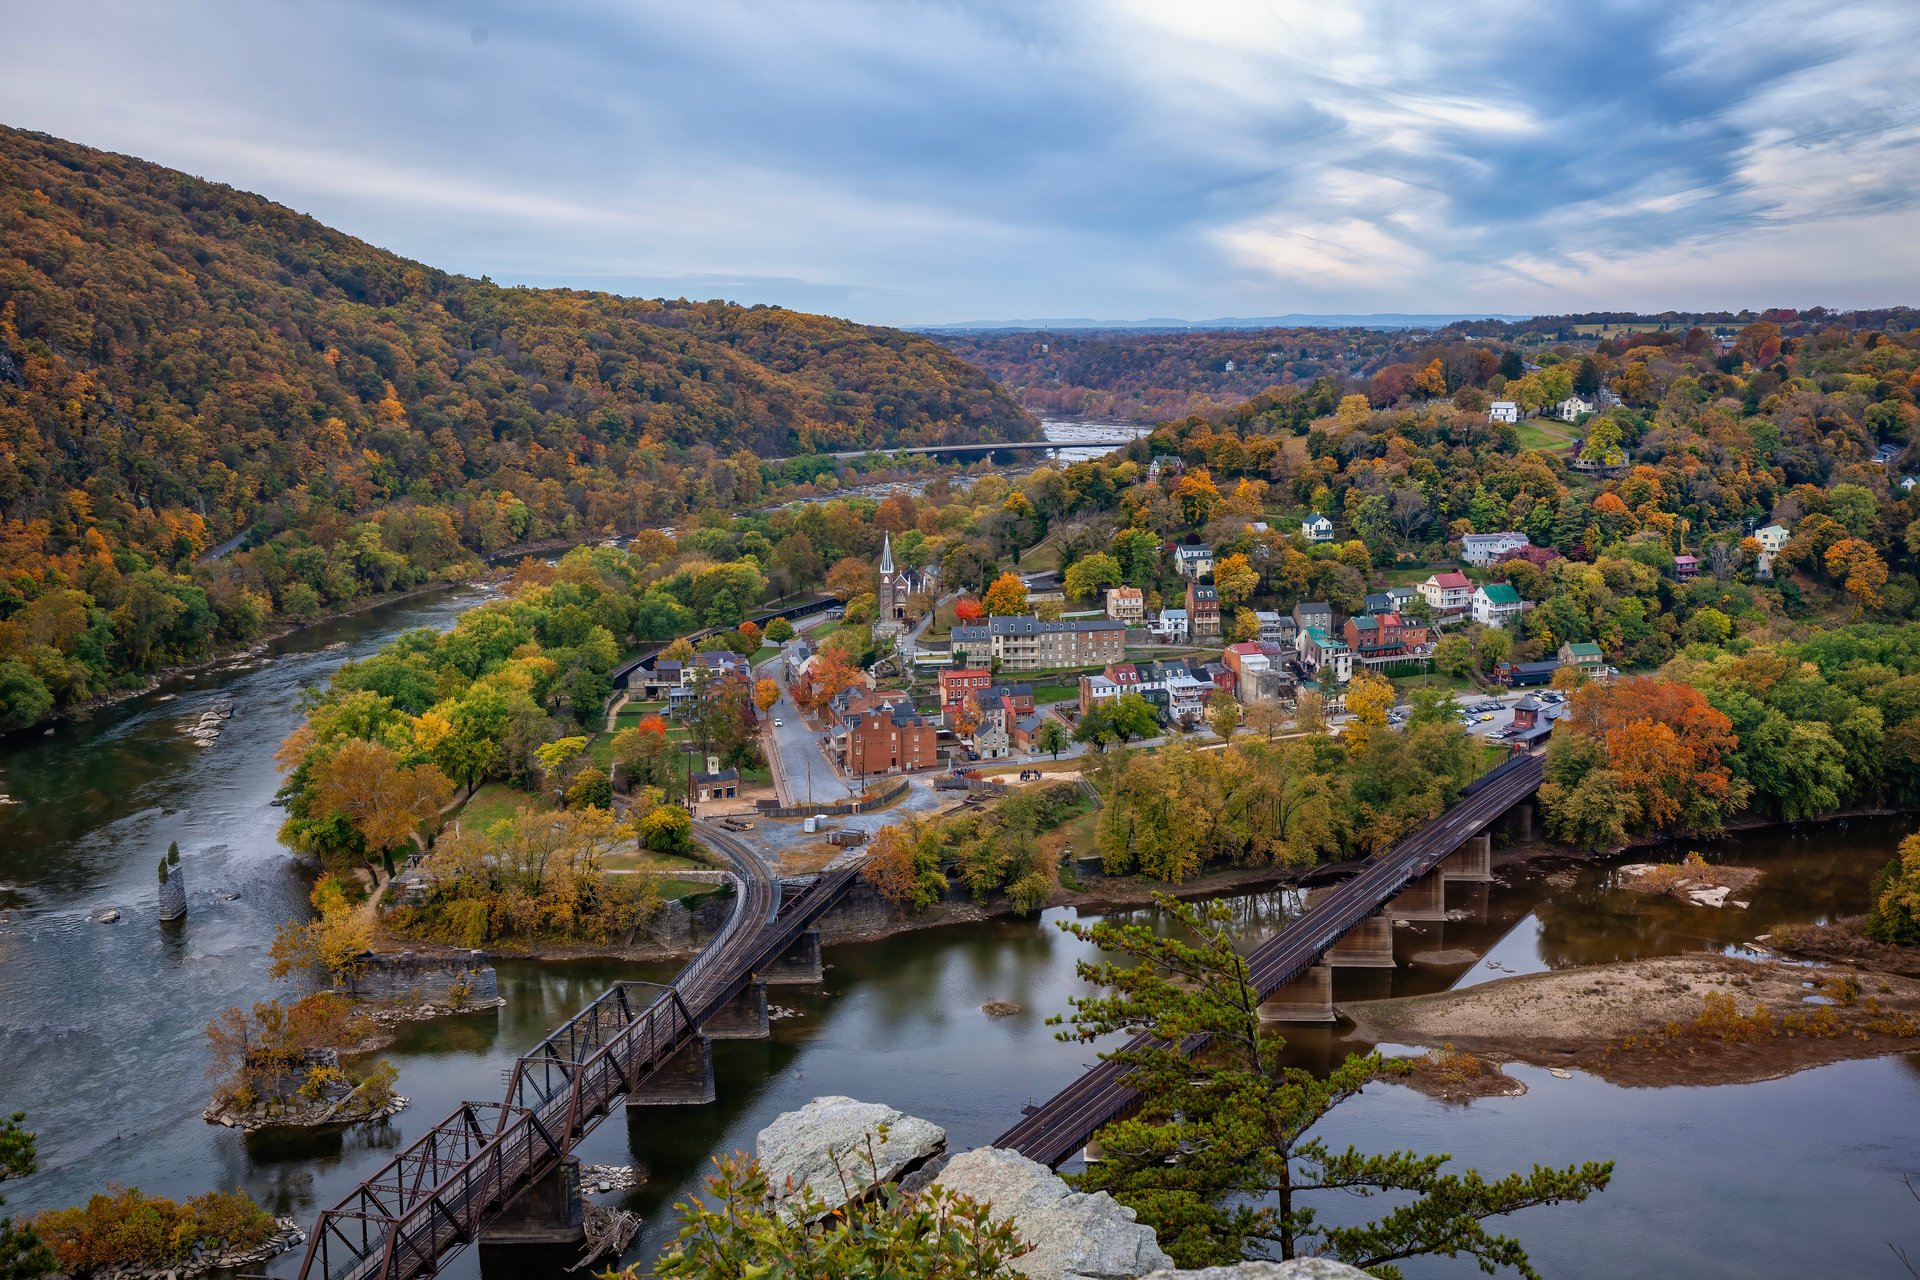
This “America” is made up of the white population living in counties in Appalachia and the Lower Mississippi Valley, where the income per capita among the white population was less than $32,363 in 2020. The life expectancy of this group was 71.1 years old.
10 / 11
America 9: Black individuals in the non-metropolitan and low-income South
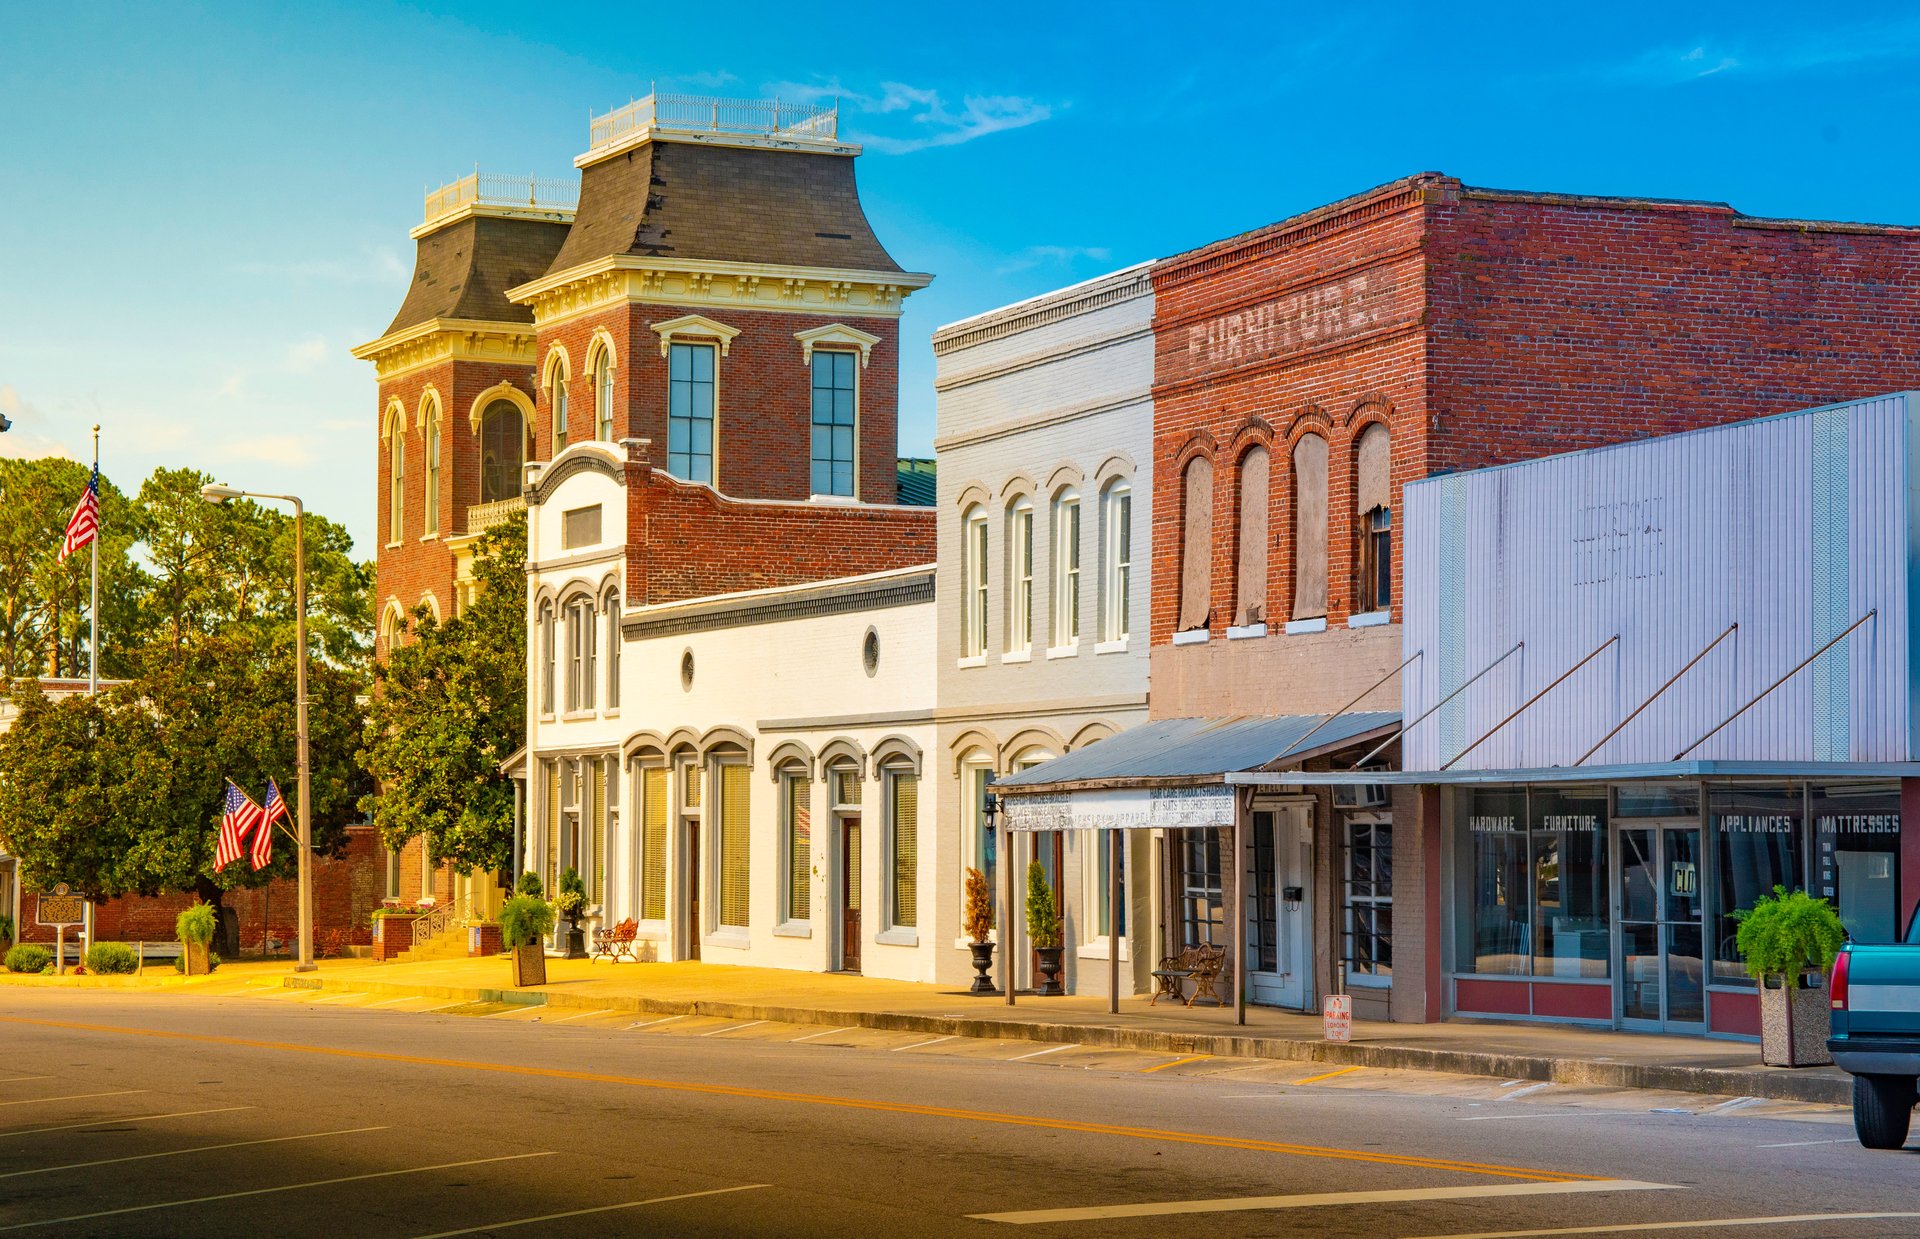
This group consists of the Black population living in non-metropolitan counties in the Lower Mississippi Valley or Deep South, where income per capita among the Black populations in these area was below $32,363 in 2020. Their life expectancy was 68 years old.
11 / 11
America 10: American Indian and Alaska Native (AIAN) individuals living in the west

“America 10" had the lowest life expectancy at 63 years old. This group is made up of the AIAN population living in counties in Arizona, Colorado, Idaho, Kansas, Minnesota, Montana, Nebraska, Nevada, New Mexico, North Dakota, Oklahoma, South Dakota, Utah, and Wyoming.
