
Park access varies from one city to the next. Trust for Public Land measured which of the 100 largest metros spend the most per resident on green space
David Everett Strickler / Unsplash
A park can change the way a neighborhood functions. Families with young children treat playgrounds as a daily routine rather than a weekend outing. Older residents rely on paved trails and shaded benches for exercise that doesn't require a gym membership or a car ride. Renters evaluating two apartments at the same price point often pick the one closer to green space without thinking twice, and homeowners in park-adjacent blocks tend to see stronger resale values over time. The practical benefits go beyond quality of life. Cities that maintain well-funded park systems absorb stormwater more efficiently, reduce urban heat, and give residents free alternatives to activities that would otherwise cost money out of pocket.
Not every city delivers on that promise equally. Nationally, only 76% of residents in the 100 largest cities live within a 10-minute walk of a park, and spending per resident ranges from double-digit figures in some cities to more than $300 in others. The gap between the best-funded systems and the rest has widened in recent years, as the best-funded systems keep adding acreage, amenities, and programming while underfunded ones struggle to maintain what they already have. A new economic analysis found that city parks return $3 in measurable benefits for every $1 invested, a figure that accounts for reduced health care costs from physical activity, savings on stormwater infrastructure, and free recreation that would otherwise come out of residents' pockets.
Trust for Public Land released its 2026 ParkScore index in May, ranking the park systems in the 100 most populous U.S. cities across five equally weighted categories. Access measures the share of residents living within a 10-minute walk of a park. Equity compares park space and access between communities of color and white communities, and between low-income and high-income neighborhoods. Acreage, investment, and amenities round out the scoring, with each city earning up to 100 points. The top five cities all scored above 81, and no other state besides Minnesota placed two cities in that group. The scores at the top were tight enough that small year-over-year shifts in any single category could reshuffle the order, a sign that competition among the leading park systems has become a genuine race rather than a formality.
Andy Feliciotti / Unsplash
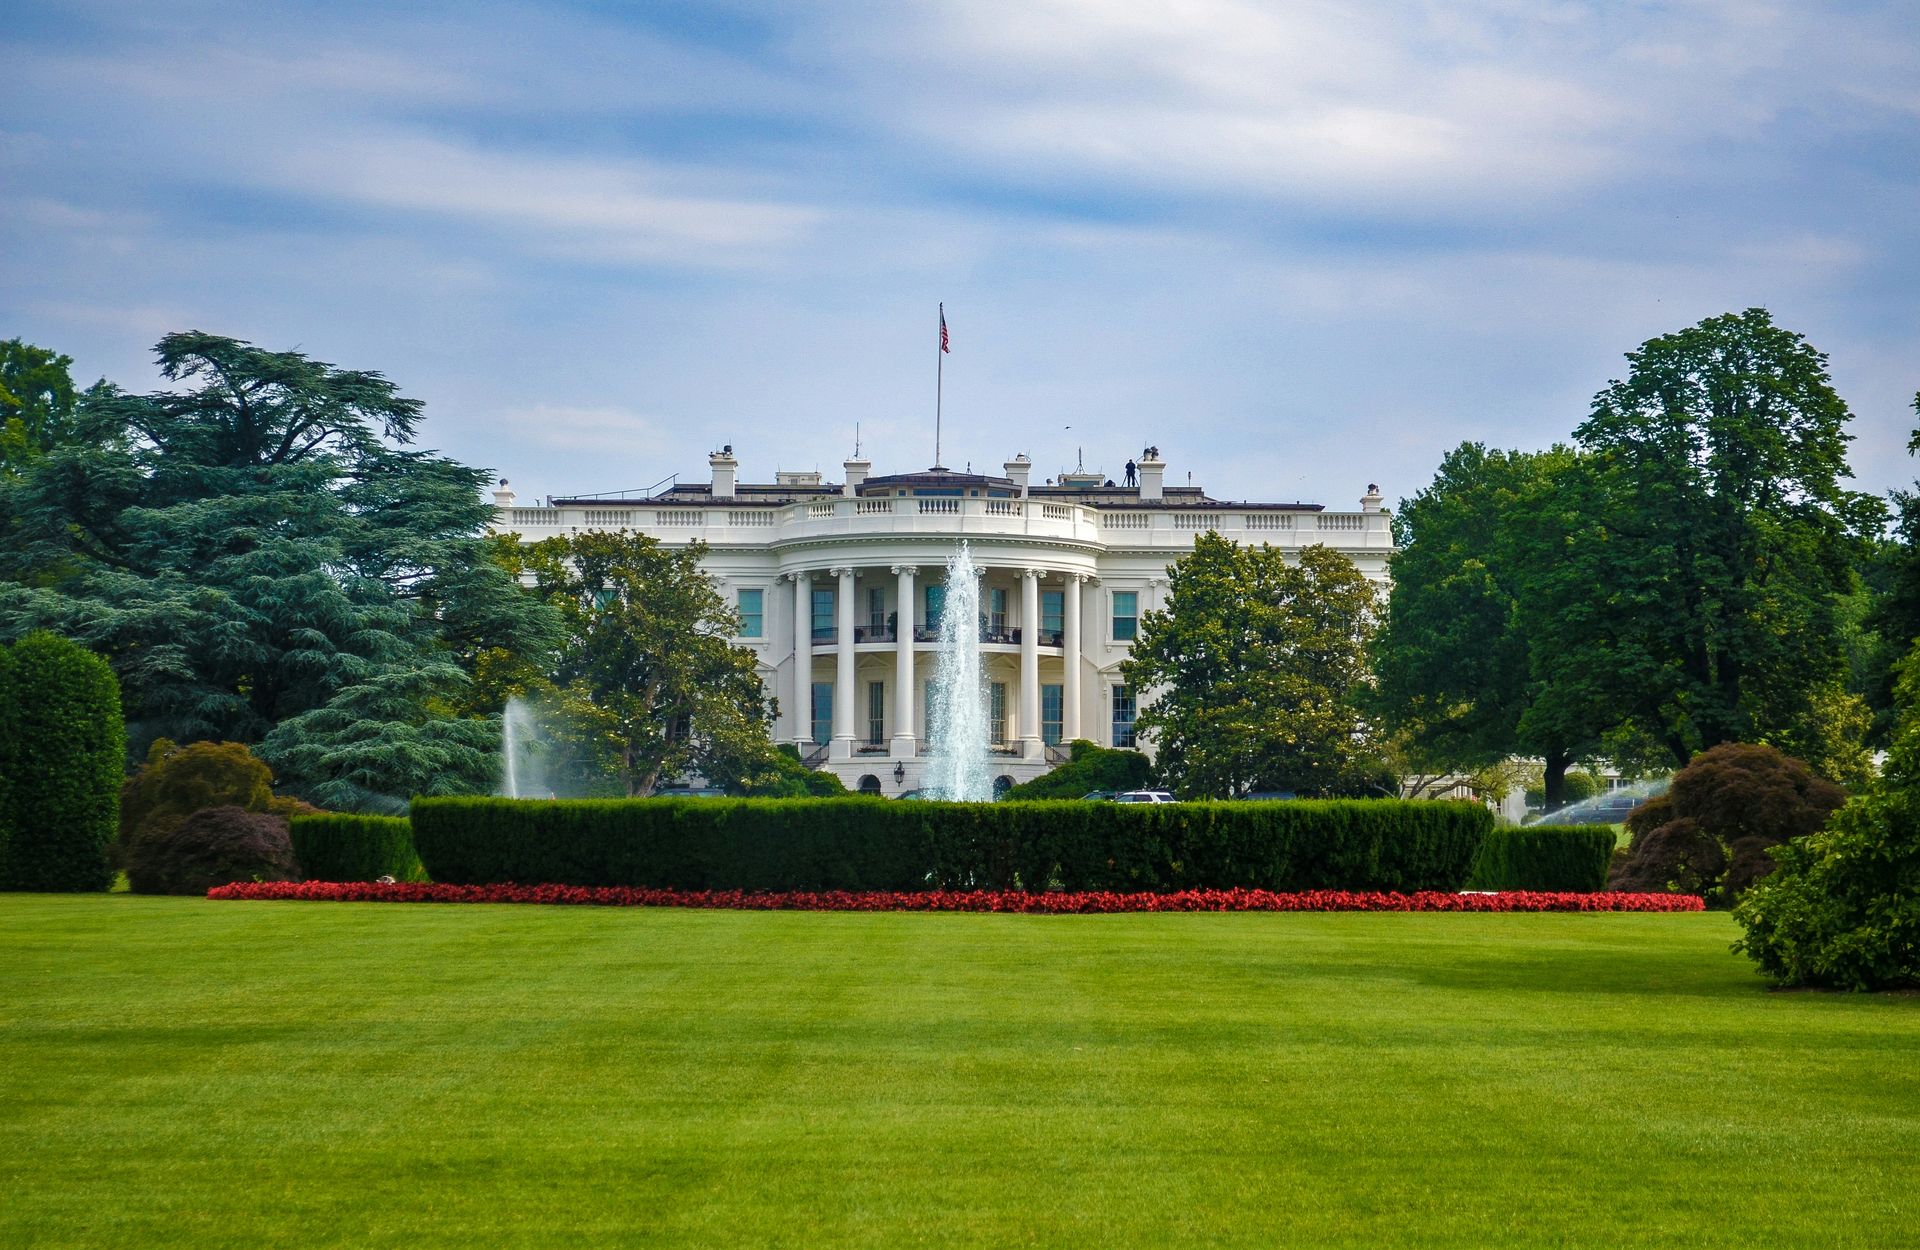
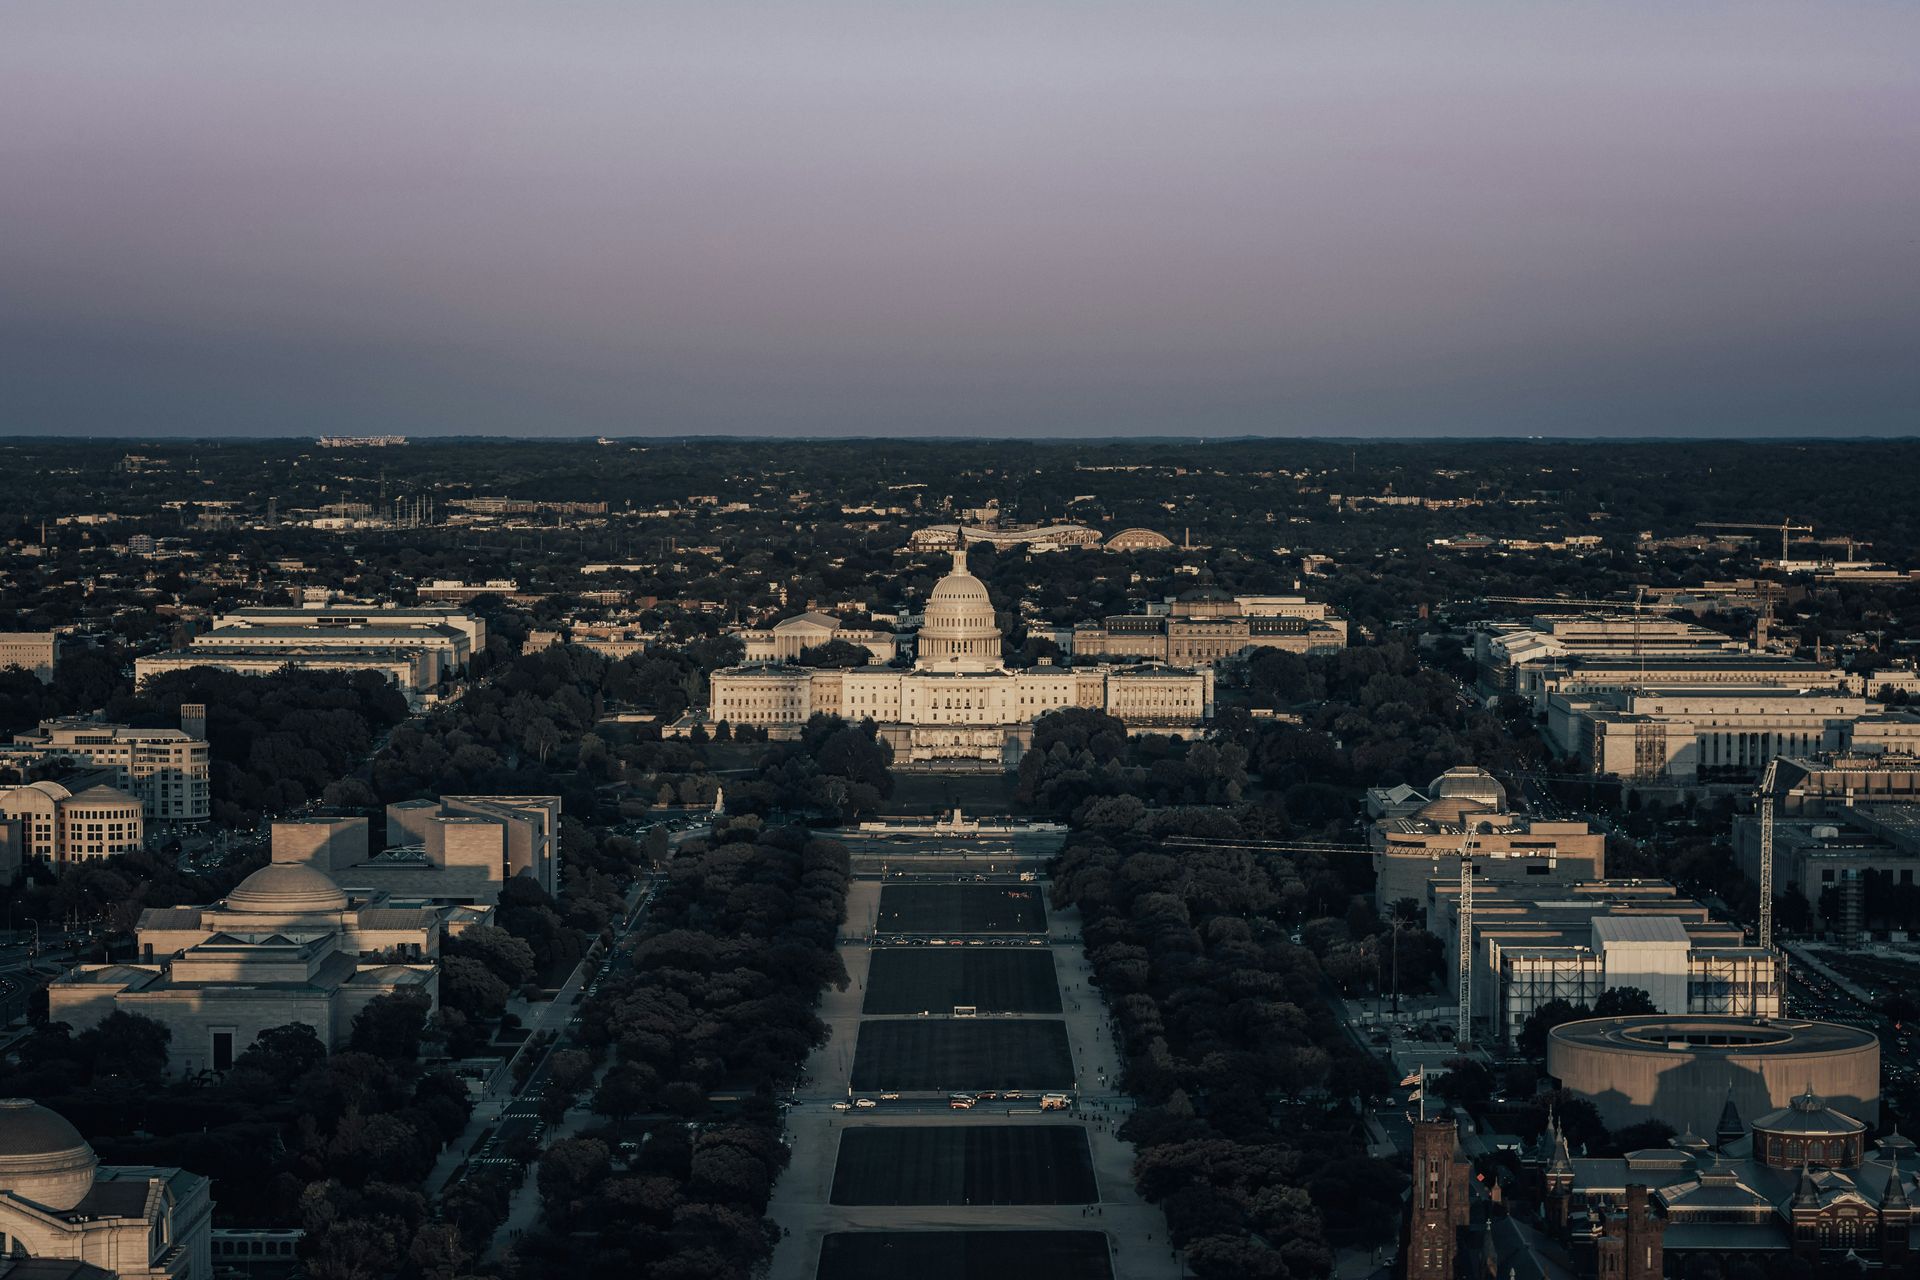
Trust for Public Land gave Washington, D.C., the highest ParkScore rating in the country for the sixth consecutive year, awarding the District 85.1 out of 100 points. More than 21% of the city's land is reserved for parks, one of the highest shares among the 100 cities in the study. The District also earned top marks on the index's access and equity metrics, which measure both how close residents live to green space and whether that access holds up across income levels and racial demographics. Mayor Muriel Bowser framed the streak as the product of deliberate, sustained investment in the parks, playgrounds, and recreation centers that serve every corner of the city.
The consistency of Washington's performance stands out more than the ranking itself. Holding the top spot for six straight years in an index where the margins between first and fifth place amount to fewer than four points requires a park system that performs well across every category rather than dominating just one. Washington doesn't lead the nation in any single amenity the way Cincinnati leads in playgrounds or Boise leads in dog parks. Instead, the District posts strong scores across access, equity, acreage, investment, and amenities simultaneously, a balance that no other city in the study has matched over the same stretch.
The $3-for-$1 return on park investment that Trust for Public Land's accompanying economic analysis identified plays out visibly in a city where 375 parks serve a population that treats green space as basic infrastructure rather than a luxury. Washington's parks also function as stormwater management tools, absorbing rainfall that would otherwise tax aging drainage systems, and the city's recreation centers offer free programming that substitutes for services residents in other cities pay for out of pocket. The combination of fiscal return and daily utility helps explain why the District's park budget has remained durable even as other line items face pressure, and why a sixth consecutive first-place finish looks less like a streak and more like a structural advantage that lower-ranked cities will struggle to replicate without matching Washington's level of sustained commitment.
Ariel Blanco / Unsplash
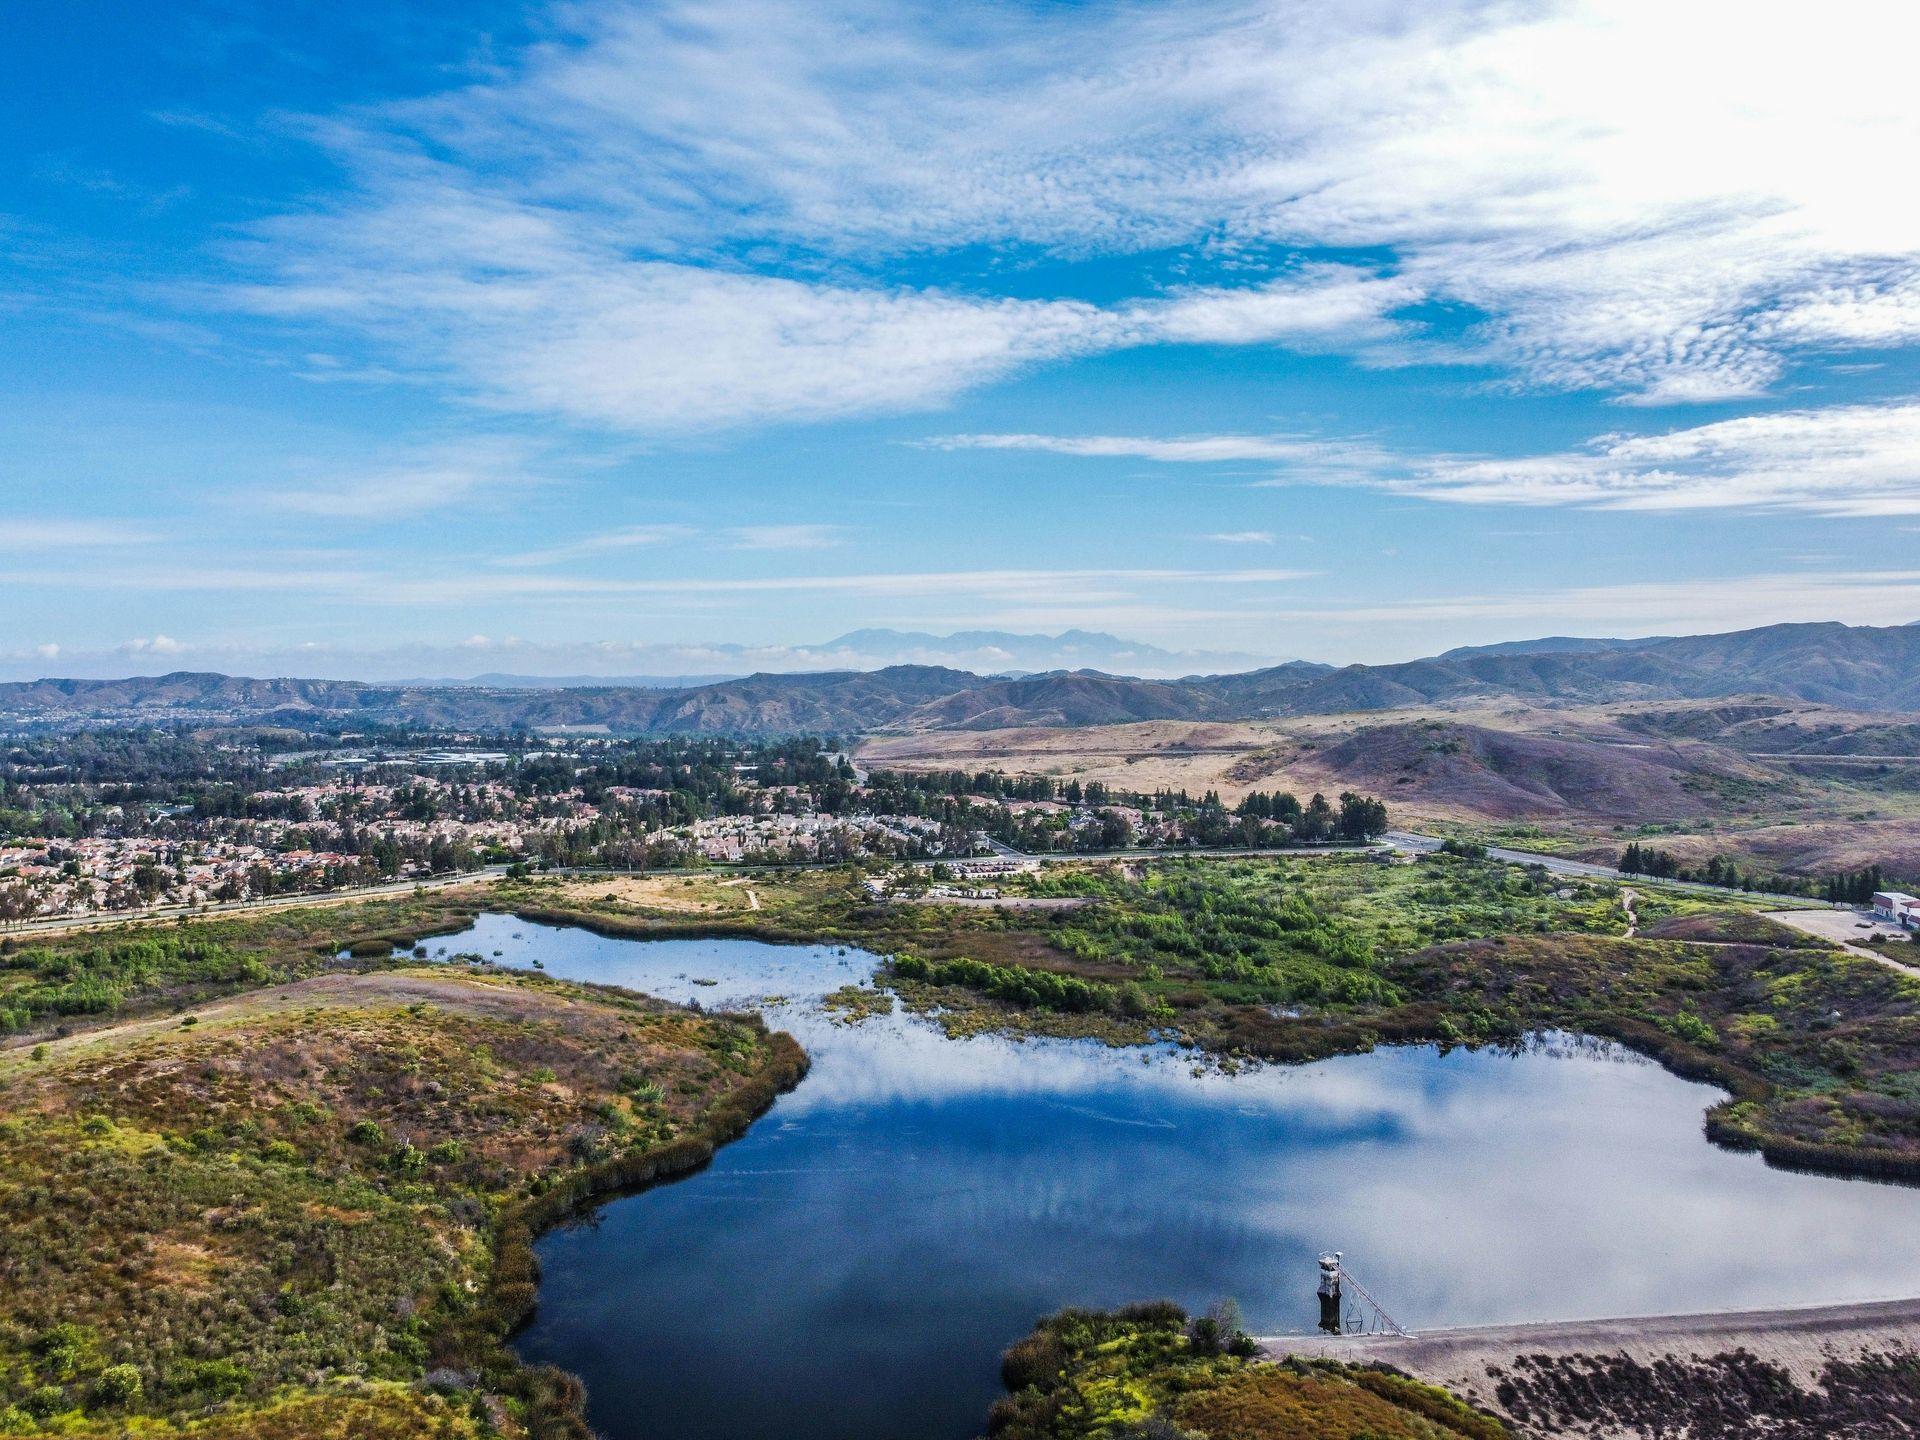
Irvine retained its second-place ranking in the 2026 ParkScore index with a score of 84.1, fewer than a single point behind Washington, D.C. Trust for Public Land credited the city's continued progress on its Great Park, one of the most ambitious municipal park projects in the country, as a driving force behind the score. The Great Park sits on the site of the former Marine Corps Air Station El Toro, a military base that operated from 1943 to 1999 and closed as part of a broader round of federal base realignments. Voters approved the conversion to parkland in 2002, and the city has been building it out in phases ever since. More than 500 acres are open today, with roughly 300 additional acres in active development as part of a $1.1 billion expansion plan that will eventually bring the total footprint to about 1,347 acres, larger than Central Park in New York.
The scale of what already exists on the ground sets Irvine apart from cities that rank well primarily on neighborhood pocket parks and trail connections. A 194-acre sports complex anchors the eastern end of the Great Park with championship soccer fields, 24 lighted tennis courts, and tournament-grade facilities that draw youth and adult leagues from across Southern California. Citywide, Irvine maintains more than 16,000 acres of parks, sports fields, trails, and dedicated open space, a figure that reflects the city's origins as a master-planned community designed around outdoor access from the start. The next phase of the Great Park will add a 10,000-seat amphitheater, a 12-acre retail and dining center called the Canopy, cultural museums, and lakes, turning a park that already functions as a regional destination into something closer to a self-contained district. For a city of roughly 300,000 residents, the combination of neighborhood-level access and a single flagship park operating at that scale is unusual enough to keep Irvine near the top of the ParkScore rankings year after year.
Mick Haupt / Unsplash
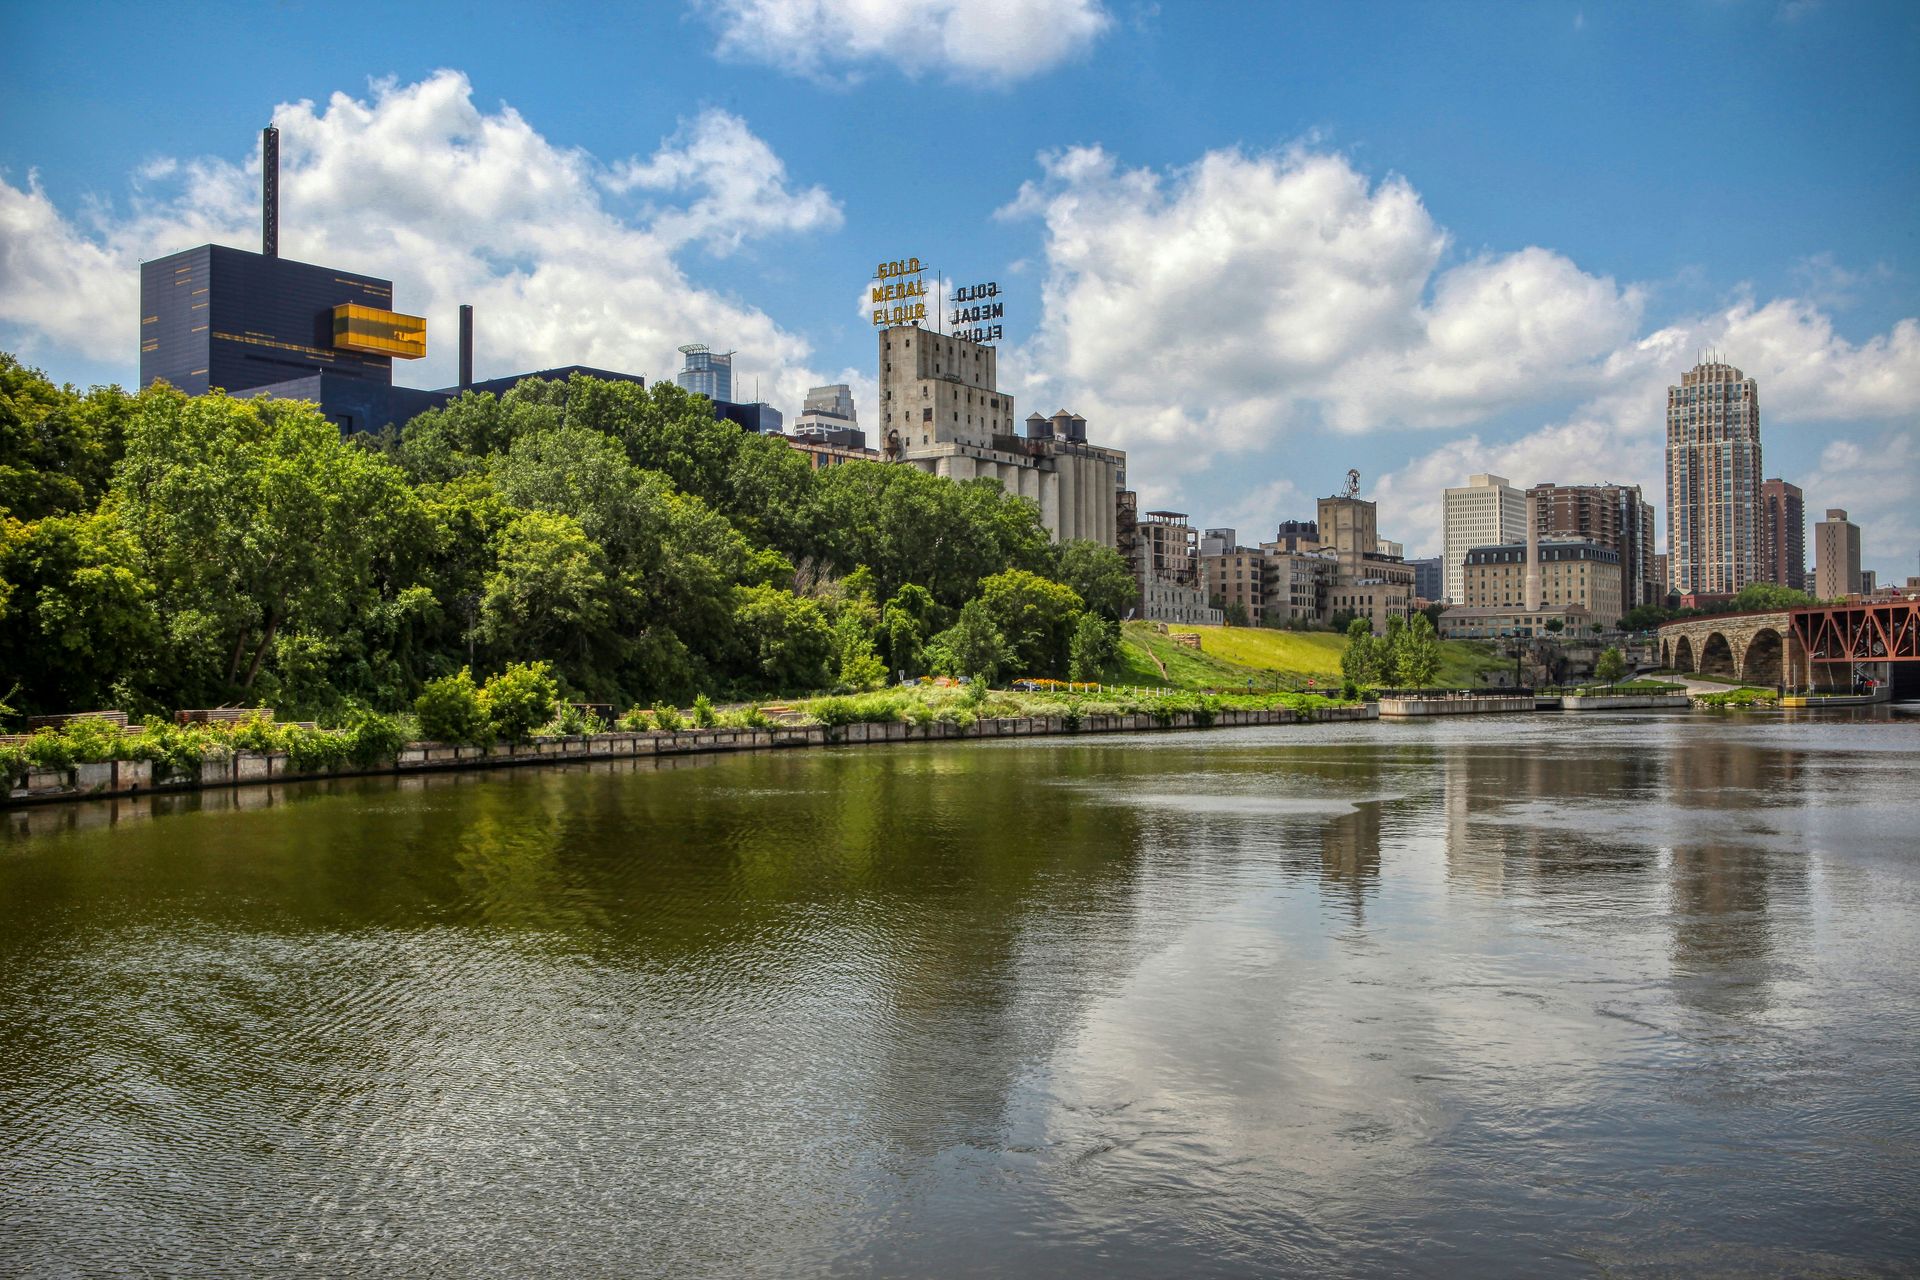
Minneapolis earned the third-highest ParkScore rating in the country at 83.4, continuing a run that has placed the city in the top five for more than a decade. Ninety-nine percent of Minneapolis residents live within a 10-minute walk of a park, a figure that matches only a handful of other cities in the study and sits well above the national ParkScore average of 76%. The city spends $346 per person on its park system, more than double the national average of $154, a figure CBS Minnesota reported in its 2026 coverage of the rankings. Trust for Public Land awarded Minneapolis perfect or near-perfect scores in access, investment, and amenities, and the city's only notable weakness in the index is acreage, where 14% of its land dedicated to parks falls just below the national average of 15%.
The Minneapolis Park and Recreation Board, a semi-autonomous agency with its own elected commissioners and taxing authority, operates the system independently from city government. The structure gives the park board a dedicated revenue stream and insulates its budget from the kind of general-fund competition that forces park departments in other cities to lobby against police, fire, and public works for every dollar. Minneapolis has held the ParkScore's top spot outright in four of the past five years before the current stretch in which Washington, D.C., has pulled slightly ahead, and the margins between the two remain narrow enough that a single new park acquisition or a bump in per-resident spending could flip the order again.
The 99% access figure means that the roughly 4,000 Minneapolis residents who still live outside a 10-minute walk of a park represent the last and hardest gap to close, since the remaining pockets without coverage tend to sit in areas where available land is scarce and acquisition costs are high. Trust for Public Land's mapping data identifies those pockets as priority zones for future park development, but converting them into green space requires either buying out existing property owners or negotiating shared-use agreements with schools and private landowners. The difficulty of that final push is itself a sign of how thoroughly the city has already covered the rest of its footprint.
Matt Reed / Unsplash
St. Paul landed fourth in the 2026 ParkScore index at 83.2, less than a quarter of a point behind Minneapolis and just two points off the national lead. Trust for Public Land gave the city top marks for basketball hoops, making St. Paul the best city in the country for that specific amenity. Ninety-nine percent of St. Paul residents live within a 10-minute walk of a park, matching Minneapolis and placing both Twin Cities well ahead of the national average. The city spends $309 per person on parks, roughly double the national ParkScore average of $154 and enough to rank among the highest-investing cities in the study.
Minnesota is the only state in the country with two cities in the ParkScore top five, a distinction that Trust for Public Land's Minnesota state director, Sophie Harris Vorhoff, has called a reflection of deliberate, sustained commitment at the local level. The two park systems operate independently of each other under separate governance structures, which means the Twin Cities' combined showing isn't the product of a single regional authority splitting credit across two jurisdictions. St. Paul maintains its own parks department, its own budget, and its own amenity priorities, and the basketball-hoop ranking illustrates how those priorities diverge in practice even when the headline scores land within fractions of a point. The proximity of two top-five systems also creates a competitive dynamic that benefits residents on both sides of the river. When Minneapolis adds a splashpad or converts a vacant lot into a community garden, St. Paul's park leadership sees the coverage and feels the pressure to match it, and the cycle runs in reverse just as often. For residents and homebuyers evaluating the Twin Cities metro, the practical takeaway is that either city delivers park access, investment, and amenities at a level that very few places in the country can match.
Jessica Tan / Unsplash
Cincinnati rounded out the top five with a ParkScore rating of 81.2, marking the city's 12th consecutive year inside the national top 10. Trust for Public Land named Cincinnati the best city in the country for playgrounds, awarding a perfect 100-out-of-100 score in that amenity category. The city also earned 100 out of 100 for sports fields, splashpads, and near-perfect marks for recreation centers and restrooms, pushing its overall amenities score to 99 out of 100. Cincinnati invests $259 per person in its park system, a total annual outlay of $81.3 million that has climbed steadily from $190 per person just two years ago, as Cincinnati's parks department noted in its own summary of the results. The spending figure sits well above the national ParkScore average of $154.
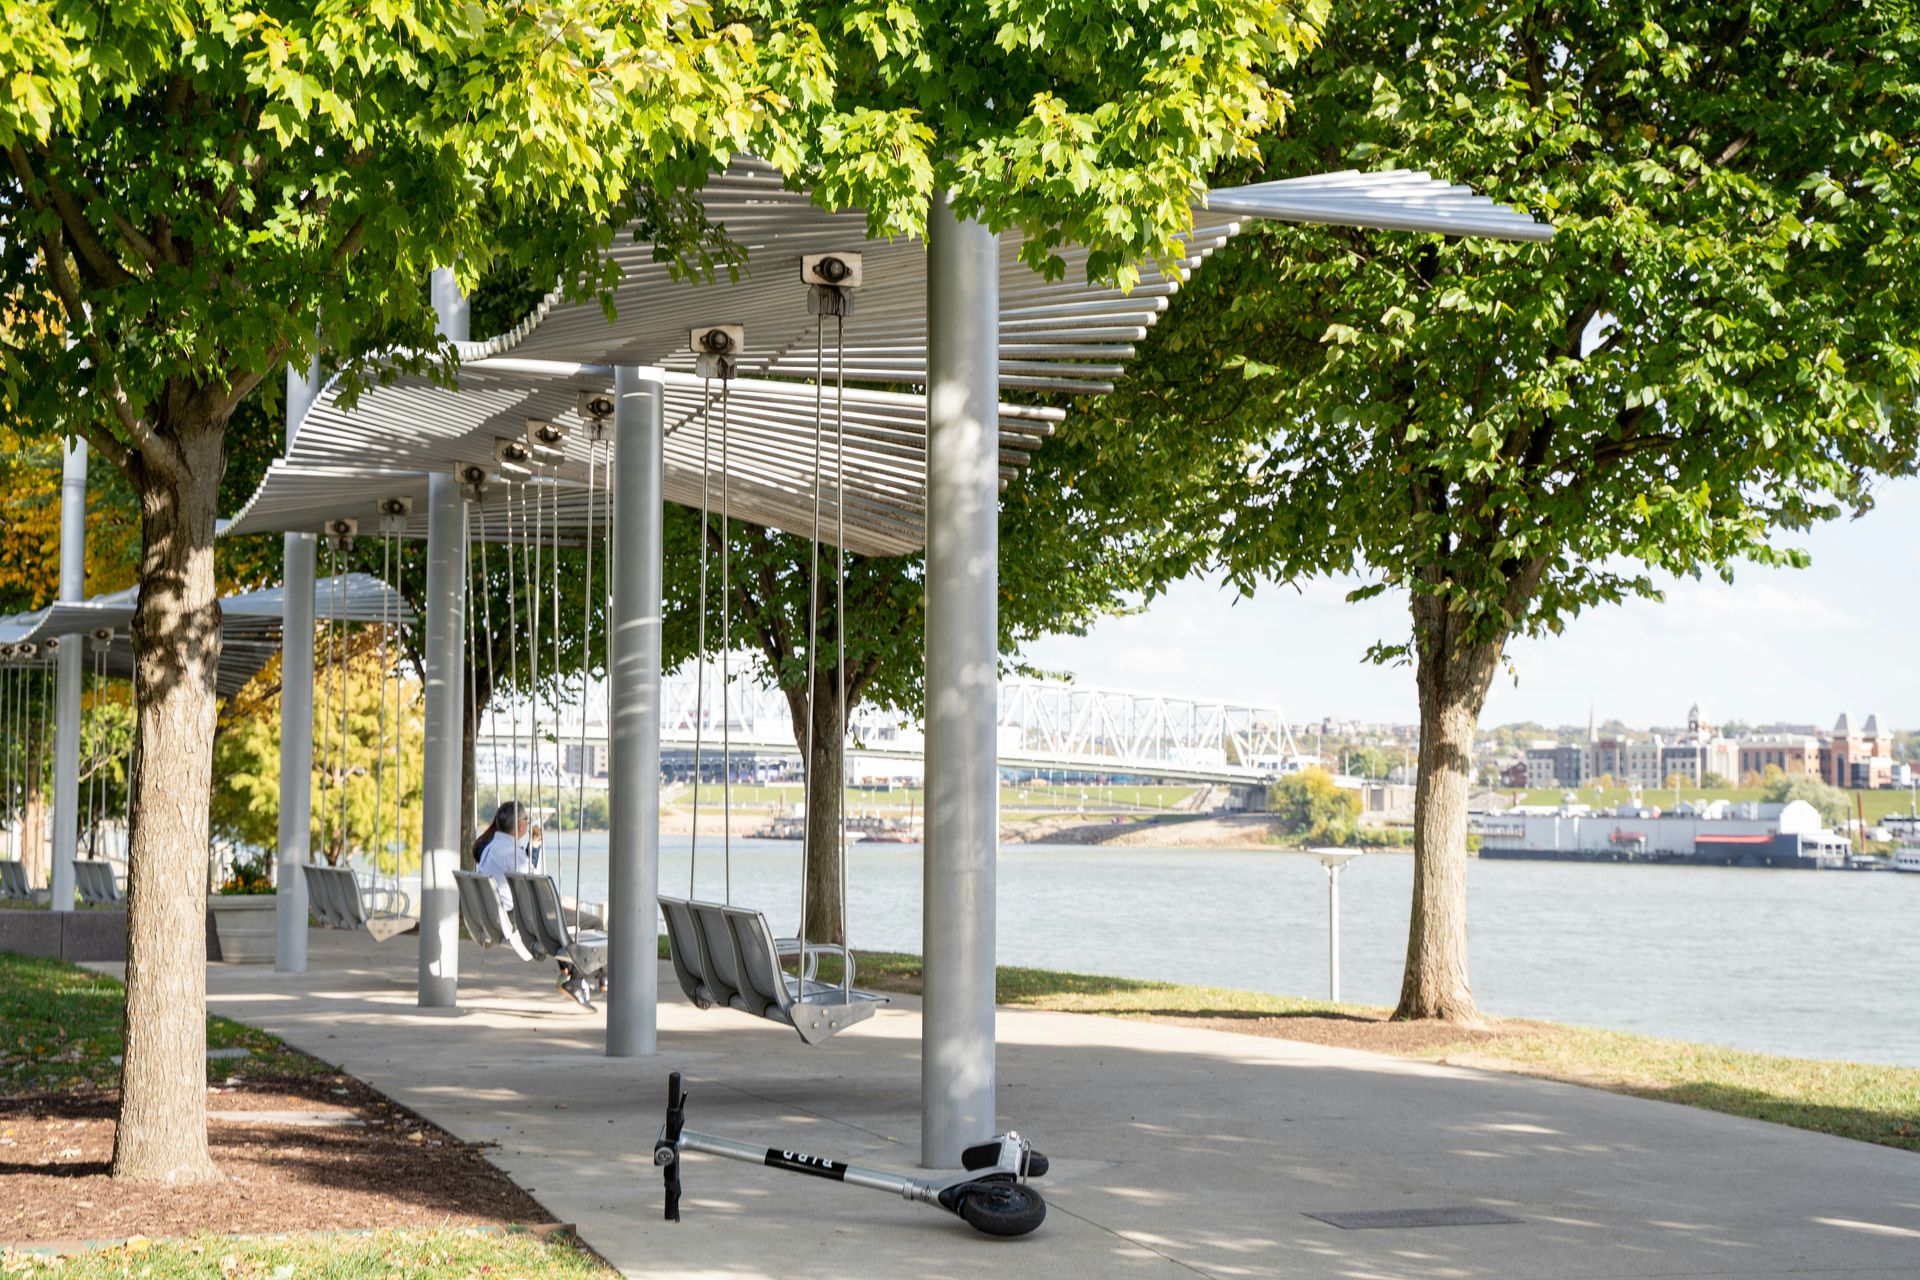
The city maintains roughly 407 parks and natural areas across more than 8,300 acres, and 17% of Cincinnati's total land area is dedicated to parkland. Ninety-one percent of all residents and 91% of low-income families live within a 10-minute walk of a park, a pair of matching figures that reflect the equity dimension Trust for Public Land weighs alongside raw access. Cincinnati's Smale Riverfront Park, which stretches along the Ohio River near the downtown core, has drawn national attention as a model for urban riverfront design, and the broader system includes neighborhood parks spread across the city's hillside neighborhoods in a pattern that dates back more than a century. The playground ranking carries particular weight for families with young children, since it measures not just whether playgrounds exist but how many are available relative to the city's population. Scoring a perfect 100 in that category means Cincinnati offers more playground access per resident than any other city among the 100 evaluated, a distinction that translates directly into everyday convenience for the parents and caregivers who use those spaces most.