Living in the right place makes staying healthy far easier. WalletHub ranked 182 U.S. cities to find the healthiest and unhealthiest in 2026

fintastique / Getty Images
Doctors advise patients to eat well, exercise, and get regular checkups. Whether residents follow that advice depends in large part on where they live. Cities that invest in parks, healthy food access, and walkable streets give residents structural support that willpower alone cannot replicate. A city that neglects those investments places the full burden of staying well on individuals, many of whom face cost barriers, long commutes, and food environments that work against them. People form habits within the constraints a given city creates, and where someone lives shapes their health odds in ways that compound across decades.
Researchers who study U.S. city health rankings find a geographic divide sharper than most observers expect. The highest-scoring cities cluster on the West Coast, and the lowest-scoring cities concentrate in the South and along the Texas border. The gap between those two groups appears across every dimension the rankings measure. Cities at the top pull nearly every indicator — high physical activity rates, dense healthy food access, quality green space, affordable health care, and well-insured populations — in the same direction at once. Cities at the bottom underperform across all those dimensions simultaneously, leaving residents with few structural supports for staying well in any area of daily life.
To measure those conditions at scale, WalletHub ranked 182 U.S. cities — the 150 most populated, plus at least two from every state — across Health Care, Food, Fitness, and Green Space dimensions. Analysts applied 41 metrics, weighted and scored on a 100-point scale, then averaged them into a total score. Every metric measured the city proper, not the surrounding metro area.

xavierarnau / Getty Images
San Francisco earned the top overall spot with a total score of 70.41. The city finished more than five points ahead of second-place San Diego. Nearly every dimension of the ranking points to the same advantage: San Francisco makes healthy choices structurally easy for residents at every income level.
Obesity rates in San Francisco sit at roughly 18% of the adult population, the second-lowest figure in the country. Residents eat relatively well: San Francisco tied for the second-lowest share of adults who consume fewer than one serving of fruits or vegetables per day. Every resident lives within reasonable distance of a location where they can engage in physical activity. No other large U.S. city matches its 100% physical-activity-access rate.
The city spends more per capita on parks and recreation than every other major U.S. counterpart except one. Residents use well-maintained trails, green spaces, and recreational facilities throughout the week. San Francisco also ranks among the most walkable and bikeable cities in the country, so residents accumulate exercise during ordinary daily errands — commutes, grocery runs, and neighborhood trips — without dedicating separate time to formal workouts. Active transportation functions as a built-in fitness routine for a large share of the city's working population.
San Francisco ranks among the top cities nationally for healthy restaurants per capita and scores well for vegetarian and gluten-free options. Residents looking for fresh produce have multiple avenues. The city's food rank of third overall reflects high-scoring metrics across every food-related dimension the study measured. Accessible outdoor space, walkable streets, and plentiful nutritious food provide structural conditions for staying well at a level most U.S. cities do not match. Few cities sustain advantages of this depth and consistency across all four dimensions simultaneously.

David Toussaint / Getty Images
San Diego finished second overall, with a total score of 65.19. The city's strong wellness performance throughout the year owes much to its robust infrastructure for fitness and fresh food options, and residents draw on it consistently.
San Diego ranks 10th nationally for healthy restaurants per capita, giving residents ample options for nutritious meals. Obesity rates sit at the 13th-lowest level in the country, reflecting a population that consistently works out and eats nutritious food. Weight loss centers rank 11th in per capita numbers, pointing to a strong commercial infrastructure for residents seeking fitness support beyond self-directed exercise. The depth of available wellness services shows sustained resident demand for fitness resources across the city's neighborhoods.
San Diego ranks seventh for farmers' markets per capita, giving residents regular access to locally grown produce. A rich supply of farmers' markets connects household diets directly to local agriculture and keeps fresh food accessible in neighborhoods where supermarkets are limited or expensive. Outdoor recreation deepens the fitness profile. The city ranks sixth for hiking trails per capita, and residents use them consistently. Scenic coastal and backcountry terrain creates strong incentives for outdoor activity, and the data reflect high participation rates across the population.
San Diego's fitness rank of third and green space rank of fourth reinforce each other. Residents have access to quality parkland and well-maintained outdoor recreation, and they live in a climate that permits year-round activity. High trail density, plentiful farmers markets, and abundant healthy restaurants give residents multiple overlapping options for sustained wellness. The ranking reflects all of them operating at once. Very few U.S. cities score consistently near the top across all four dimensions simultaneously, and San Diego's second-place finish reflects broad consistency across every category the study evaluates.
Jordan Siemens / Getty Images
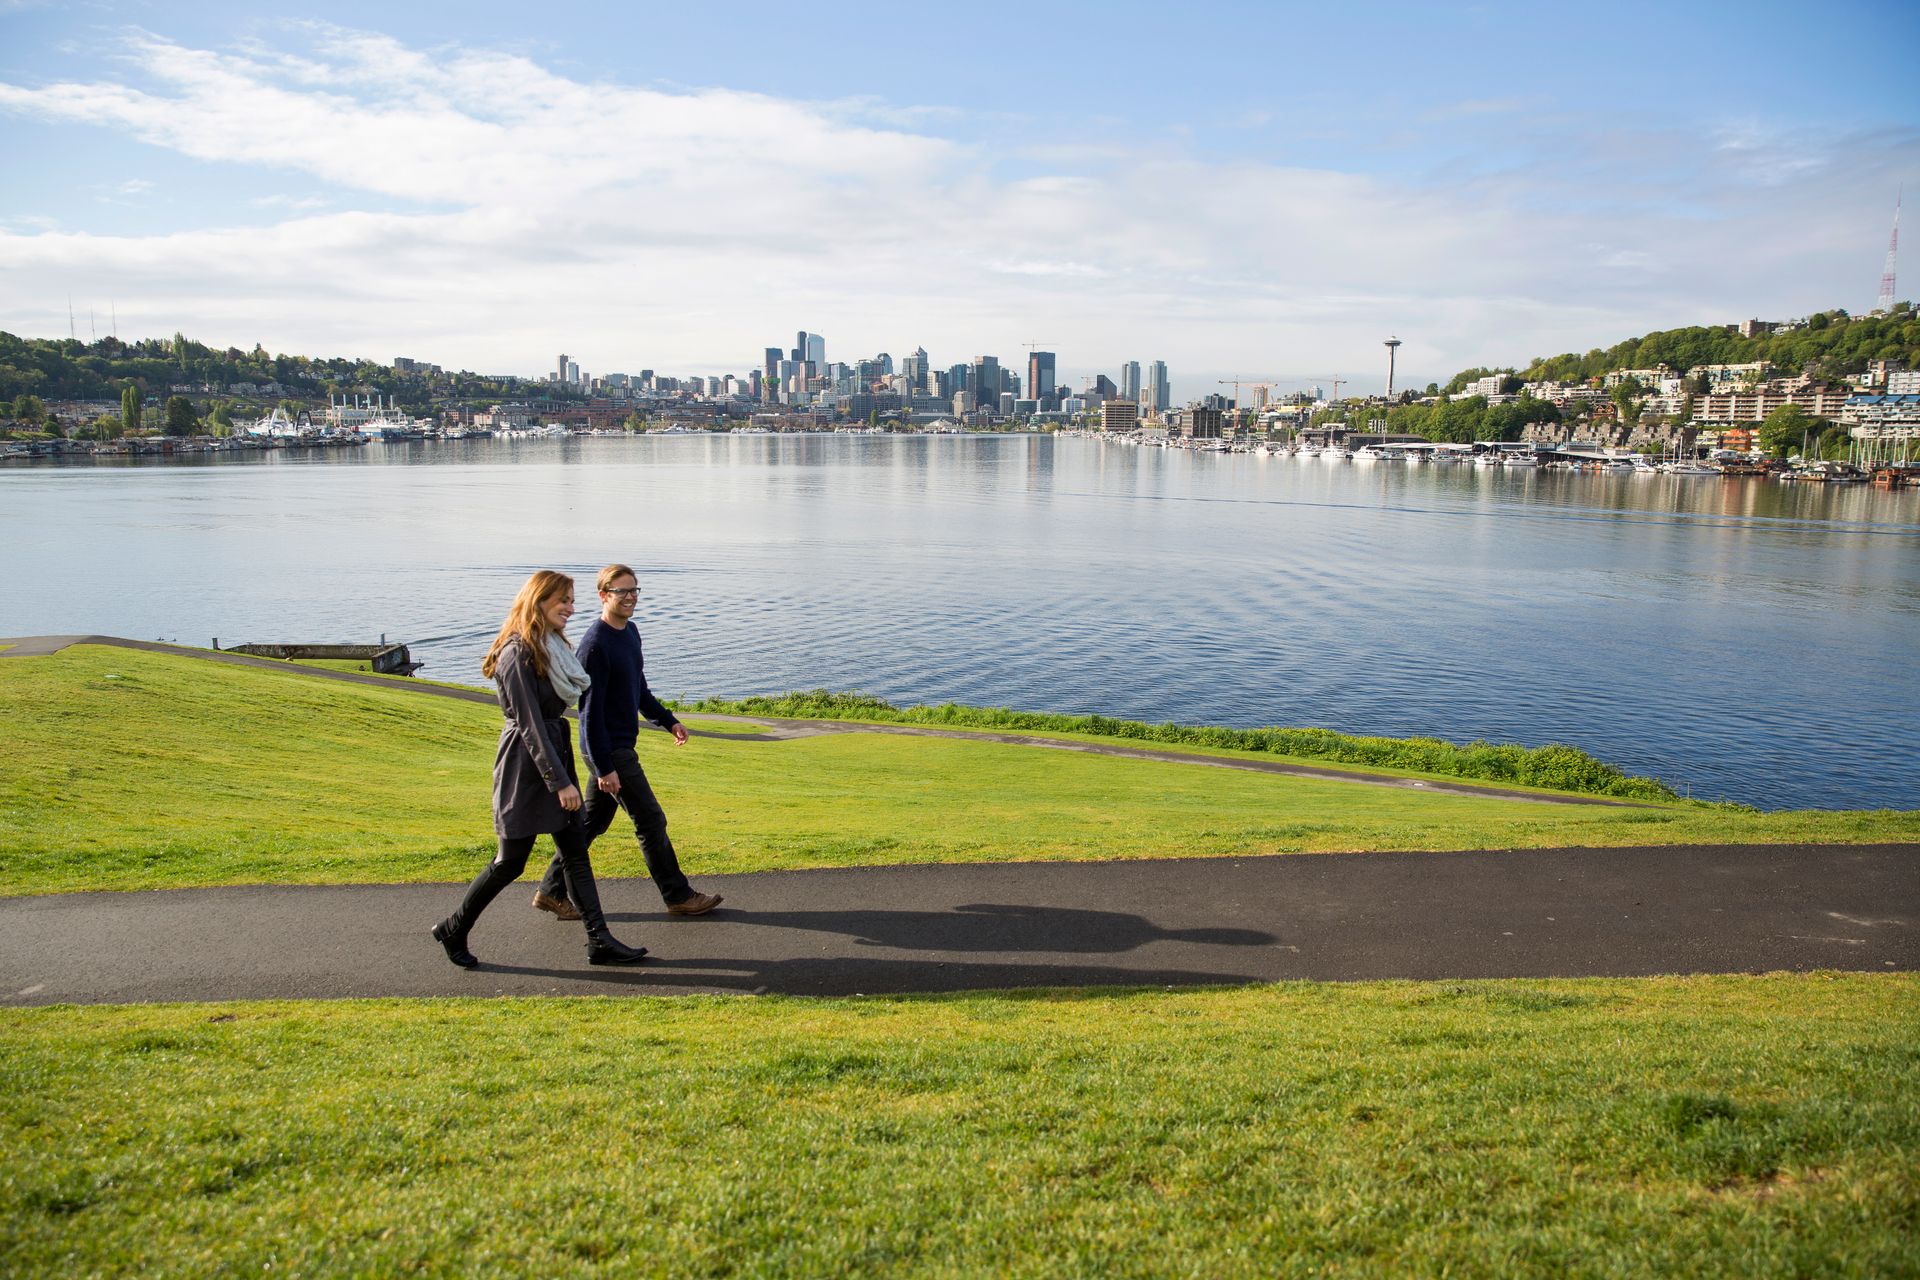
Seattle ranked third overall, with a total score of 63.57. Its most measurable advantage is participation: 87% of Seattle adults engaged in physical activity in the past month, the highest rate of any U.S. city in the entire study.
Parks and recreation spending per capita in Seattle ranks among the highest nationally. Well-funded public spaces give residents accessible venues for daily exercise, and maintained trails, parks, and recreational facilities distributed across the city ensure that proximity is not a barrier most residents face when deciding whether to be active. Residents who have accessible parks and maintained trails exercise more. That explains why Seattle's participation rate runs so far ahead of the national average and why that lead persists year over year.
Seattle residents search Google $GOOGL for food-related terms — "healthy dinner ideas," "healthy snacks," and similar queries — more than people in most other cities. The city's food rank of seventh overall reflects both strong resident demand for nutritious food and sufficient supply to meet it. Grocery stores, farmers' markets, and healthy restaurants are plentiful enough that residents can act on their dietary goals without difficulty. Sustained search interest in healthy food tends to track with actual dietary choices, so the search data reinforces what the consumption metrics confirm.
Seattle ranks among the greenest cities in the country, reflecting high air quality, sustainable transportation, and green infrastructure beyond just park acreage. Residents who breathe cleaner air face lower respiratory health risks and find outdoor activity more appealing and more beneficial. The city's investment in environmental quality, physical infrastructure, and park access produces a reinforcing cycle: better conditions drive higher participation, and a physically active population tends to sustain political and financial pressure for continued investment in the infrastructure that makes that participation possible.

DenisTangneyJr / Getty Images
Brownsville, Texas, ranked 182nd overall — last in the country — with a total score of 24.34. Its fitness scores anchor that standing: Brownsville ranks 182nd nationally for the share of physically active adults, making its population the least physically active of any major U.S. city.
Brownsville ranks 181st for healthy restaurants per capita, leaving residents with almost no nearby options for nutritious dining. Its food rank of 172nd overall reflects consistent underperformance across fruit and vegetable consumption, healthy food access, and diet-related measures the study tracks. Residents who want to eat well face a scarcity of options, and that scarcity makes maintaining sound dietary habits considerably harder than in cities where nutritious food is plentiful and affordable.
Brownsville ranks 182nd in overall health care, meaning residents face the worst conditions in the country across multiple care-related dimensions. Insurance coverage rates, preventive care visits, physician availability, and dental access all fall well below the national average. Low insurance rates reduce the frequency with which residents seek care before problems become serious, and limited provider availability makes accessing that care harder even for insured residents. Preventive medicine works best when residents visit providers regularly, but insurance barriers and provider scarcity undermine that possibility in Brownsville.
Brownsville ranks 172nd in green space, and residents have limited access to parkland and outdoor recreational opportunities. Residents in Brownsville who need parks, healthy food, and adequate health care find virtually every structural support absent or severely restricted. Brownsville's last-place finish is not attributable to a single deficiency. Residents face near-bottom scores across all four dimensions the study measures, leaving them with few resources to draw on in any direction. No single policy change would move the city's overall standing by much.
DenisTangneyJr / Getty Images
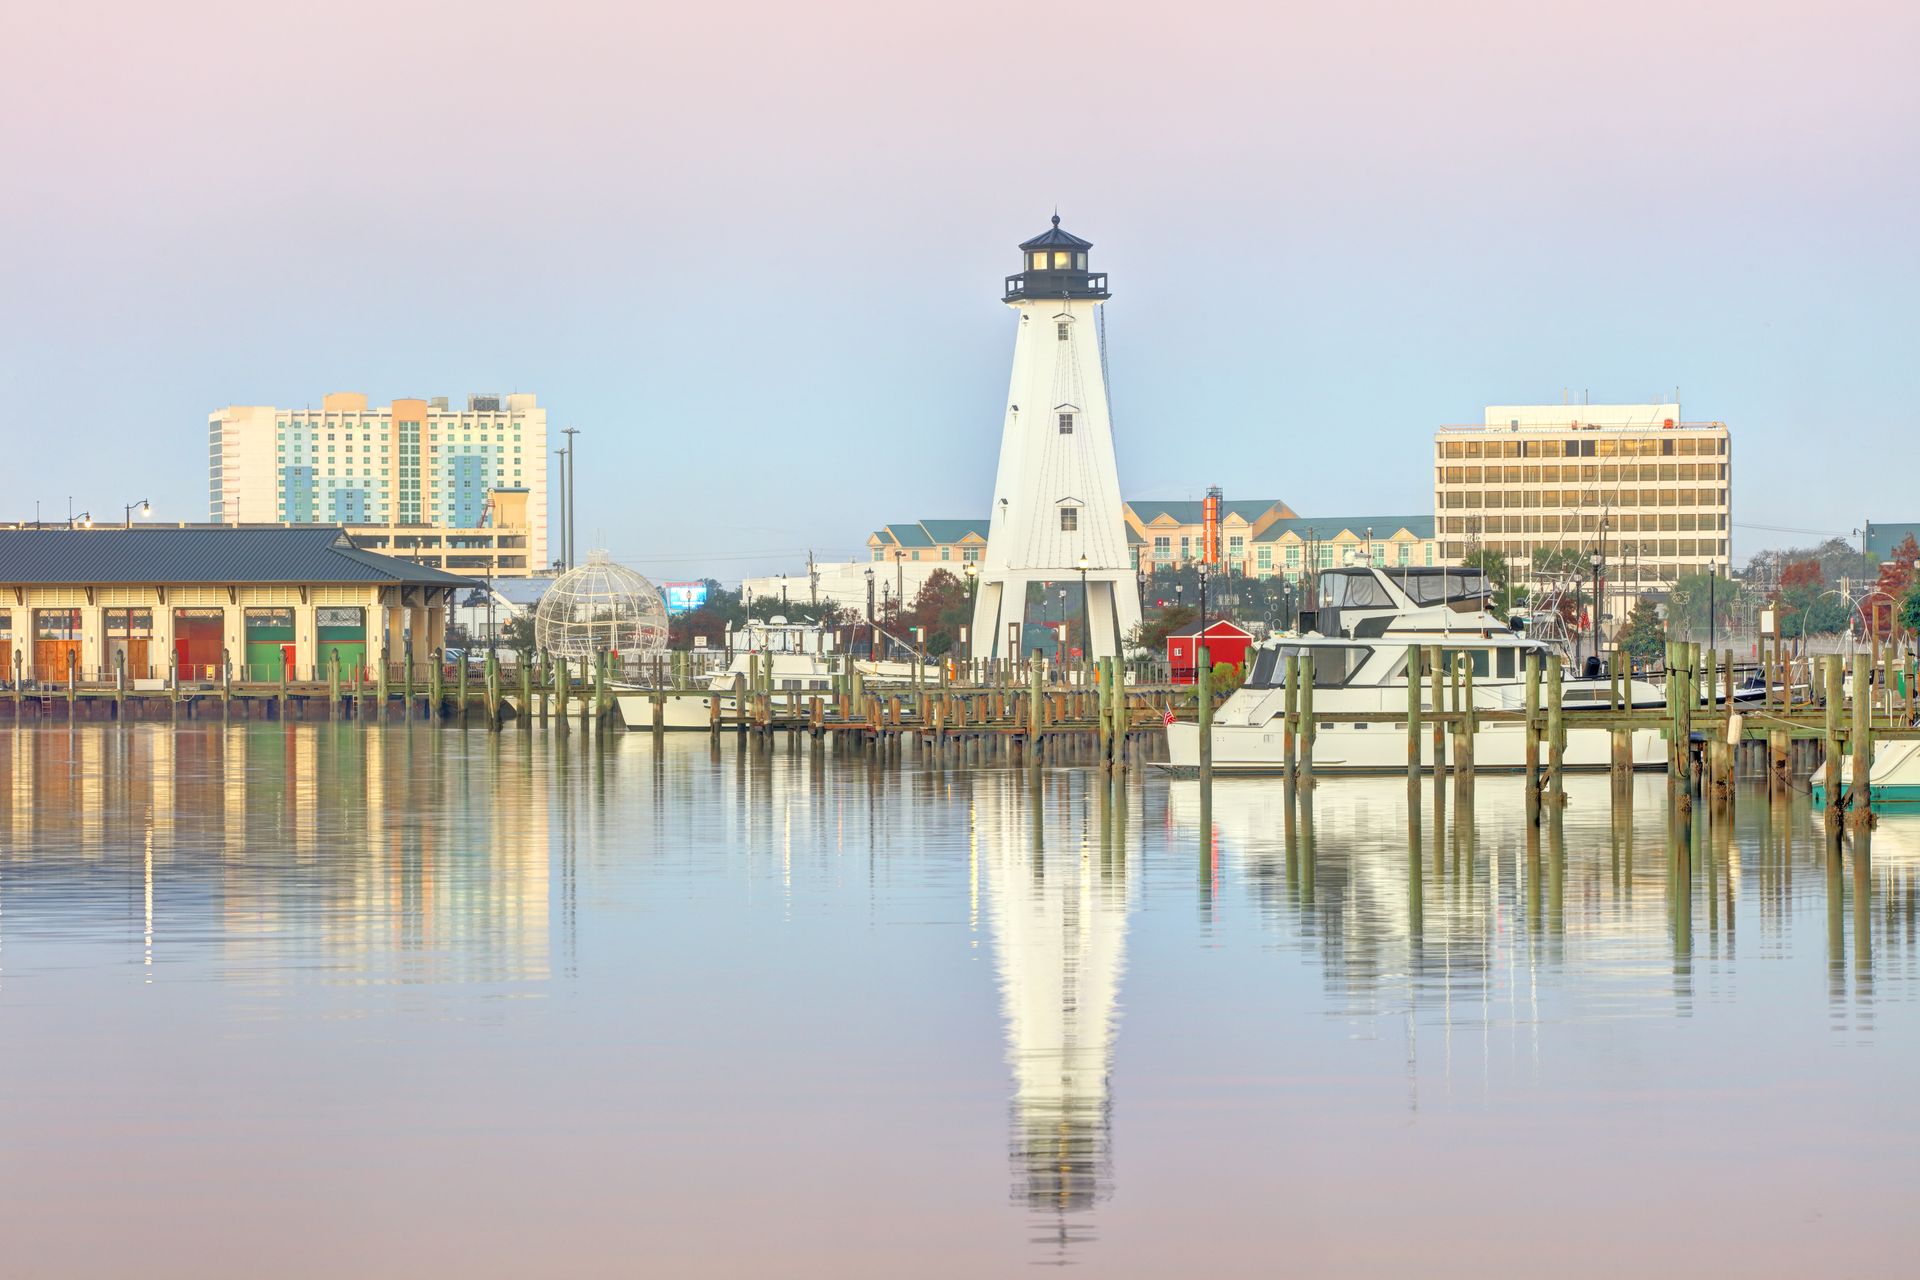
Gulfport, Mississippi, ranked 181st overall, with a total score of 25.60. Its scores across multiple dimensions are self-reinforcing. Residents in Gulfport face limited fitness access, scarce healthy food, and poor green space all at once. People who contend with deficiencies across all three areas find them compounding each other, leaving few structural supports for staying well.
Physical activity among Gulfport adults is the third-lowest in the country. Cost, access, and infrastructure barriers to exercise are among the most severe in the nation, and the low participation rate reflects all of them. Gulfport also ranks 175th for dietitians and nutritionists per capita, leaving most residents without practical access to professional nutrition guidance. People looking to change their eating habits or manage a diet-related condition find the lack of accessible professionals a concrete, daily obstacle with no easy workaround at current resource levels.
Gulfport ranks 139th for the share of adults consuming fewer than one serving of fruits or vegetables per day, well below the national average. A particularly high proportion of residents fall short of basic nutritional benchmarks on that measure. Healthy restaurant density compounds the problem: Gulfport has limited practical alternatives for nutritious dining, and the city's food rank of 180th reflects persistent shortfalls across multiple food-related indicators the study measures. Residents who want to improve their diets face scarce options for doing so.
Gulfport ranks 181st for green space overall, meaning residents have access to very little quality parkland per capita. Residents who lack parks exercise less, and cities where few people exercise tend to invest less in parks. Each condition feeds the other. Residents in Gulfport contend with deficient food access, scarce fitness resources, and near-absent green space all at once. That explains why the city's total score places it second-to-last in the country and why improvement in any one area would not, on its own, move the overall figure much.

fitopardo / Getty Images
Laredo, Texas, ranked 180th out of 182 cities, with a total score of 27.68. Its food rank of 177th is the lowest of the three bottom-ranked cities, reflecting deficits in healthy food access that compound every other dimension.
Residents in Laredo find very few healthy restaurant options. The city ranks 174th for healthy restaurants per capita. Nutrition professionals are nearly as scarce: Laredo ranks 181st for dietitians and nutritionists per capita, the second-lowest figure in the country. The gap between the best- and worst-served city on that metric is fivefold. Mental health counselors are equally sparse. Laredo ranks 181st nationally for mental health counselors per capita, sharing the second-lowest position in the country on that measure and leaving most residents without nearby access to behavioral support.
Laredo adults are the second-least physically active in the U.S. Only last-ranked Brownsville reports lower exercise participation rates. Residents in cities near the bottom for physical activity tend to live far from parks, trails, and recreation centers, or find those facilities too costly or inconvenient to use regularly. Residents who face long distances or high costs use those facilities less, and participation drops as a result. Laredo's green space rank of 149th confirms that outdoor recreational infrastructure is thin relative to the city's size and population. Residents seeking walkable routes or accessible trails encounter fewer options than people in most other large U.S. cities.
They face a compounding set of disadvantages: low physical activity, scarce nutrition professionals, limited healthy restaurant options, and poor mental health counselor access all work against sustained wellness. People who fall short in one area find it harder to compensate in another. A resident with no nearby healthy restaurant and no access to a dietitian faces obstacles that no single improvement would resolve. Laredo's scores suggest those obstacles are widespread across the city's population, not concentrated in particular neighborhoods.
