
These 10 large U.S. cities saw the biggest 10-year increase in home prices
Home values in some large U.S. cities more than doubled in 10 years. Construction Coverage analyzed Zillow data to rank nearly 700 locations
Ela108 Garwacka-Goralik / Unsplash
American home prices didn't just rise over the past decade. They outran the paychecks meant to cover them. Between 2016 and 2026, the typical U.S. home gained more than 81% in value, while average hourly earnings grew just 47% over the same stretch. That gap produced a generation of homeowners sitting on windfalls they didn't anticipate and a generation of aspiring buyers locked out of neighborhoods their parents entered without a second thought. The squeeze isn't evenly distributed, and it isn't concentrated where most people assume. Coastal markets that dominated housing headlines for years, places such as San Francisco and Oakland, posted some of the slowest appreciation in the country over this period, each gaining barely more than 14%. The cities that experienced the most dramatic run-ups are largely Rust Belt and mid-South metros that started the decade with some of the lowest price floors in the nation.
The gap between home price growth and wage growth goes a long way toward explaining why affordability has deteriorated even in cities that remain cheap by national standards. A home in Detroit still sells for a fraction of one in Charlotte, but the owner who bought at the 2016 price paid with 2016 wages. Today's buyer earns roughly 47% more in hourly terms but faces a home valued 81% higher, and that's before factoring in mortgage rates that have more than doubled from their 2021 lows. The Federal Reserve's benchmark actions since 2022 pushed the 30-year fixed rate above 6%, which means monthly payments on the same-priced home are hundreds of dollars higher than they were just a few years ago. Elevated inventory in Sun Belt cities such as Tampa and Jacksonville has softened prices in those markets over the past year, but Midwest metros with tighter supply, such as Milwaukee and Columbus, remain competitive, with homes going under contract in as little as a week.
Construction Coverage analyzed Zillow Home Value Index data for nearly 700 U.S. cities, comparing median home values in March 2016 to March 2026 and sorting the results by percentage change. The firm also calculated income growth over the same period using U.S. Census Bureau data, giving each city's appreciation a paycheck-adjusted context. Researchers grouped results by population size, and the rankings below draw from the "large city" cohort, defined as cities with more than 350,000 residents. Nine of the 10 cities on this list saw their home values more than double in a decade. The 10th, Jacksonville, fell just short at 99.6%. Every one of them remains well below the national median home value of roughly $370,000, and none are in the Northeast or on the West Coast.
Detroit
Jameson Draper / Unsplash
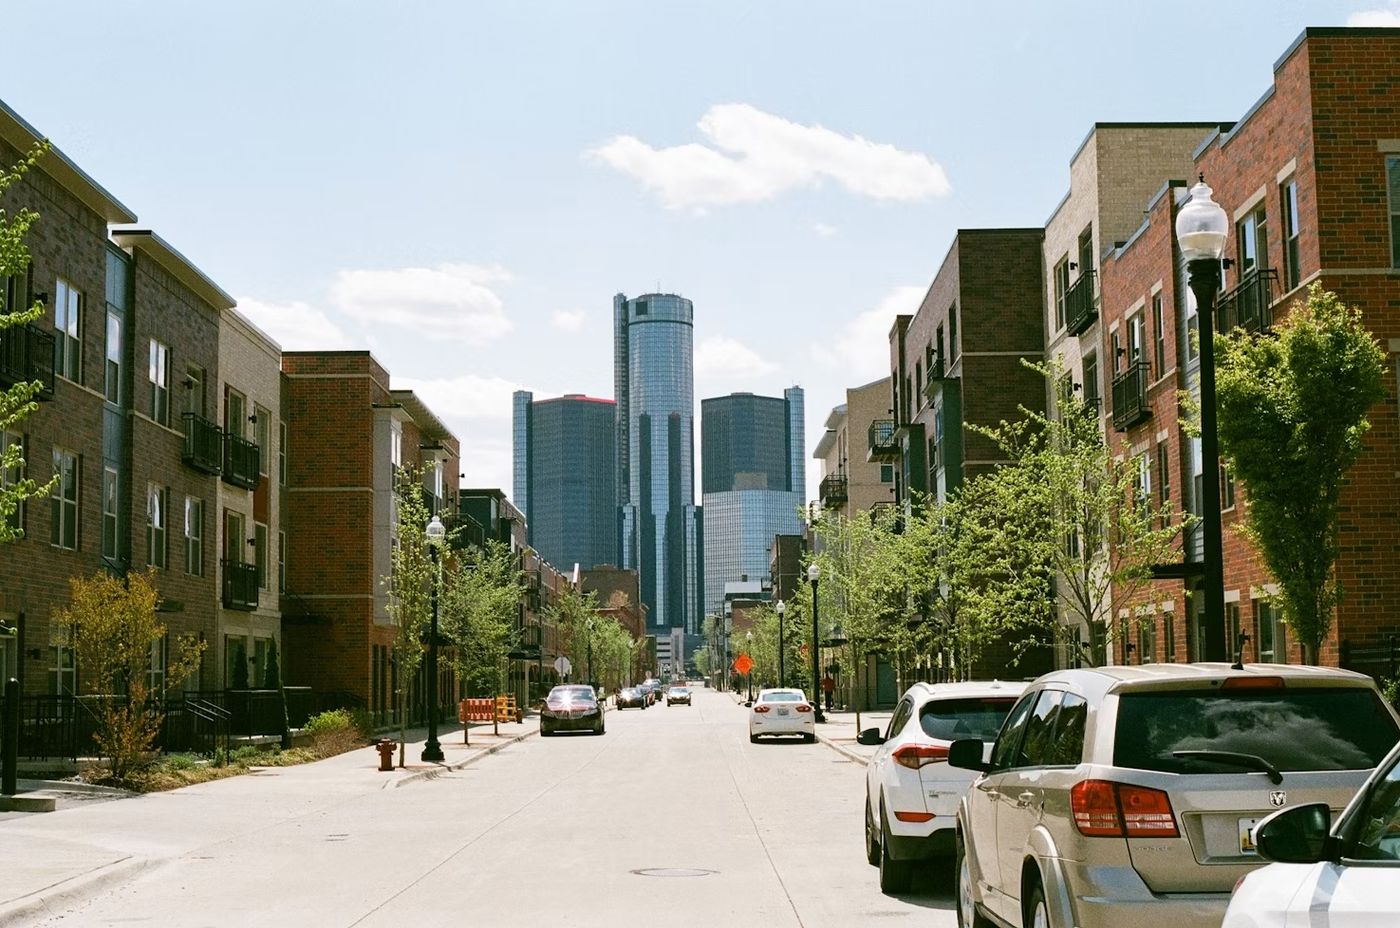
Detroit tops the Construction Coverage ranking with a 138.7% increase in median home value from March 2016 to March 2026, a gain that looks enormous in percentage terms but starts from one of the lowest price floors of any major American city. A typical Detroit home was worth approximately $32,000 in 2016, and by March 2026, that figure had climbed to roughly $75,000. Even after that run-up, the Zillow Home Value Index for the city proper sits at $77,245, barely one-fifth of the national average and far below any other city on this list.
The percentage gain reflects the math of starting near bottom rather than the arrival of a luxury market. Detroit's housing stock was hammered harder by the foreclosure crisis than almost any other major city, with the median home value falling below $30,000 in some post-recession years. The recovery since then has been powered by a combination of institutional investor activity, city-led land bank programs that cleared thousands of blighted parcels, and organic demand from buyers who recognized that Detroit's housing prices had overcorrected. Neighborhoods such as Corktown and Midtown have drawn significant renovation capital, and Corktown's Zillow home value now sits near $485,000, more than six times the citywide figure.
The broader market, however, is cooling. Zillow reports the city's home values declined 5.1% year over year as of mid-2026, and Redfin data shows homes spending an average of 48 to 54 days on the market before going under contract. The median sale price on Redfin sits around $100,000 to $105,000, higher than the Zillow index because Redfin captures transaction prices rather than estimated values for the full housing stock. Detroit remains the most affordable large city in the Construction Coverage study by a wide margin, and the gap between its price level and its appreciation rate tells a clear story about a market that rebounded dramatically from a historically low base without actually becoming expensive.
Milwaukee
Nils Huenerfuerst / Unsplash
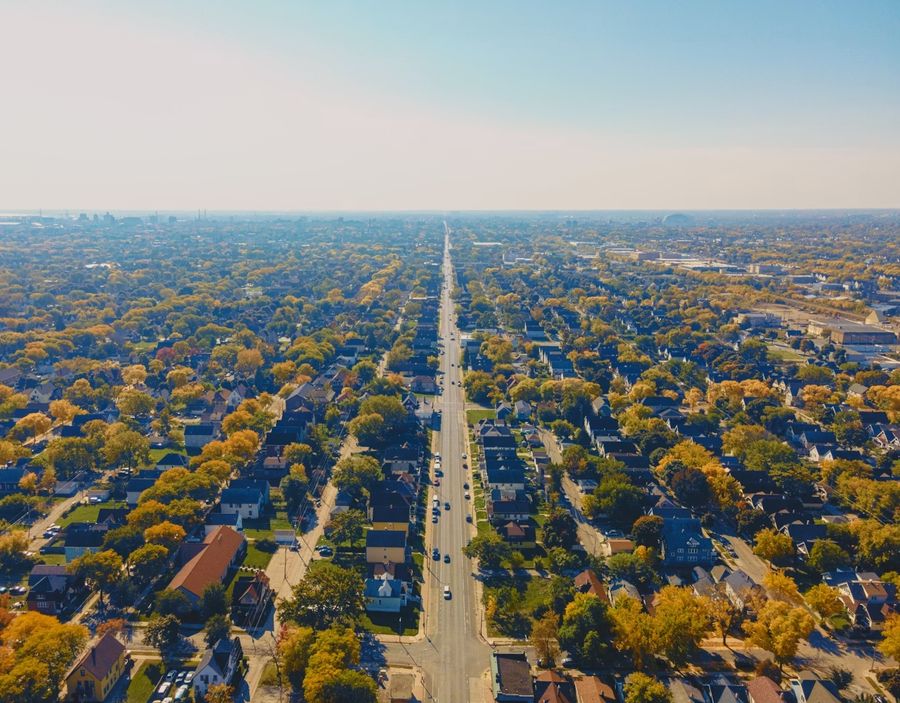
Milwaukee's 138.0% appreciation rate over the past decade lands it just behind Detroit in the Construction Coverage rankings, but the two cities look nothing alike in practice. The Zillow Home Value Index for Milwaukee stands at $195,368, up 6.8% year over year, and the city's median sale price has been running between $235,000 and $243,000 in recent months. A typical Milwaukee home was worth approximately $82,000 in 2016, and the gain since then reflects steady demand in a market where new construction hasn't kept pace with population stability and in-migration from higher-cost metros.
Zillow named Milwaukee one of its 10 hottest housing markets for 2026, a jump from 42nd place the prior year and the only Midwest city to make that list. The designation reflects a tight inventory picture. Homes in Milwaukee go pending in as little as 15 days, and the Realtor.com ranking for the metro placed it eighth nationally, projecting 3.5% price growth and 7% sales growth for the year. Nearly 44% of homes sold above asking price in spring 2026, up from 33% the prior year, and the share of listings with price reductions fell from 54% to 40% over the same period.
What makes Milwaukee's appreciation stand out is that it happened in a city that was losing housing value as recently as the mid-2010s. The Construction Coverage data captures a full reversal, from post-recession stagnation to one of the fastest-rising large-city markets in the country. The metro area's four-county median reached $370,000 in April 2026, putting it in line with the national average for the first time. Healthcare, manufacturing, and financial services anchor the employment base, and the combination of a diversified economy with a housing stock that remains accessible by coastal standards has made Milwaukee a draw for buyers priced out of Chicago and Minneapolis. A 2024 analysis ranked Milwaukee second nationally for lowest housing supply per capita, and that structural constraint has kept upward pressure on prices even as other Midwest markets cooled.
Tampa Bay
Edgar Cotto / Unsplash
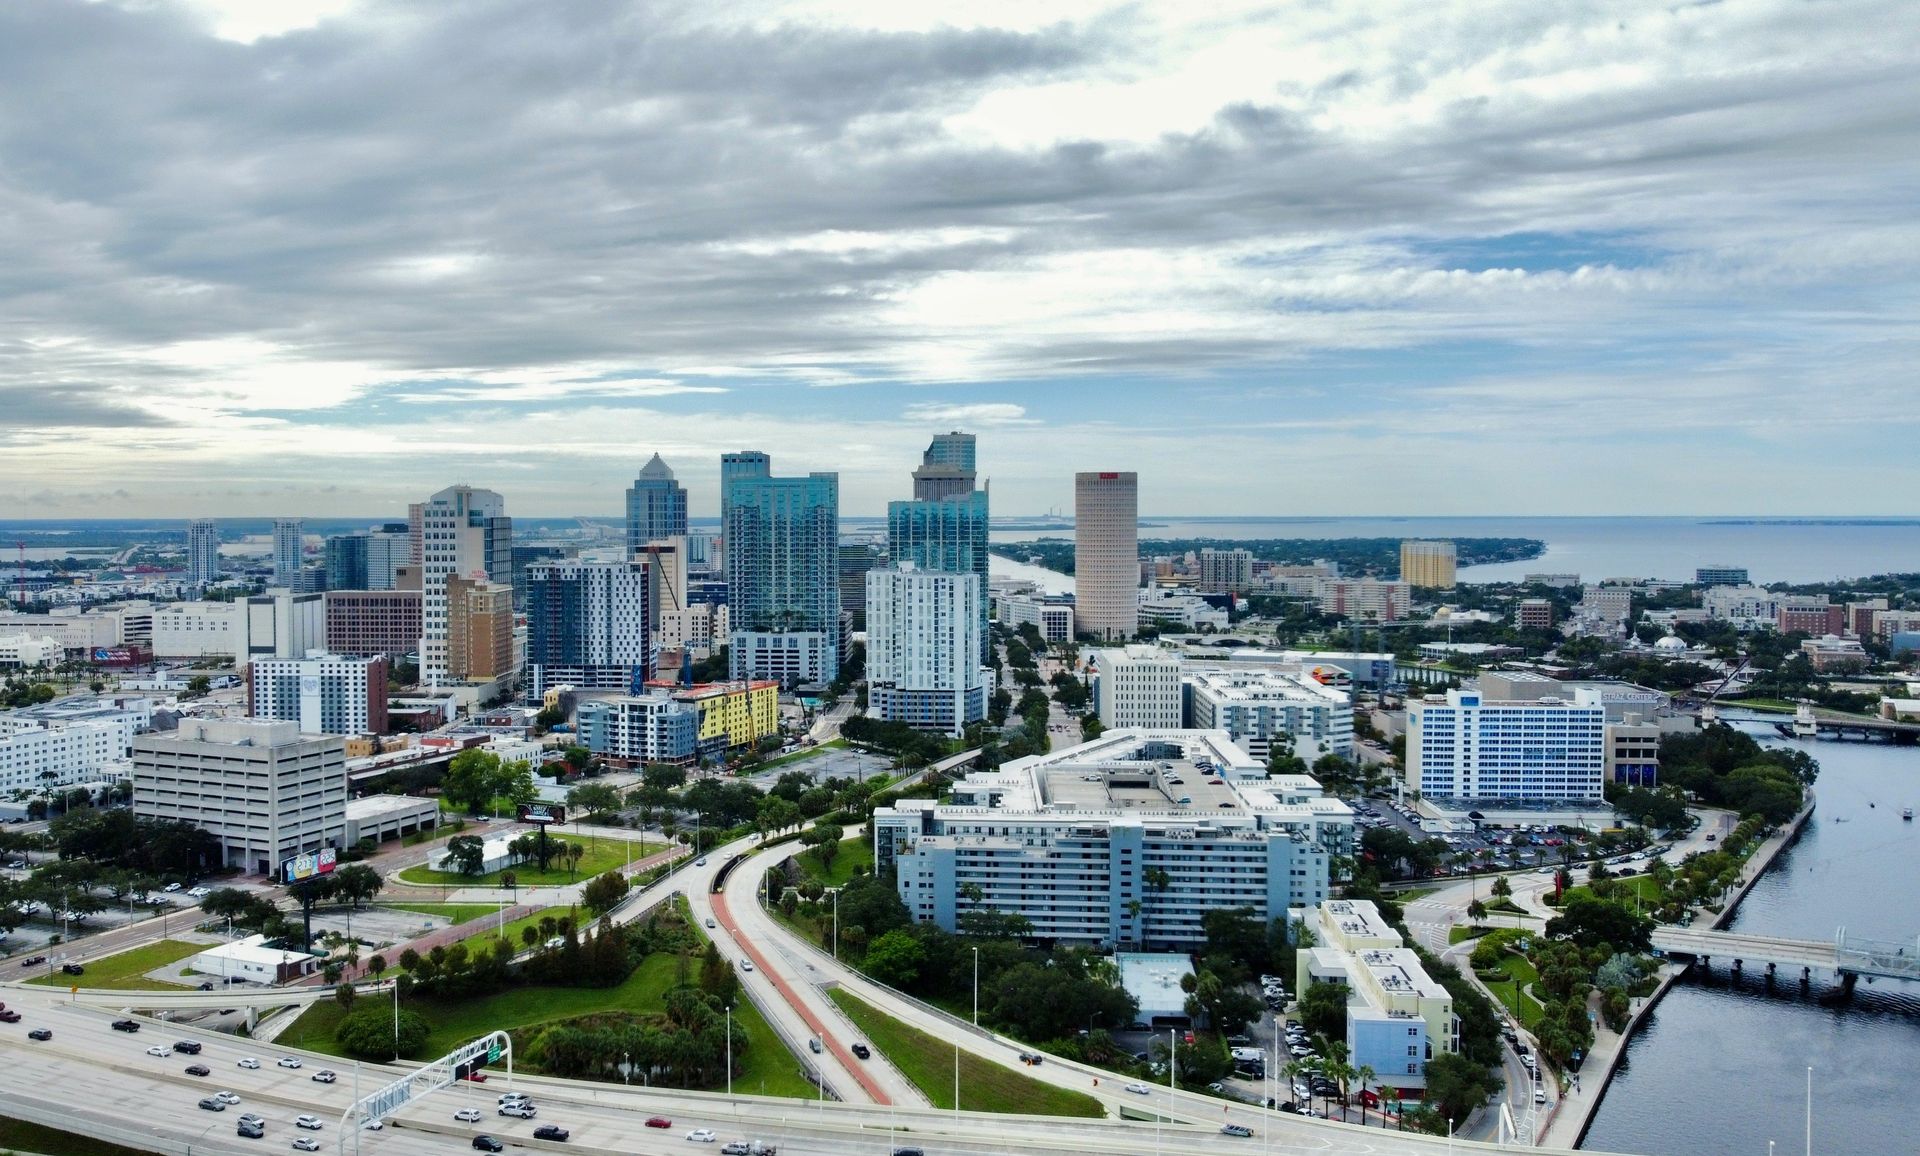
Tampa's 121.3% price increase over the decade reflects one of the most dramatic boom-and-correction cycles of any large U.S. city. The Zillow Home Value Index for Tampa sat at approximately $170,000 in March 2016, driven by years of slow recovery from the 2008 foreclosure wave that hit Florida harder than almost any other state. By March 2026, that figure had climbed to roughly $376,000, more than doubling in a span shaped largely by the pandemic-era migration surge that brought remote workers and retirees south in record numbers.
The correction is now well underway. Construction Coverage's 10-year snapshot captures the full run-up, but Zillow data as of mid-2026 shows Tampa home values declining 4.2% year over year, and the broader Tampa-St. Petersburg-Clearwater metro is down more than 5%. Active residential listings have reached a multi-year peak, and the market has tipped decisively in favor of buyers. Homes sit on the market for roughly 38 days before going pending, up from the teens during the frenzied 2021 and 2022 stretch, and Realtor.com's 2026 forecast projects further price declines of around 3.6% for the metro through the rest of the year. Rising home insurance premiums, which have made Florida one of the most expensive states for coverage, have added a cost layer that wasn't part of the equation when many of these buyers entered the market.
Tampa's trajectory captures a pattern that shows up across several cities on this list. The decade's appreciation was real, and anyone who bought in 2016 is still up significantly, but the pace of the last two years has been a sharp reversal from the growth that preceded it. Zillow ranked Tampa among its most buyer-friendly markets for 2026 alongside Indianapolis and Charlotte, a signal that the affordability window these cities lost during the pandemic rush hasn't fully closed but is being pried back open by rising inventory and softening demand. The median sale price for single-family homes in the Tampa Bay area hovers near $400,000 in mid-2026, and the gap between that figure and the listing price continues to widen.
Indianapolis
Gabe Pierce / Unsplash
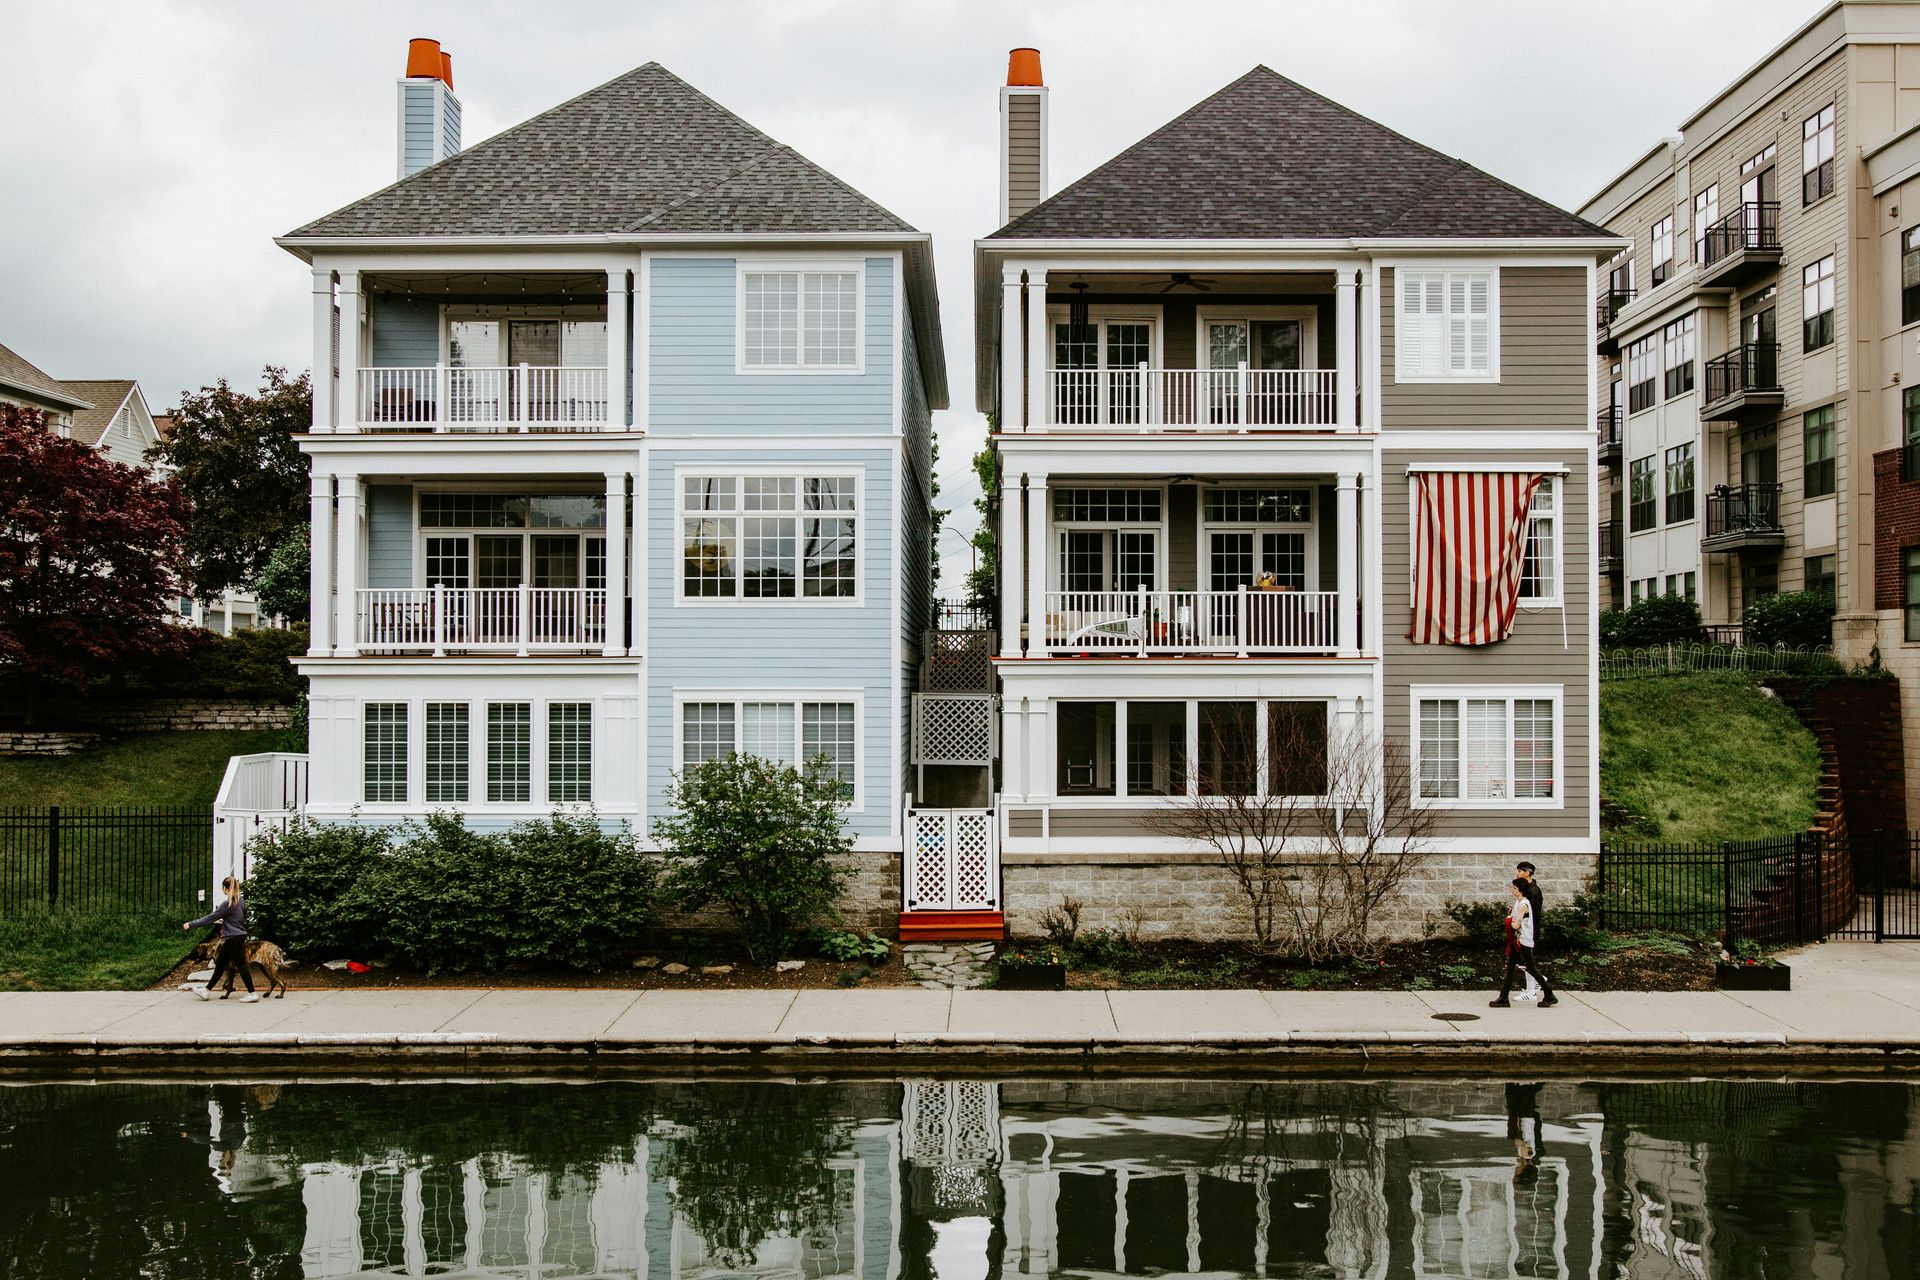
Indianapolis recorded a 119.2% gain in median home value over the decade, climbing from approximately $102,000 in 2016 to $223,697 on the Zillow Home Value Index as of mid-2026. That gain landed it fourth in the Construction Coverage large-city ranking, and the city's current market position sets it apart from the others near the top of the list. Zillow ranked Indianapolis the single most buyer-friendly market among the 50 largest U.S. metros for 2026, citing its combination of affordability relative to local incomes, expected future appreciation, and lower competition compared to tighter markets in the Northeast and Midwest.
The buyer-friendly label doesn't mean prices are falling. Indianapolis home values are up 1.0% year over year, a modest gain that reflects steady demand rather than the overheating seen in Sun Belt cities during the pandemic or the contraction now visible in Tampa and Jacksonville. The Redfin median sale price for the metro sits at $255,000, and homes go under contract in roughly 28 days, faster than the national average but slower than the tightest Midwest markets. The city's economy runs on a diversified base of healthcare, logistics, technology, and motorsports-related industry, and the population has grown steadily over the past several years without the sharp migration spikes that pushed prices up unsustainably in other metros.
What makes the Indianapolis appreciation story distinctive is how much of it simply represents a catch-up to the national median. A $102,000 starting price in 2016 was already well below the national typical home value at the time, and even after more than doubling, Indianapolis remains roughly 40% cheaper than the national average of $370,000. The practical upside is that a household earning the metro-area median income can still buy a home without crossing the 30% affordability threshold that defines "cost burdened" by federal standards. That equation has broken down in most of the country's large cities, and it's part of what keeps Indianapolis attractive to the first-time buyers and relocating professionals that Zillow's analysis identifies as the primary demand driver in this market.
Columbus
Shep McAllister / Unsplash
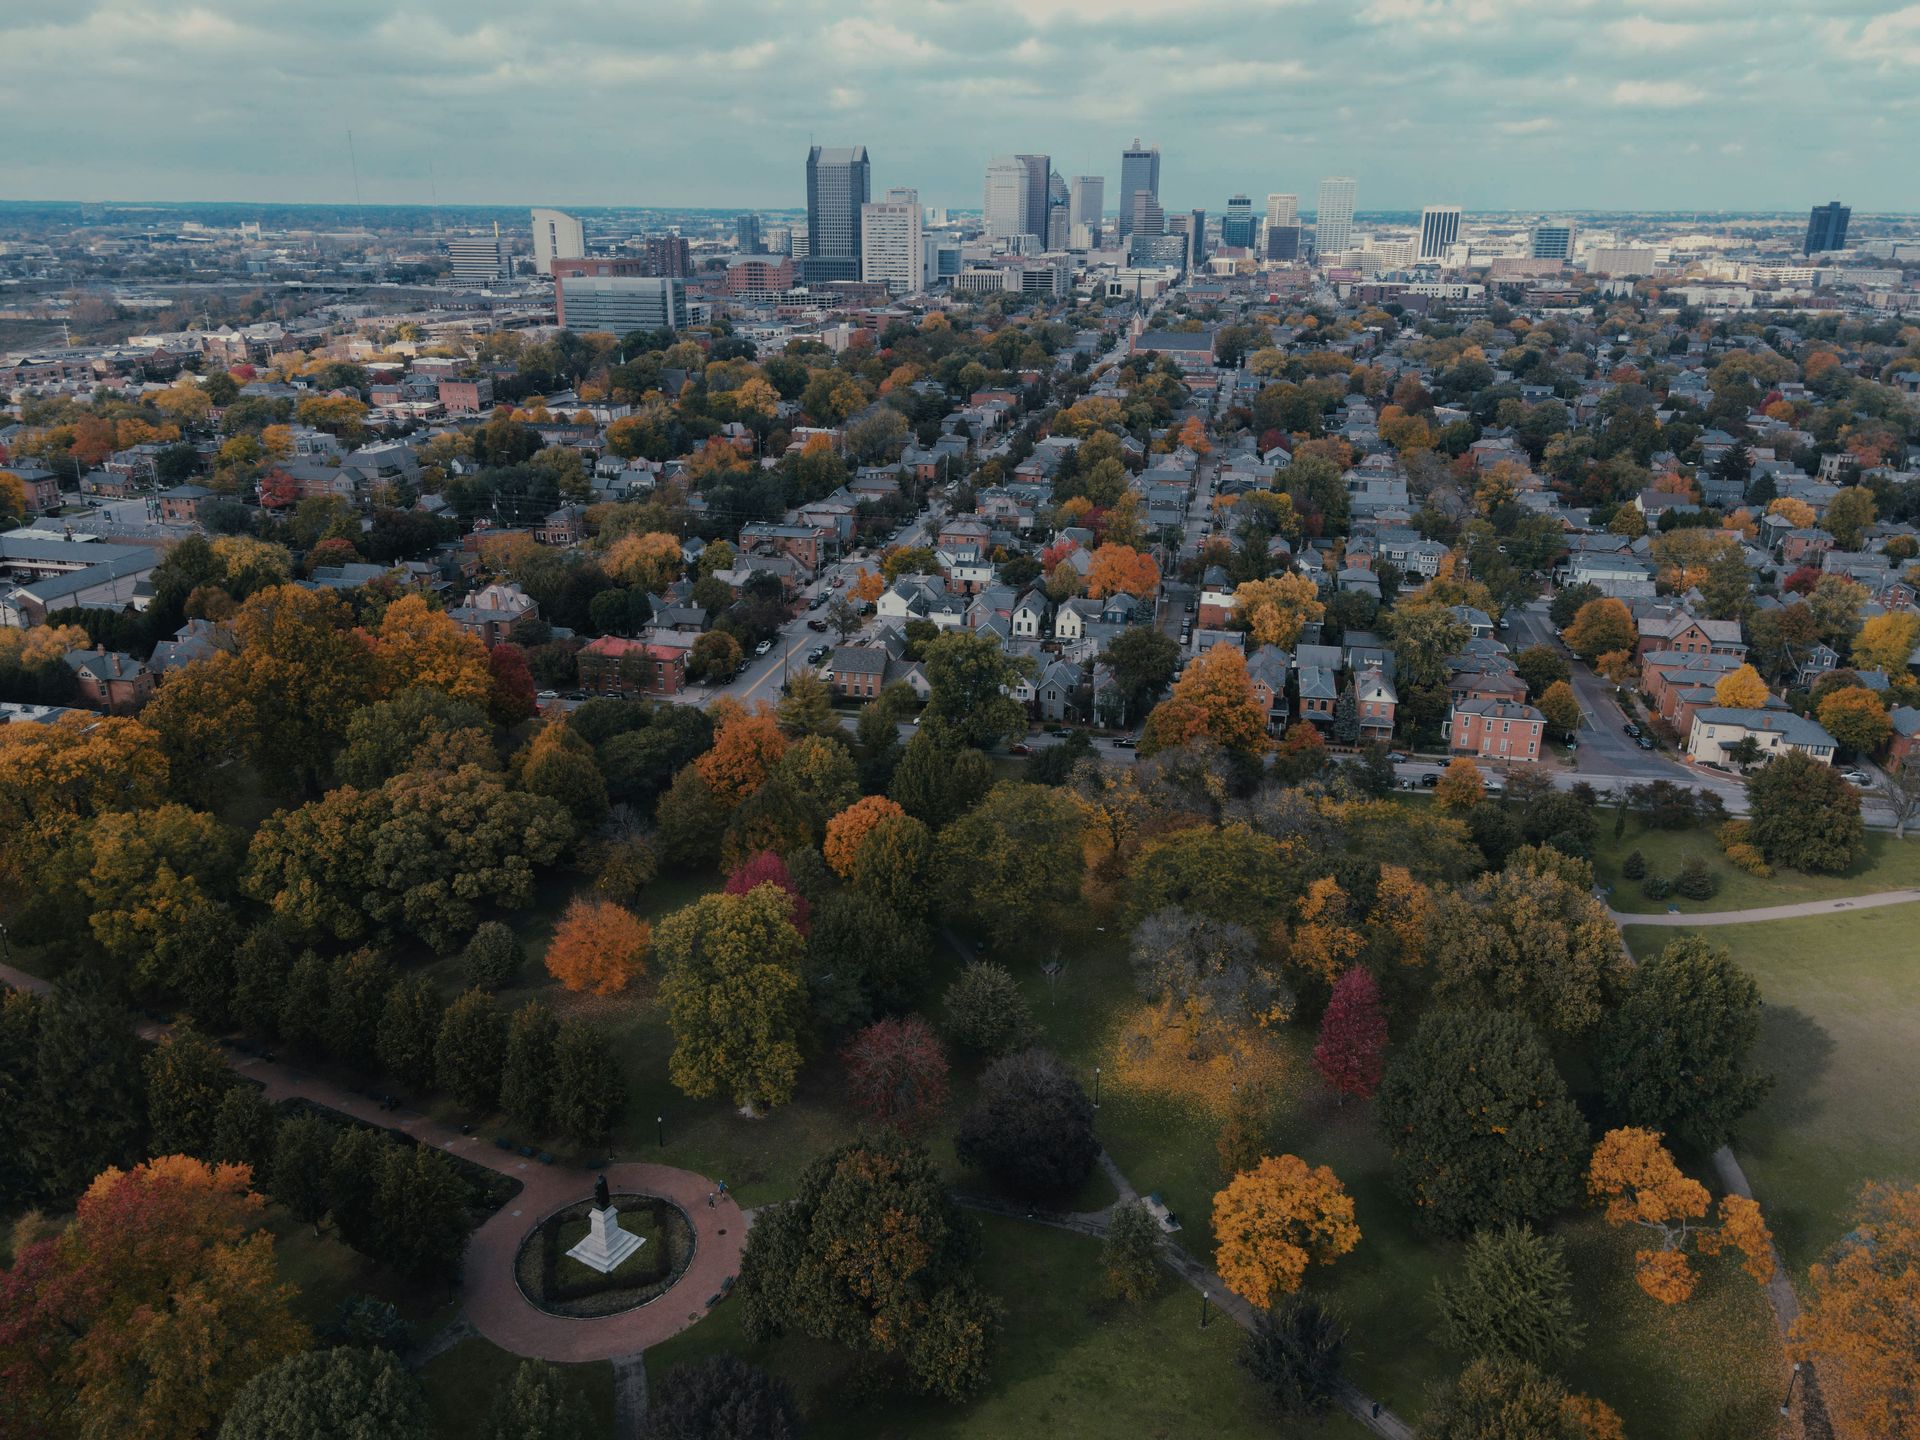
Columbus posted a 117.4% home price increase over the past decade, rising from roughly $116,000 in 2016 to $251,236 on the Zillow Home Value Index. The gain makes Columbus the fifth-fastest-appreciating large city in the Construction Coverage study and the strongest performer in Ohio, a state that saw overall home values climb 91.6% during the same period. Unlike several cities on this list that have seen recent price declines, Columbus remains one of the most competitive housing markets in the Midwest, with homes going pending in just six days on average.
That speed reflects a structural tightness that has defined the Columbus market for years. The city's economy is anchored by Ohio State University, one of the largest employers in the state, and by a cluster of major corporate headquarters and logistics operations that generate consistent job growth. Intel $INTC's decision to build a $20 billion semiconductor manufacturing campus in the Columbus suburbs has added a long-term demand catalyst that wasn't present in 2016 and has shaped expectations for housing needs across the metro area for years to come. Population growth in the Columbus metro has outpaced the rest of Ohio by a significant margin, and the resulting demand for housing has met a supply picture that hasn't expanded fast enough to match.
Zillow data shows Columbus home values ticked down 0.7% year over year as of mid-2026, a mild softening that is barely visible in on-the-ground conditions given the speed at which homes move off the market. The Redfin median sale price for the city runs in the mid-$200,000 range, and the sale-to-list price ratio has remained close to 100%, indicating that sellers aren't offering significant discounts. For a buyer who missed the bottom of the market in 2016, the question now is whether the same structural forces that drove more than a decade of appreciation, population growth, institutional investment, and a university-anchored economy, will continue to push prices higher even as the national market cools.
Charlotte
Wes Hicks / Unsplash
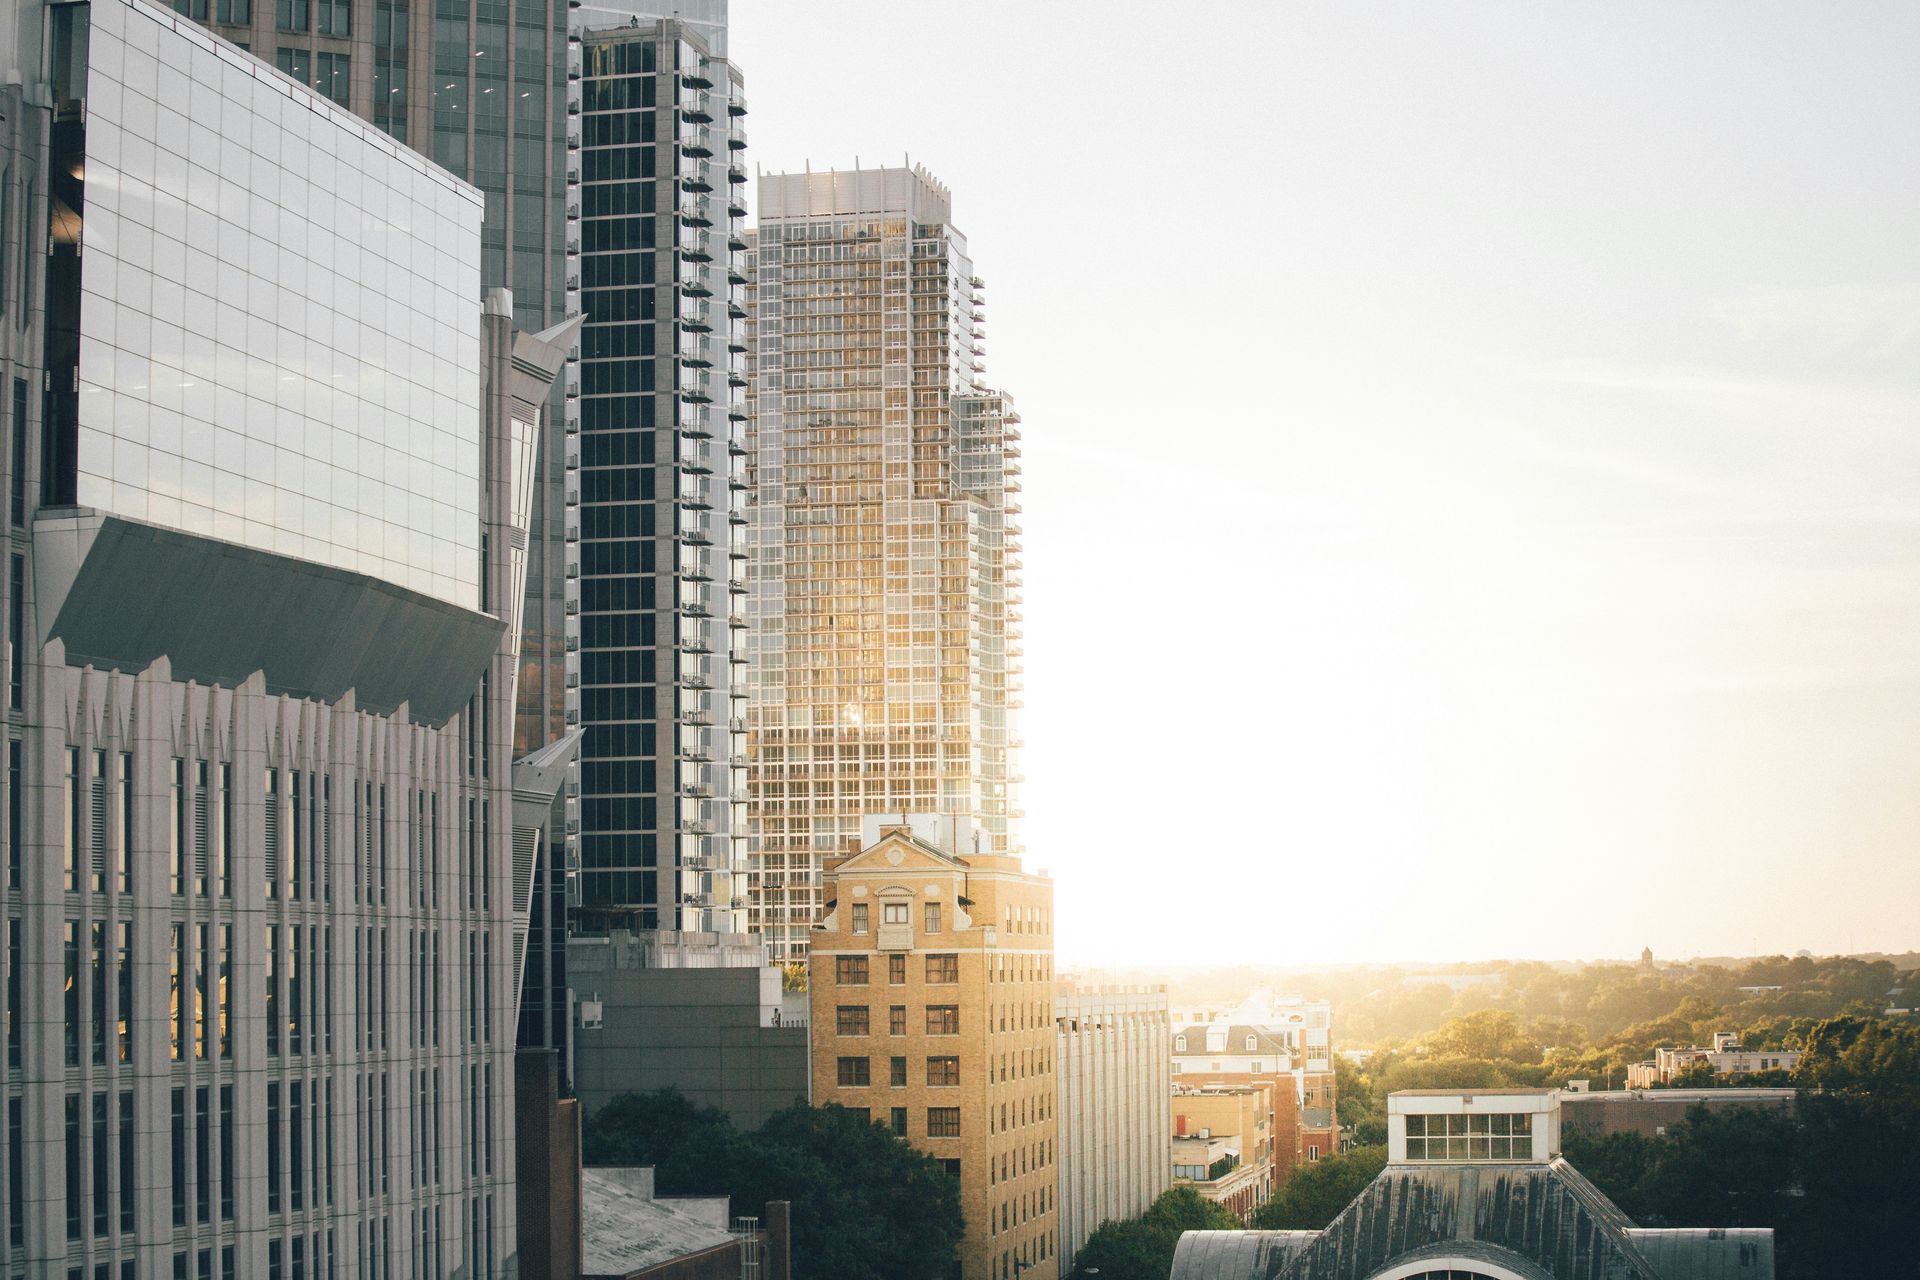
Charlotte, N.C., posted a 111.2% gain over the decade, with its median home value climbing from approximately $188,000 in 2016 to $397,125 on the Zillow Home Value Index, bringing it closer to the national average than almost any other city on this list. The Construction Coverage data places Charlotte sixth among large cities, and the trajectory here is distinct from the Rust Belt and Florida metros that dominate the top of the rankings. Charlotte's growth was driven not by recovery from a depressed base but by sustained in-migration and corporate expansion that turned it into one of the fastest-growing financial and technology centers in the Southeast.
Bank of America $BAC's headquarters anchors a financial services cluster that extends to dozens of fintech firms and insurance companies, and the city's population has grown faster than its housing stock for most of the past decade. Zillow ranked Charlotte the third most buyer-friendly market for 2026, a shift from the intense seller's conditions that prevailed during the pandemic years. Home values have softened 1.3% year over year, and the metro area's inventory has improved gradually, giving buyers more selection and less pressure to waive contingencies or bid above asking.
The Charlotte market's internal variation is wider than the citywide index suggests. Zillow data shows home values in the South End and NoDa neighborhoods running above $465,000 to $525,000, while neighborhoods on the city's west side remain accessible in the low $300,000 range. The metro-area Zillow figure, roughly $517,000, captures a broader geography that includes Concord and Gastonia, and the gap between the cheapest and priciest ZIP codes spans more than five to one. The median household income in the Charlotte metro sits above the national figure, and the Redfin median sale price of approximately $400,000 puts the city in a zone where a dual-income household earning the local median can still qualify for a mortgage without stretching past the 30% threshold. That's increasingly rare for a city of Charlotte's size and growth rate, and it's part of what Construction Coverage's data captures when it shows a decade of appreciation that still hasn't priced out the middle of the market.
Cleveland
Chris Bischoff / Unsplash
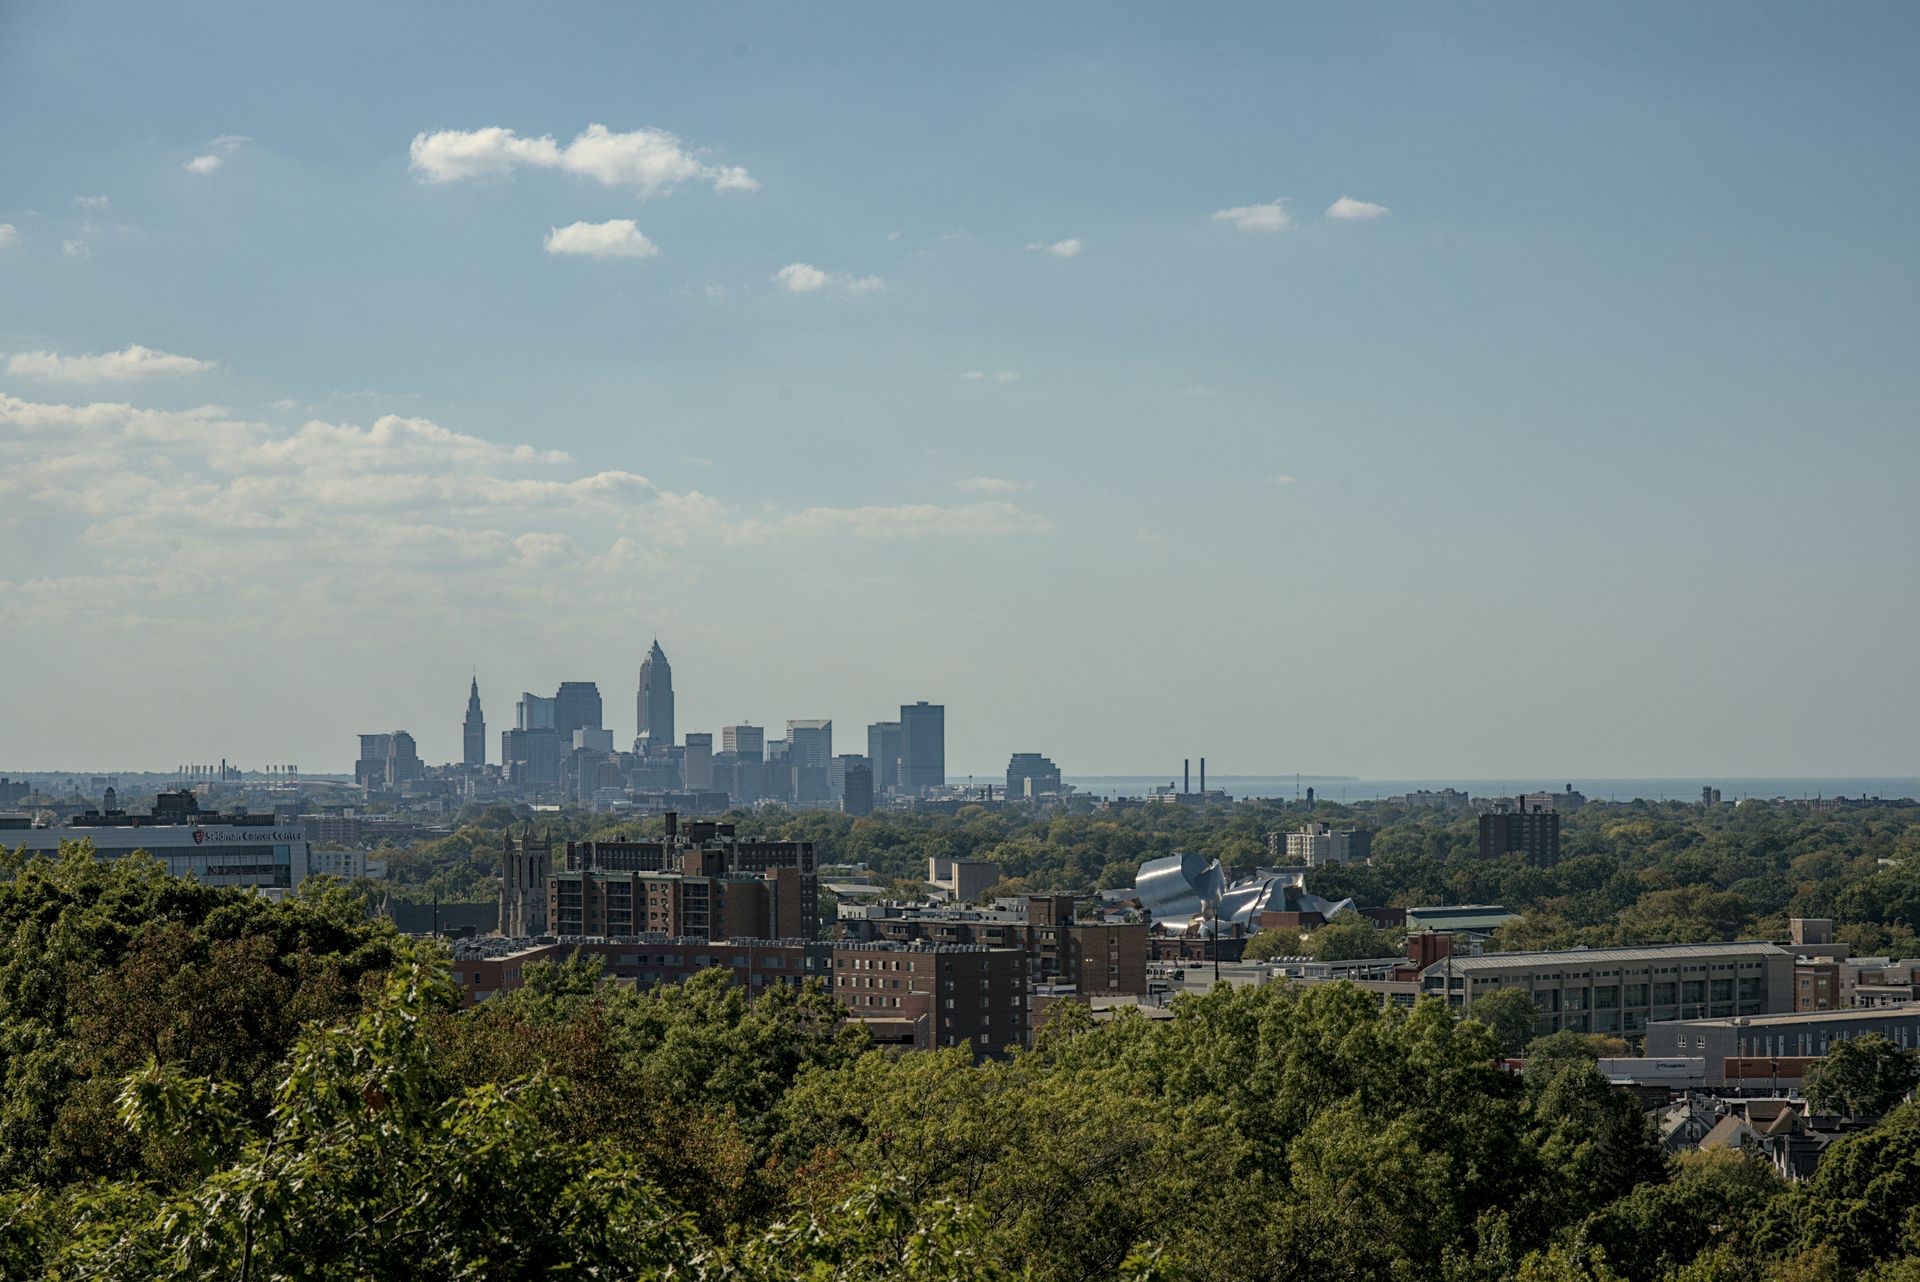
Cleveland's 108.5% gain doubled its median home value from roughly $58,000 in 2016 to $120,549 on the Zillow Home Value Index, placing it seventh in the Construction Coverage large-city ranking. The percentage increase is striking, but like Detroit, it starts from a base that reflects decades of population loss, industrial decline, and a housing market that spent years shedding value while the rest of the country recovered from the Great Recession. A homeowner who bought a typical Cleveland property in 2016 for under $60,000 and holds it today has seen meaningful paper gains, yet the resulting value is still less than a third of the national median.
The Cleveland housing market has softened modestly in 2026, with Zillow showing a 2.3% year-over-year decline in the home value index. The Redfin median sale price sits around $150,000, higher than the Zillow index because transaction data tends to skew toward homes in better condition than the overall stock, which includes a significant share of older, unrenovated properties. The Cleveland Clinic and University Hospitals health system provide the economic foundation for the metro area, and the institutional presence helps stabilize demand in nearby neighborhoods even as outlying areas see weaker activity.
What makes Cleveland's position on this list significant is that it demonstrates how much room for recovery existed in America's most affordable large cities. The 108.5% gain didn't transform Cleveland into an expensive market. It brought a deeply undervalued housing stock partway back toward something resembling replacement cost. Construction costs for new single-family homes in Ohio run well above $120,000, which means the Zillow index for Cleveland still sits below what it would cost to build an equivalent house from scratch. That gap between existing home values and new construction costs is a dynamic that has supported price appreciation in several cities on this list and helps explain why the recovery, even at triple-digit percentage gains, hasn't made these markets unaffordable by national standards.
Kansas City
Samuel Myles / Unsplash
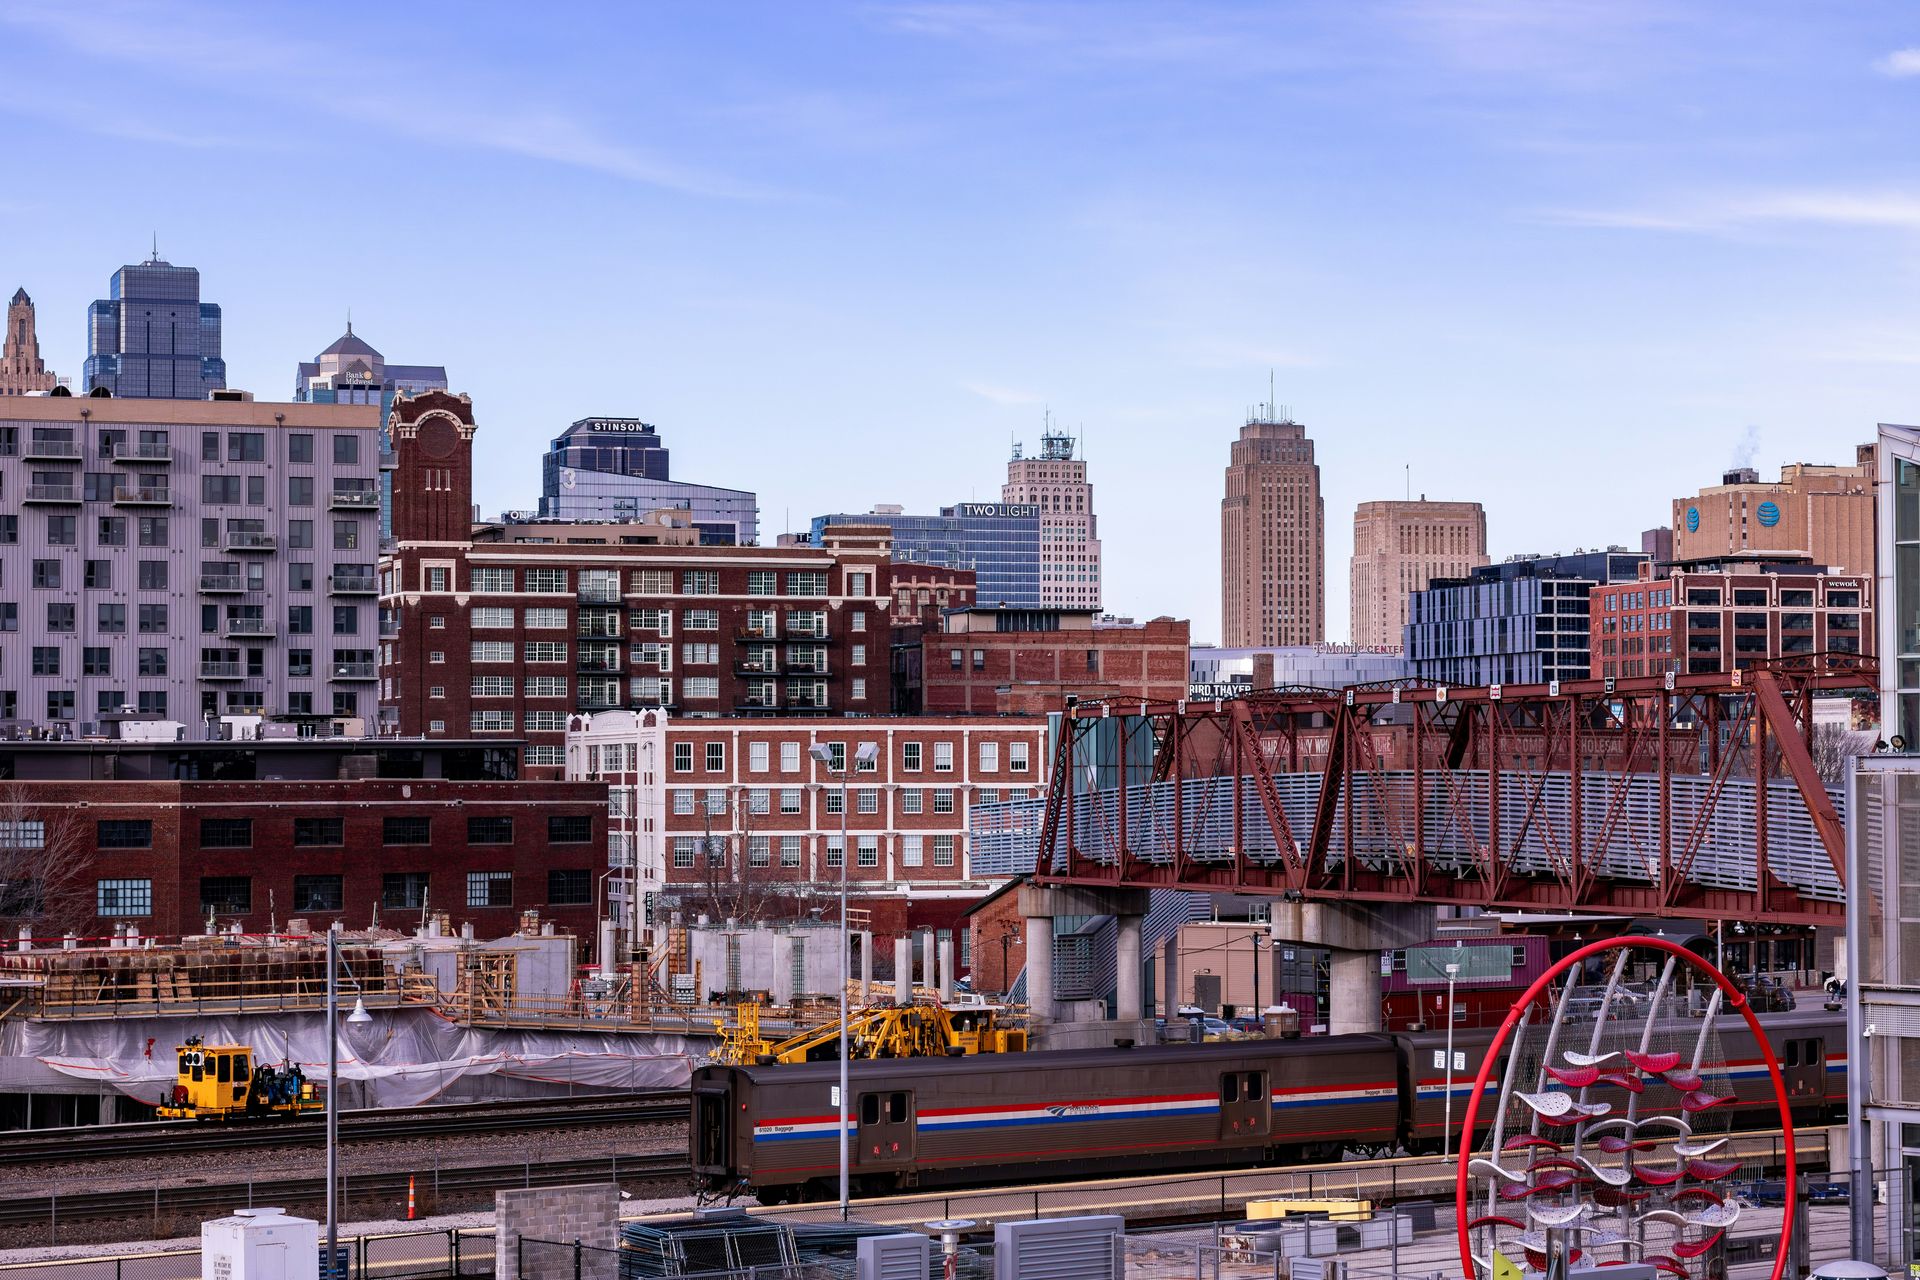
Kansas City recorded a 107.2% increase over the decade, with its Zillow Home Value Index climbing from approximately $123,000 in 2016 to $255,647 in 2026. The gain is closely aligned with the national 81% average but outpaces it significantly, and the city's current market conditions suggest the upward trajectory hasn't fully stalled. Redfin data for the three months ending May 2026 shows the Kansas City median sale price at $305,000, up 8.9% year over year, one of the strongest recent gains of any city on this list.
Homes in Kansas City sell in about 23 days on average, and the Construction Coverage data places the city's trajectory squarely in the category of metros that appreciated steadily rather than spiking and correcting. The Kansas City economy draws from agriculture, healthcare, technology, and federal government operations, and the metro straddles two states, with the Missouri side representing the bulk of the population and the Kansas side contributing its own set of neighborhoods and price dynamics. The diversification has insulated Kansas City from the kind of sector-specific shocks that can destabilize housing markets more reliant on a single industry.
The appreciation also reflects Kansas City's position as one of the few large cities in the middle of the country where housing demand has consistently exceeded new supply. The metro area's building permit activity has lagged population growth over the past several years, and the resulting inventory constraint has kept prices firm even during stretches when national sentiment cooled. Construction Coverage's analysis shows Kansas City's home prices outpacing local income growth over the decade, a pattern common to every city on this list but one that remains more manageable here than in higher-cost metros. A household earning the metro median income in Kansas City faces a price-to-income ratio that still falls within traditional affordability benchmarks, which is part of what continues to draw relocating buyers from the coasts.
Las Vegas
Tyler Hardie / Unsplash
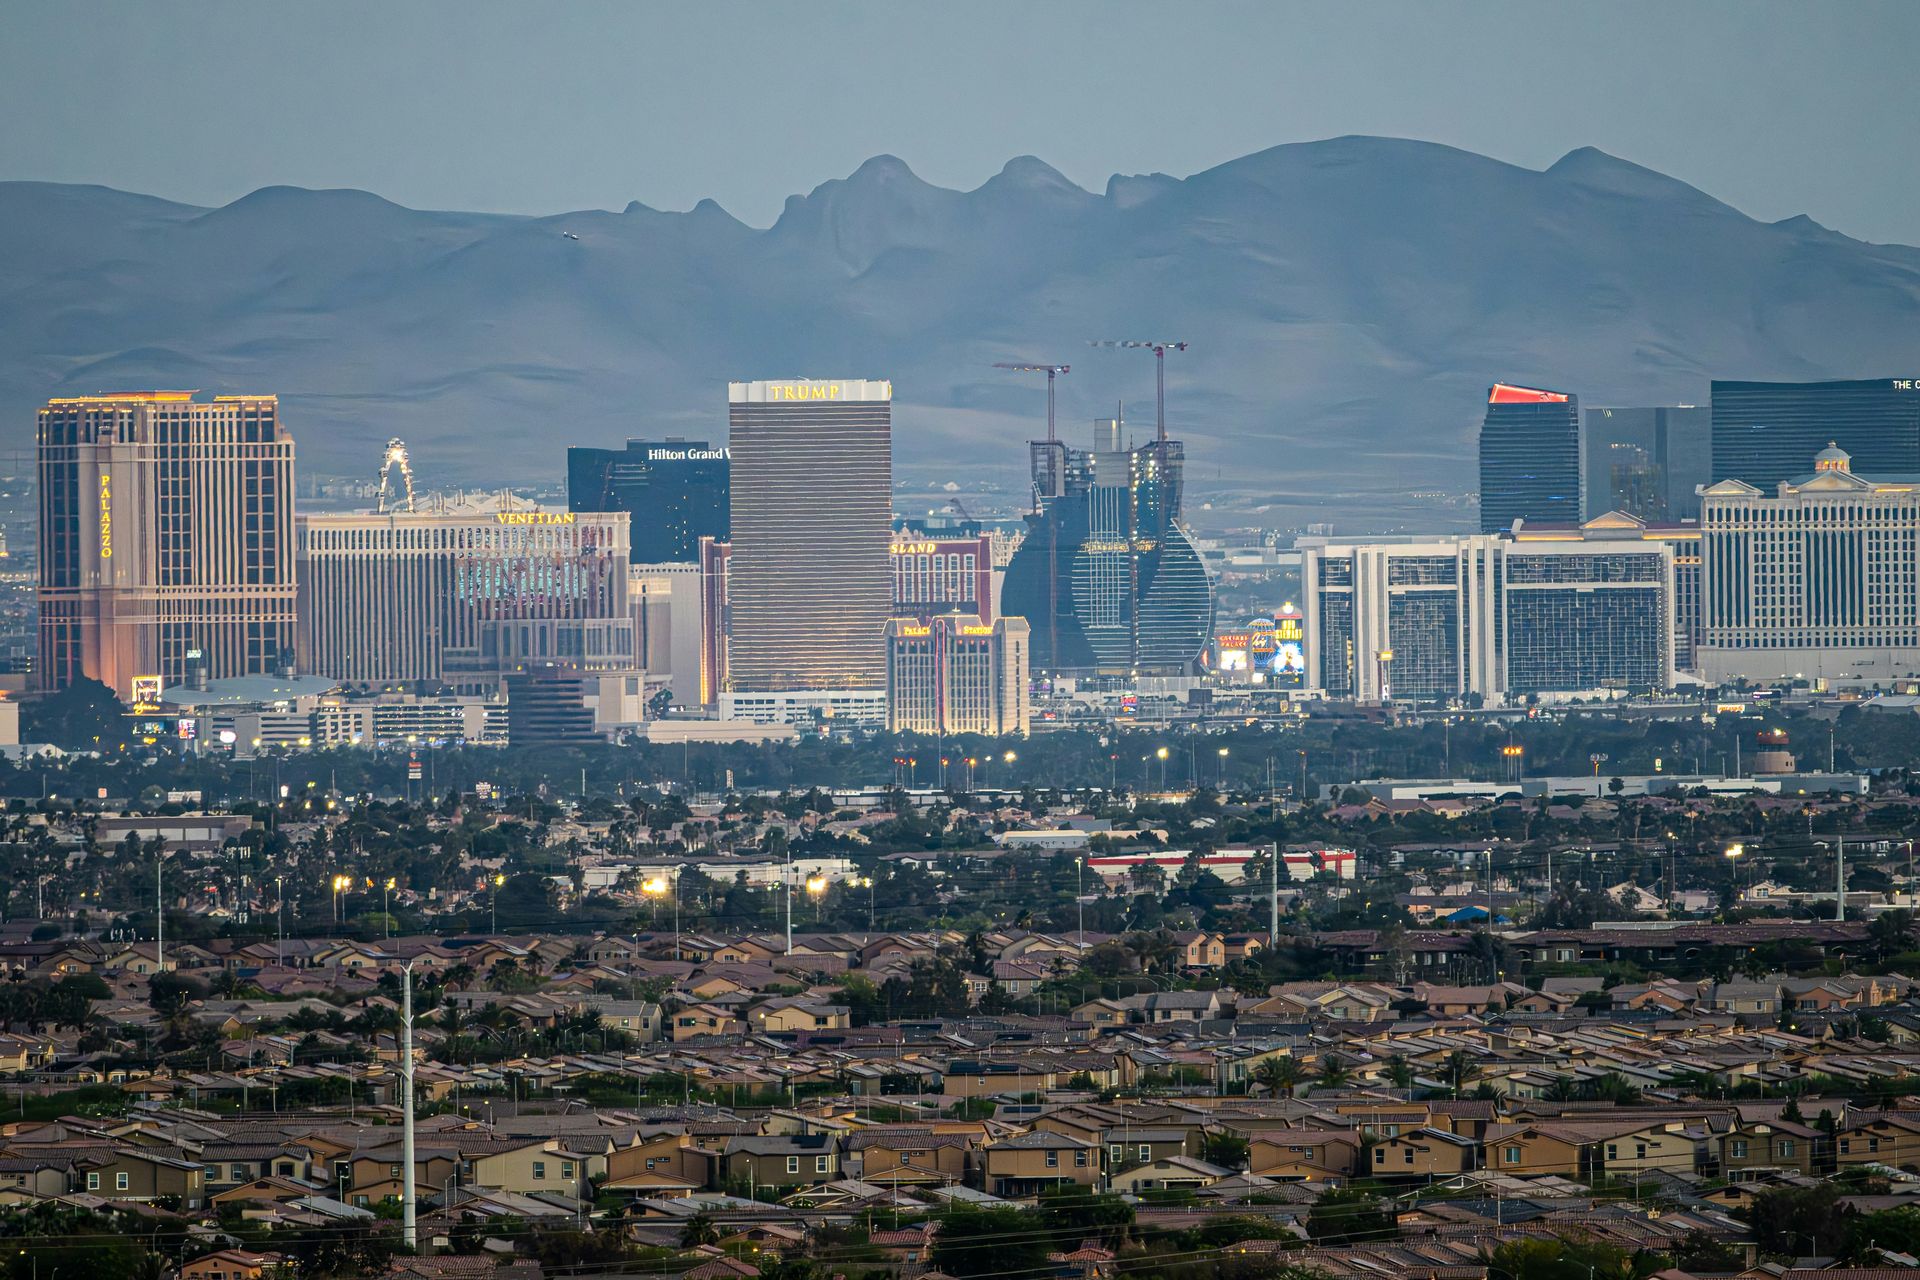
Las Vegas saw its median home value climb 104.2% over the past decade, rising from roughly $208,000 in 2016 to $425,535 on the Zillow Home Value Index. That gain places it ninth in the Construction Coverage large-city ranking and represents a full recovery and then some from the catastrophic losses of the late 2000s, when the Las Vegas housing market became one of the national symbols of the subprime mortgage collapse. Median home values in the metro area fell more than 60% between 2006 and 2012, and the 2016 starting point in the Construction Coverage data captures a market that was still well below its pre-crisis peak.
The run-up since then has been powered by a migration wave from California that accelerated during and after the pandemic. Nevada's lack of a state income tax, combined with home prices that remain a fraction of those in Los Angeles and the Bay Area, made Las Vegas one of the most popular relocation destinations in the country. The Construction Coverage data captures the cumulative effect of that demand over a full decade, but the most recent trend line has reversed. Zillow data as of mid-2026 shows Las Vegas home values declining 3.1% year over year, and the market has shifted toward buyers as inventory has risen and days on market have increased. The correction isn't on the scale of 2008 but reflects a broader normalization visible across several Sun Belt metros where pandemic-era demand pushed prices beyond what local incomes can sustain.
The Las Vegas housing market also carries risks that aren't captured in the price data alone. Water supply constraints tied to Lake Mead's declining levels have raised long-term questions about the sustainability of continued population growth in the Mojave Desert, and the city's economy remains more dependent on tourism and hospitality than the diversified metros elsewhere on this list. Construction Coverage's analysis captures a decade in which Las Vegas recovered, surged, and is now settling into a new equilibrium, with the typical home sitting at a price that is roughly double its 2016 level and about 15% above the national median.
Jacksonville
Josh Moore / Unsplash
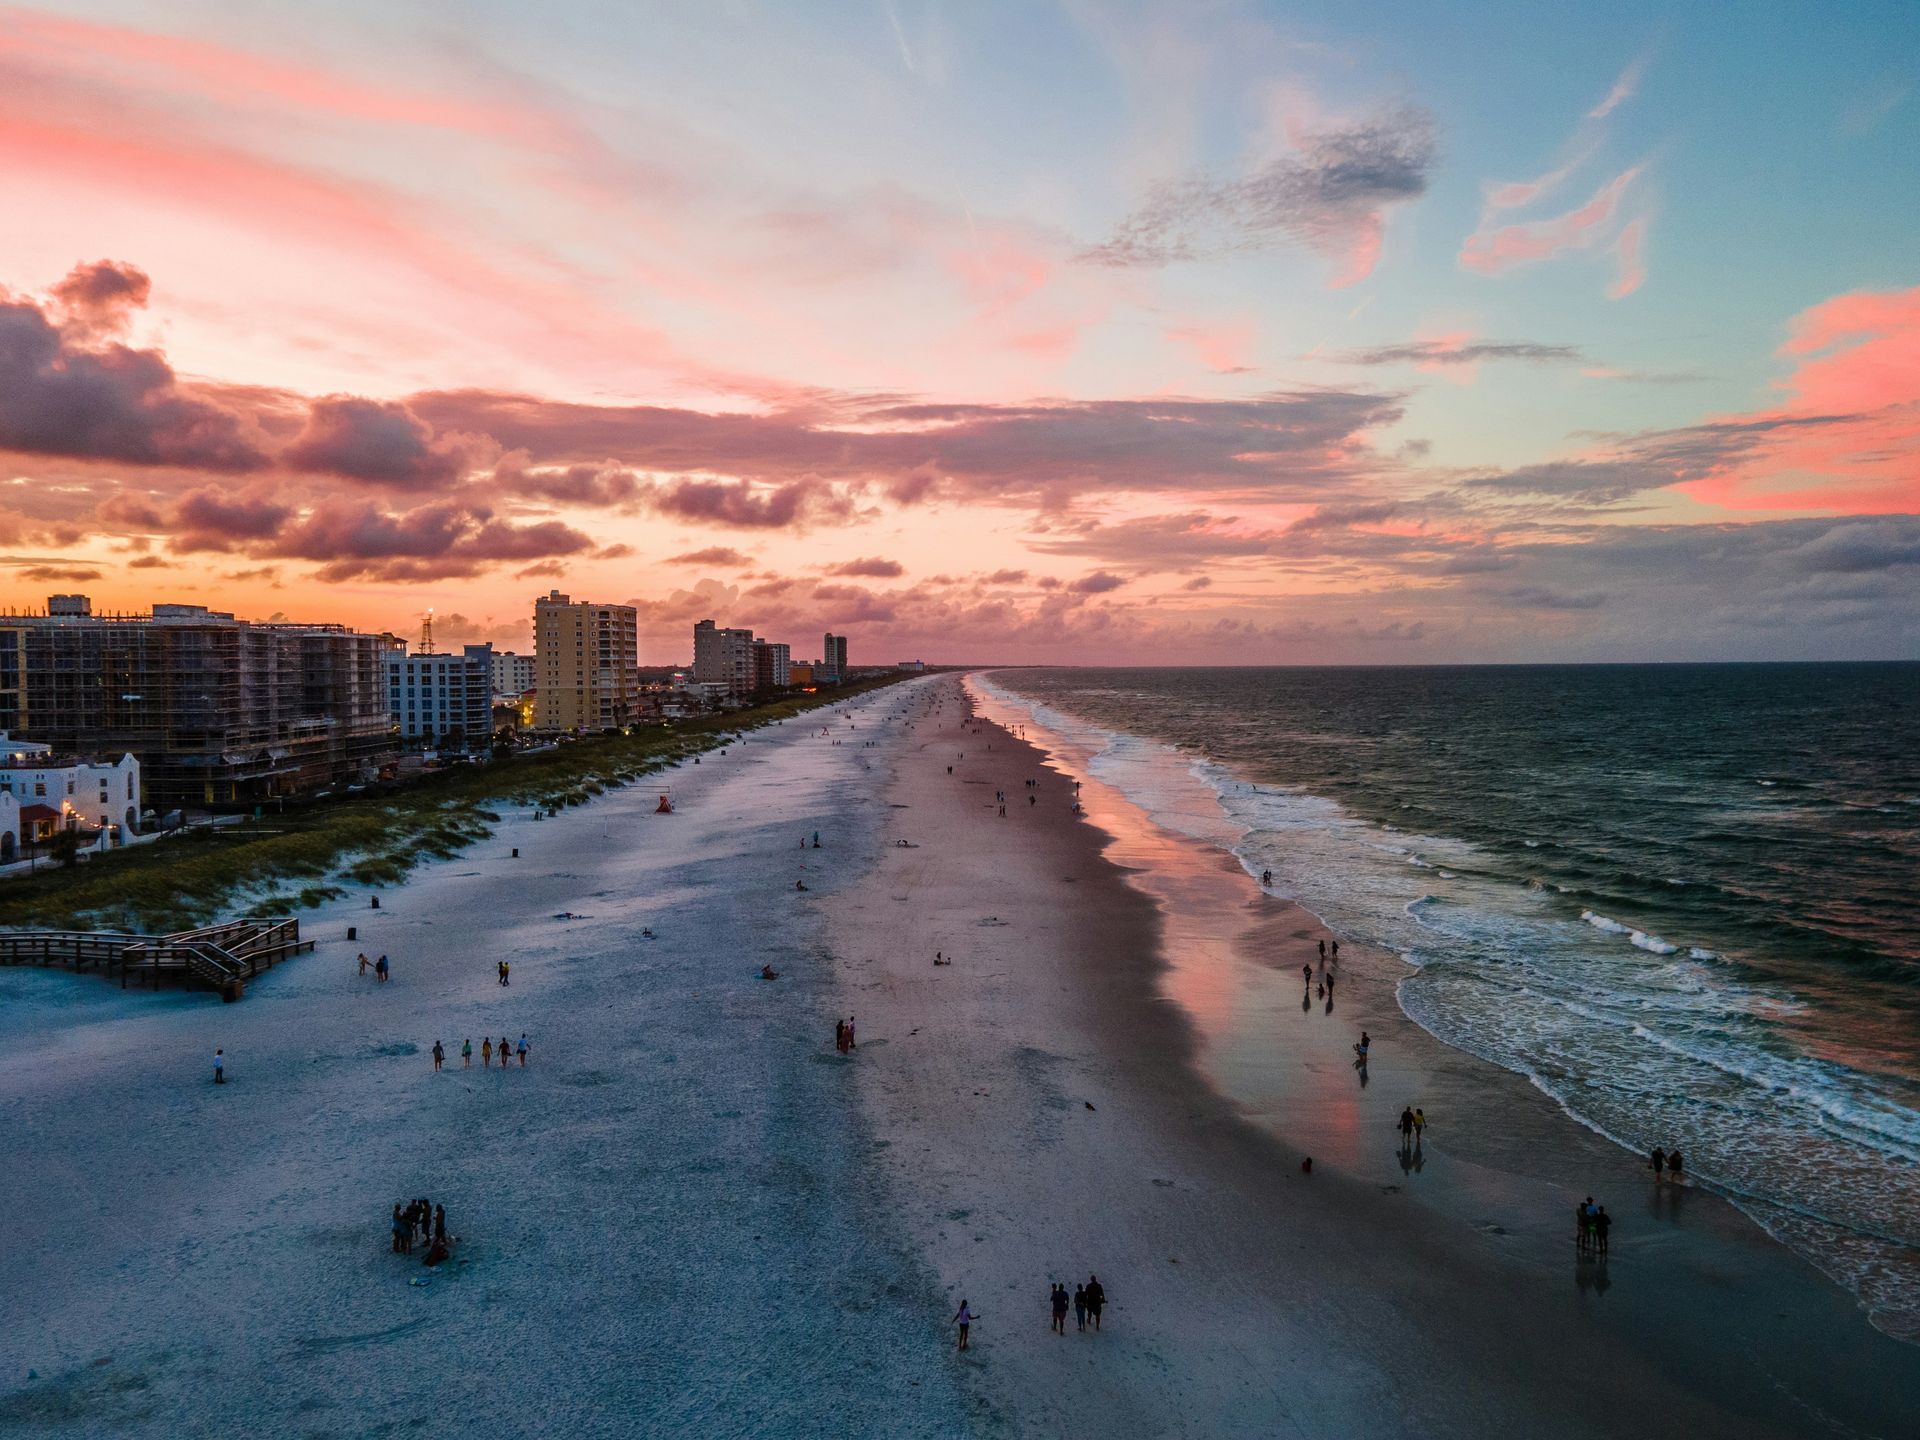
Jacksonville, Fla., rounds out the top 10 with a 99.6% gain, just barely missing the threshold of a full doubling. The Zillow Home Value Index climbed from roughly $148,000 in 2016 to $295,910, making Jacksonville the most expensive city on this list relative to its starting price after Tampa, Charlotte, and Las Vegas. The Construction Coverage ranking captures a market that rode the same pandemic-era Florida migration wave as Tampa but has since entered a similar correction, with Zillow reporting a 2.3% year-over-year decline in home values and inventory levels sitting at roughly 3.4 months of supply.
Jacksonville's appeal has long been its position as one of the last affordable large coastal metros in Florida. The median sale price in the metro area runs between $305,000 and $325,000 depending on the data source, and the city spans an enormous geographic footprint that includes waterfront neighborhoods, suburban sprawl, and rural-adjacent parcels all within the same city limits. That diversity means the citywide median masks a wide range of conditions. Homes in Ponte Vedra Beach and the Intracoastal West sell for well above $500,000, while first-time buyers looking at the Northside and Westside find options below $200,000. The Northeast Florida Association of Realtors reported a median sale price of $325,000 in April 2026, essentially unchanged from the prior year, and days on market fell to 36 in that same month.
The story of Jacksonville's decade, like Tampa's, is one of rapid appreciation followed by stabilization and mild correction. The 99.6% gain captured by Construction Coverage represents a market that nearly doubled from a relatively low starting point, fueled by the same forces that drove growth across Florida. Rising insurance costs, which have pushed the typical Florida homeowner's annual premium to more than $7,000, have added a carrying cost that didn't exist at this scale in 2016 and that affects Jacksonville buyers just as it does their counterparts in Tampa and Miami. The result is a market where the sticker price has stabilized but the total cost of ownership continues to rise, compressing the affordability advantage that drew buyers to Jacksonville in the first place.