
U.S. housing competition is peaking in affordable Northeast and Midwest cities. Realtor.com ranks metros by buyer demand and listing pace
Barry Winiker / Getty Images
The search for affordable housing has reshaped American geography in ways that most national headlines miss. Buyers priced out of Boston, New York, and other major metropolitan centers have redirected their attention to smaller, more accessible cities within commuting range — or at least within moving distance — of those same economic hubs. The result is a tier of housing markets operating under sustained, intense buyer pressure while the largest cities in the country continue to soften. In the hottest markets of April 2026, listings attracted roughly three times the national average number of viewers per property, and the typical home sold in 28 days, more than three weeks faster than the national median. That gap between the country's hottest markets and the rest of the map is not narrowing.
The structural forces behind this dynamic are well established. Decades of constrained construction in the Northeast and Midwest have left inventory tight in cities where economic opportunity still draws young workers. As remote work gave buyers more geographic flexibility, many chose markets where their incomes could stretch furthest. That migration pressure concentrated in metros already running lean on supply, compressing timelines further and pushing prices upward even in cities that once attracted buyers precisely because they were cheap. Inventory rose 4.6% nationally year over year in April 2026, and list prices fell for the sixth consecutive month, but those national trends offer little relief to buyers competing in the markets where demand stays highest.
Mortgage rates added a layer of complexity to the spring buying season. Rates hit a seven-month high of 6.46% on April 2, 2026, before settling at 6.30% by month's end, still meaningfully below the 7.17% recorded in April 2024 and the 6.81% in April 2025. Lower rates supported a rebound in mortgage purchase applications and pushed new listings to their highest April volume since 2022, rising 8.7% month over month and 1.1% year over year. Realtor.com's Hottest Housing Markets report for April 2026 measures each metro on two dimensions: buyer demand, gauged by unique property views on Realtor.com, and market pace, according to median days a listing stays active. The top 10 markets this month tell a story of persistent regional concentration: every ranked market sits in either the Northeast or the Midwest, and four come from a single state.
Barry Winiker / Getty Images
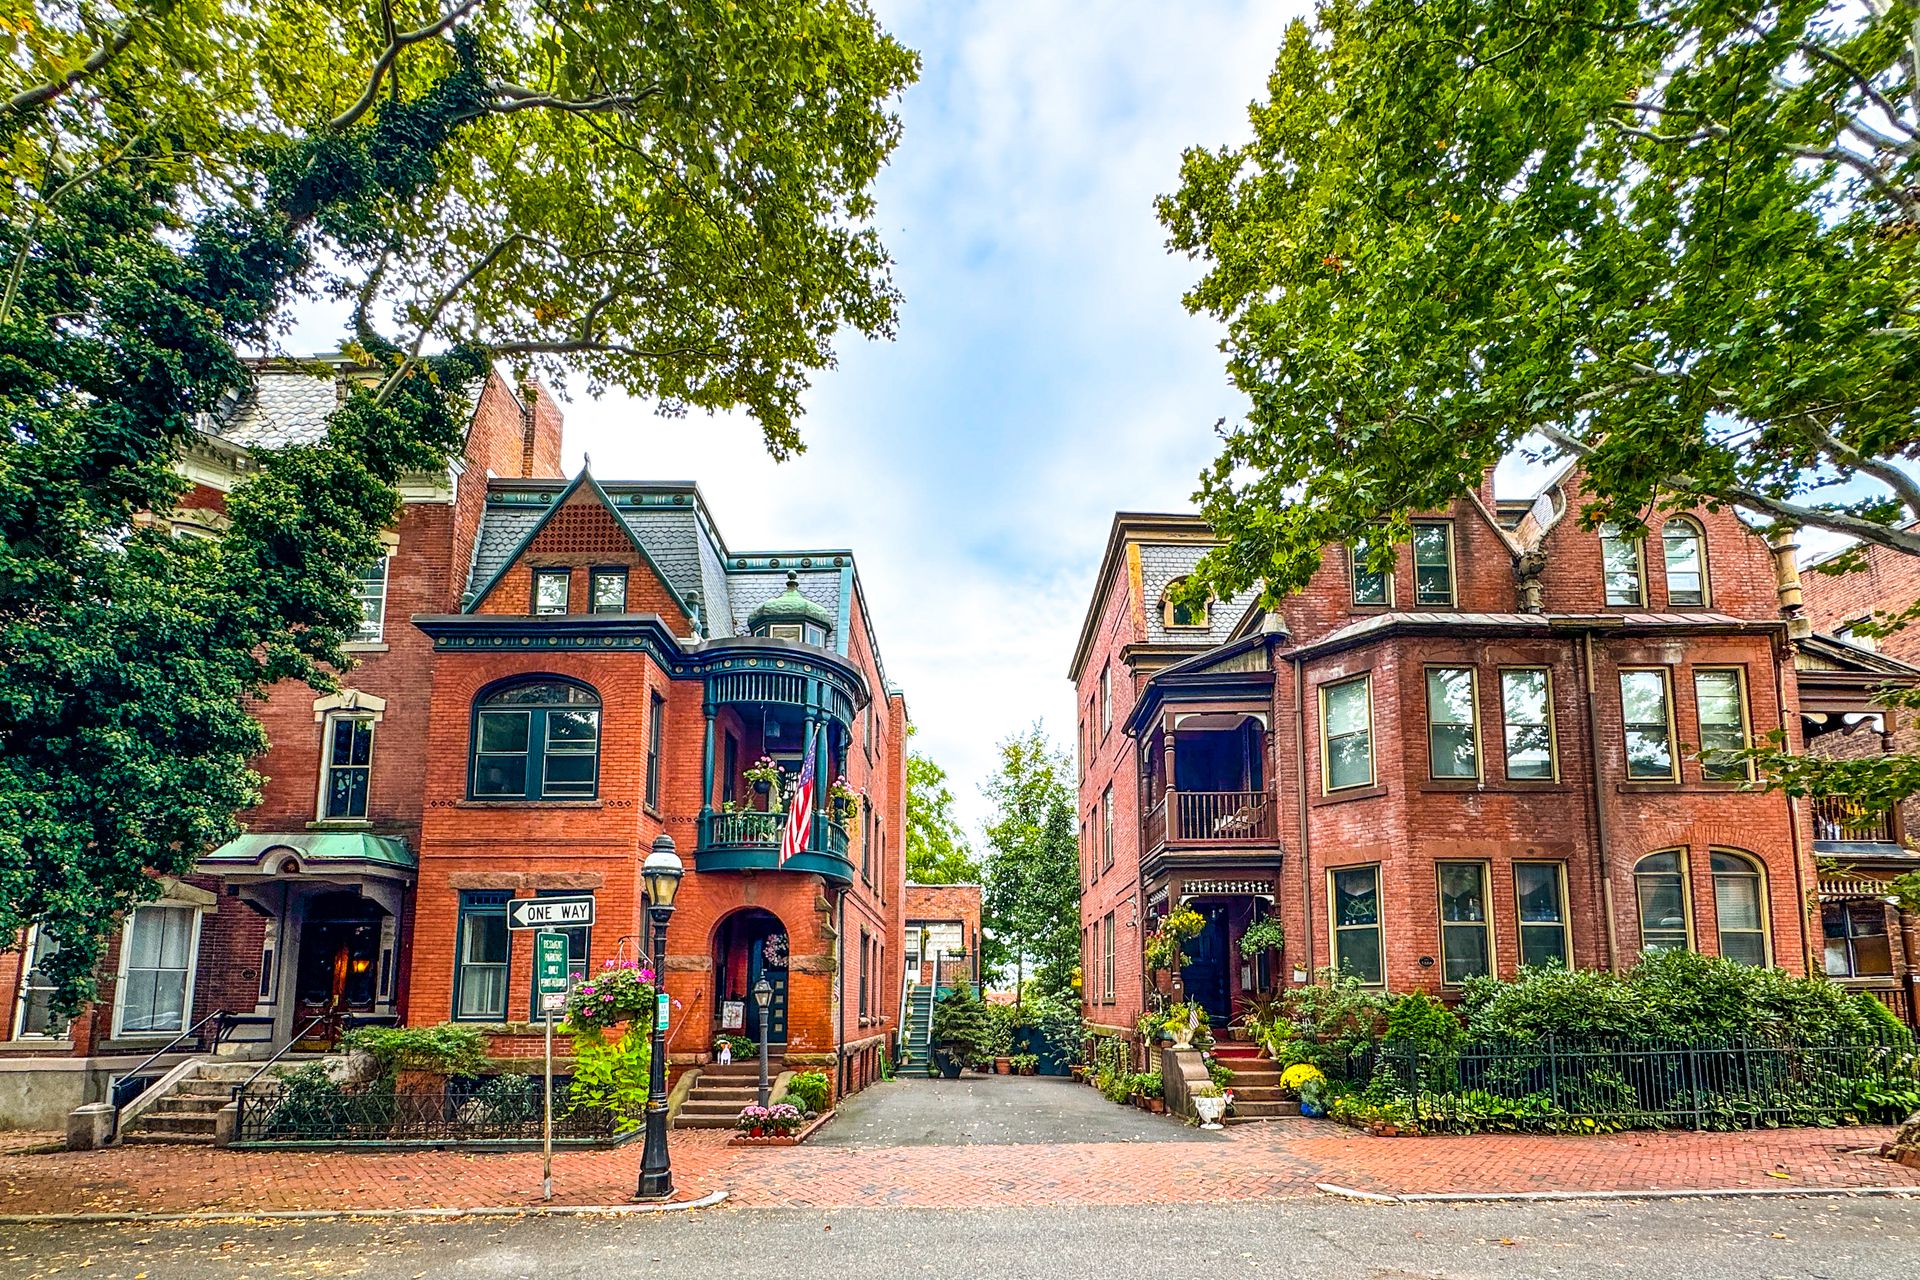
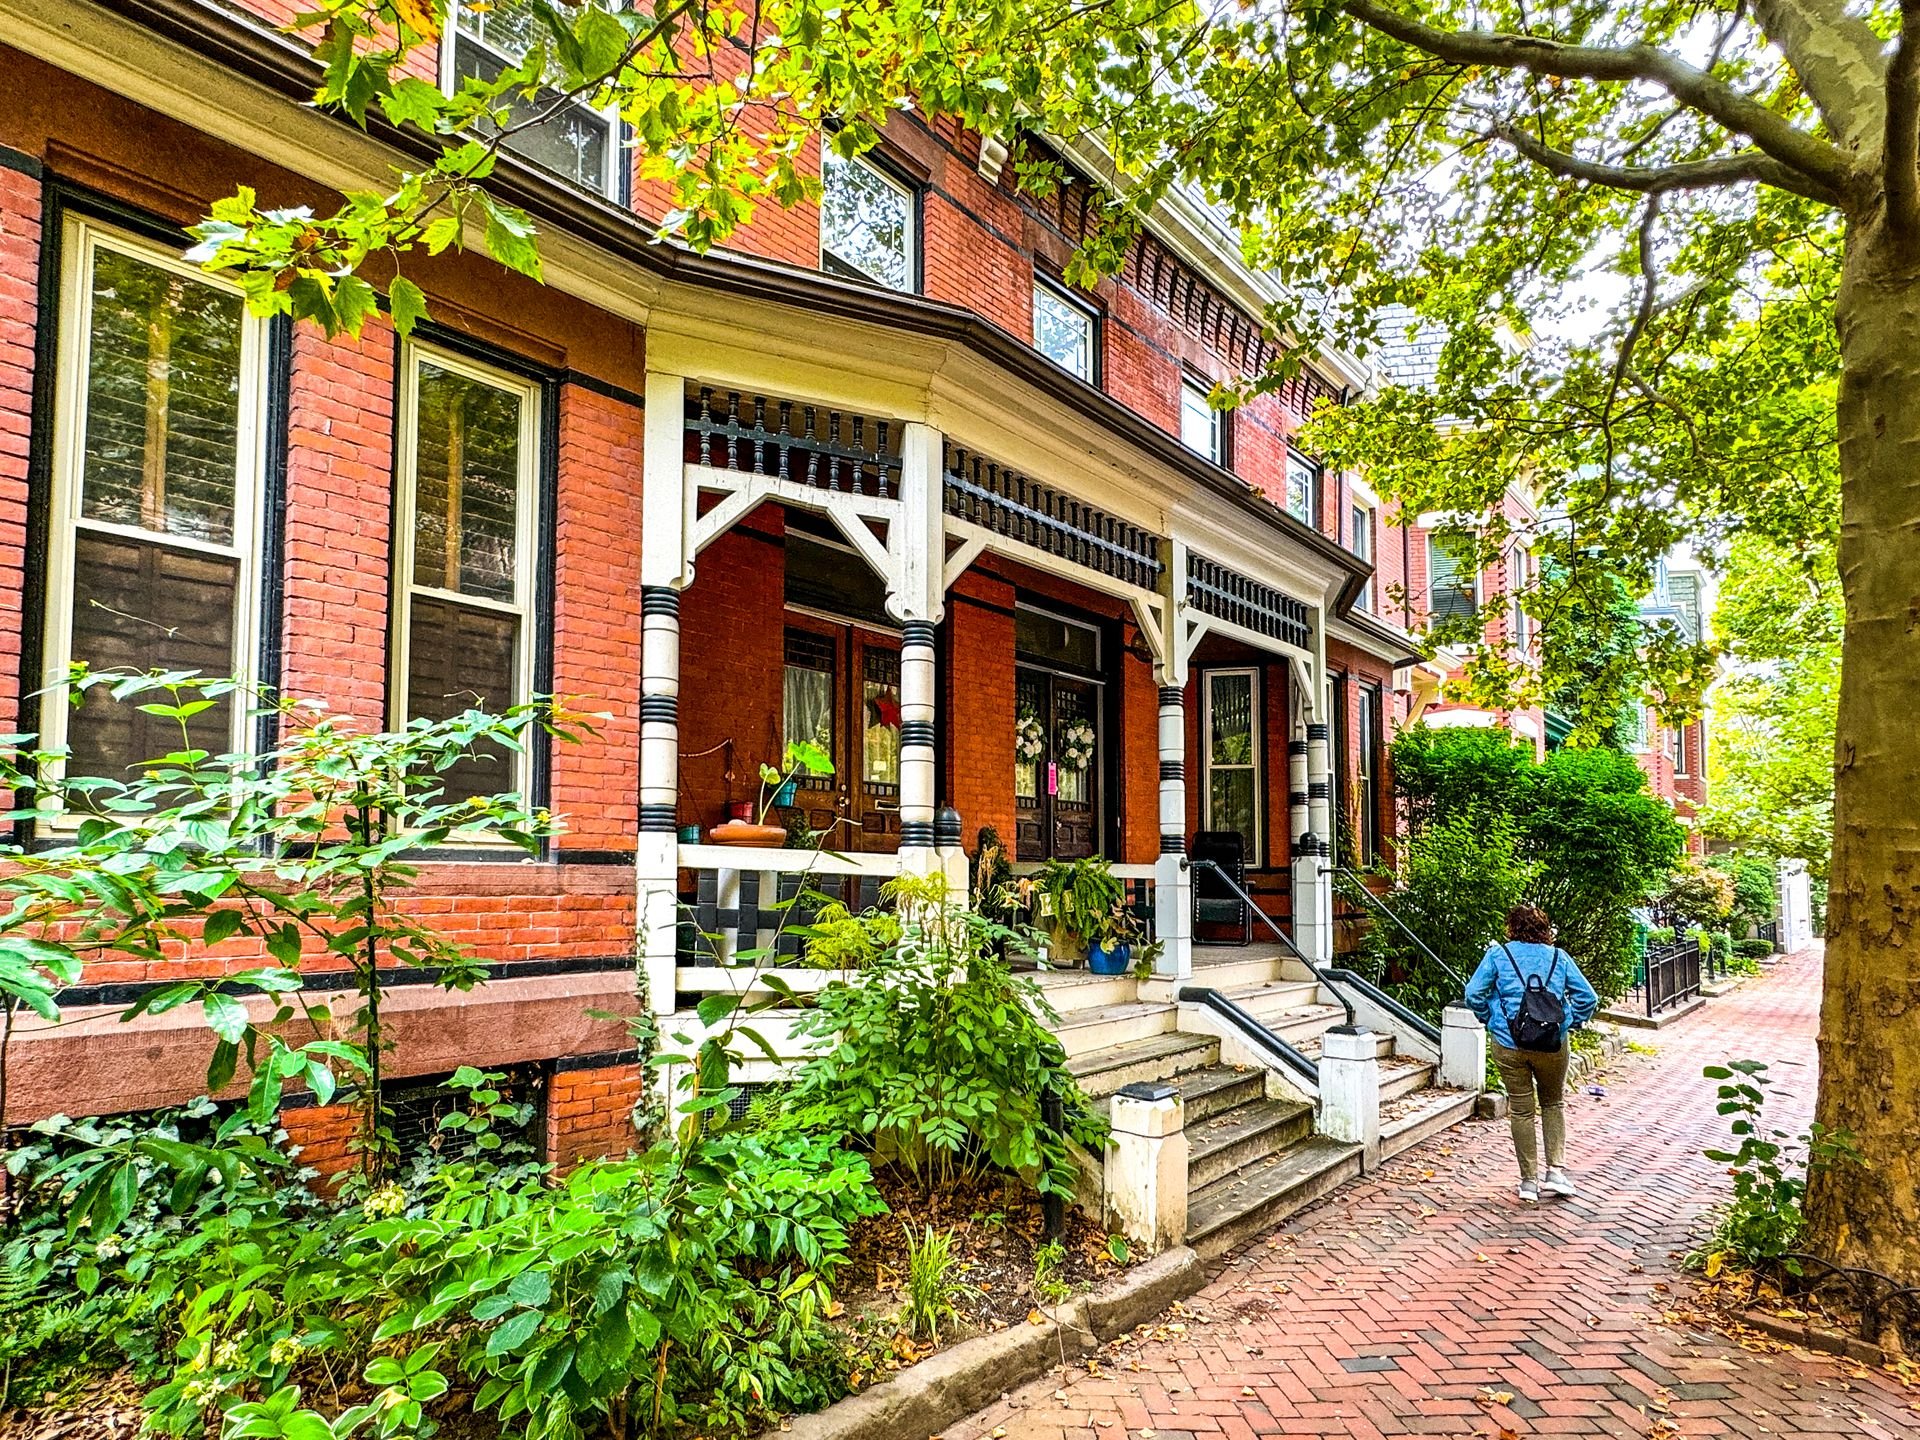
Springfield, Mass., claimed the top ranking for the second consecutive month in April 2026, driven by buyer demand and sales velocity that no other market in the country matched. The metro earned its position through extreme affordability relative to its neighbors and relentless buyer engagement: listings attracted 3.6 times the national average number of views per property, and the typical home sold in just 23 days. That 23-day median was nine days faster than March's pace and nearly a month ahead of the U.S. norm.
The affordability story that sustains Springfield's dominance begins 90 miles to the east. Boston carries a median listing price of $832,500 — more than twice Springfield's — and remains firmly in seller's market territory, where low inventory and high buyer competition give sellers the upper hand. Springfield's median listing price of $365,000 in April 2026 is less than half of Boston's, a gap that consistently draws buyers who need access to the region's employment opportunities but cannot absorb Boston's cost of entry. Springfield sits 25 miles north of Hartford, Conn., placing it within range of multiple major employment corridors and within a commutable distance of Providence, Albany, and New York City.
Massachusetts' third-largest city, with a population of 155,000, also carries cultural weight that smaller markets often lack. Dr. James Naismith invented basketball at what is now called Springfield College in 1891, earning the city the nickname "Birthplace of Basketball." Theodor Seuss Geisel, known globally as Dr. Seuss, grew up there, and the Amazing World of Dr. Seuss Museum now draws visitors to the city. Real estate broker Michael Sakey told Realtor.com that three-bedroom, one-bath homes remain available under $300,000 in the city, that the city offers neighborhood styles ranging from urban downtown to classic suburbia, and that multiple-offer situations have persisted since 2020 without letting up. Springfield's year-over-year listing price gain stood at 5.8% in April 2026, a measured appreciation rate that suggests the affordability advantage has not yet been fully arbitraged away. The suburbs surrounding the city add parks, hiking trails, and fishing spots to a package that keeps drawing buyers outward from pricier metros.
Sanghwan Kim / Getty Images
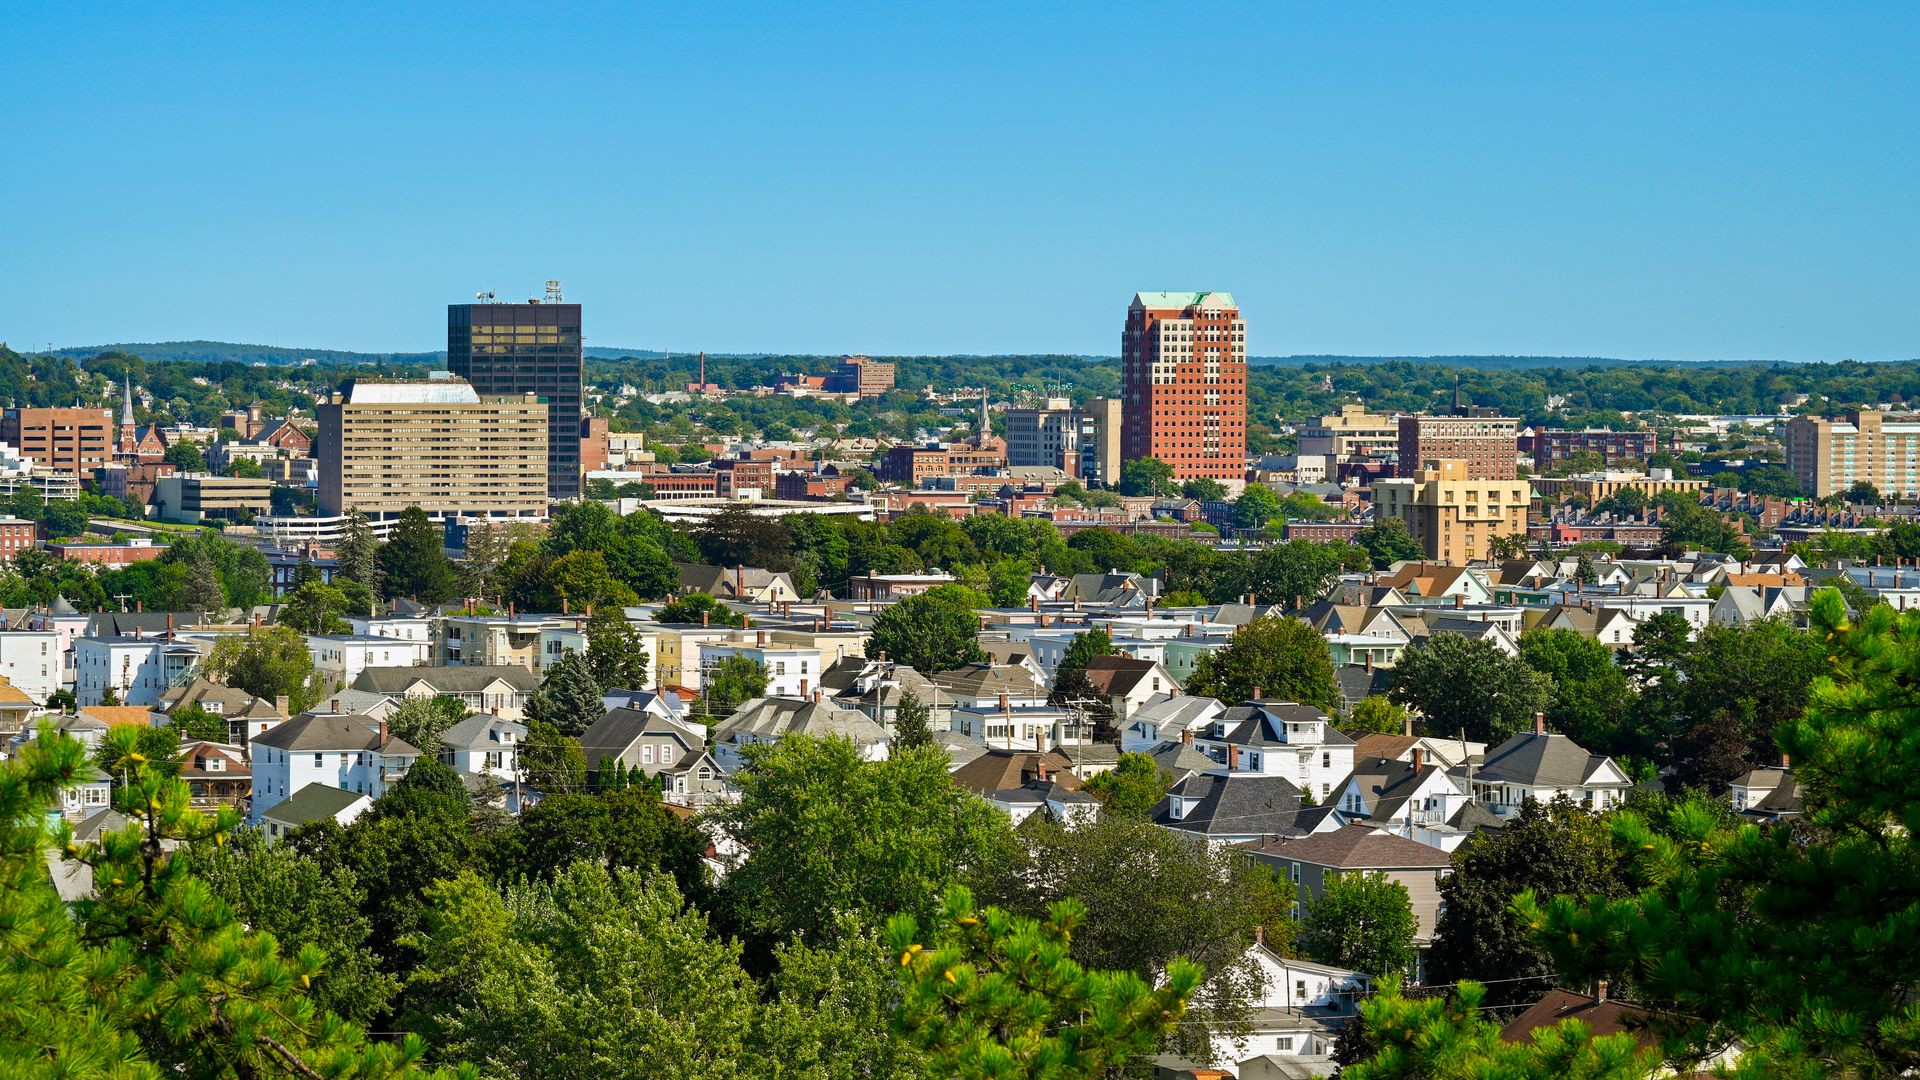
Manchester-Nashua, N.H., rose one spot year over year to rank second in April 2026, matching Springfield, Mass., exactly on viewer engagement: each market drew 3.6 times the national average views per property. The New Hampshire metro held a 24-day median time on market, one day slower than Springfield but still far ahead of the national pace. Its median listing price of $575,000 positioned it well above Springfield's but considerably below what buyers face in Boston, making it another outlet for demand spilling northward from the Massachusetts hub.
The April 2026 report noted that buyers in the hottest Northeast markets should be prepared to move quickly and stay attuned to how rate shifts affect their budget, a characterization that fits Manchester-Nashua directly. Demand in this corridor is intensifying, not stabilizing, as the ranking improvement year over year confirms. Days on market extended one day compared to the prior year, a negligible shift that leaves the metro firmly in fast-moving territory. The Northeast as a whole claimed 16 of the 20 spots in April's full hotness rankings, a lopsided distribution that reflects just how concentrated buyer activity has become in this region, and new listings in the Northeast rose 9.4% year over year in April, the strongest regional gain in the country.
A second New Hampshire market in the same top 10 reinforces the pattern. Concord, N.H., also appeared in the top 10 at rank ninth, with a $573,000 median listing price and a 30-day median time on market. Two New Hampshire metros competing in the same top 10 reflect the scale of buyer migration pressing northward from Massachusetts, expanding beyond Manchester-Nashua's established commuter corridor and reaching the state capital. Together, these two markets show that southern New Hampshire functions less as a discrete market and more as an extension of the demand zone radiating outward from Boston, a zone that widened further in April 2026 as Amherst Town-Northampton, Mass., jumped 13 spots year over year and Worcester, Mass., climbed five, both still ascending the rankings.

DutcherAerials / Getty Images
Hartford, Conn., ranked third in April 2026 and carried the highest viewer engagement of any market in the entire top 10: five times the national average views per property. No other top-10 market came close to that figure. The metro's median time on market stood at 25 days, five days faster than the prior year, a year-over-year acceleration that signals demand is still intensifying, with no sign of leveling off. Hartford's median listing price of $465,000 offered a significant discount to Boston while remaining accessible to buyers earning New England wages.
Hartford's position in the rankings reflects its geographic advantage. Springfield, Mass., sits 25 miles to the north. New York City lies roughly 100 miles to the south. The metro occupies the center of a dense economic corridor where buyers can access the employment markets of two major cities while avoiding the pricing of either. Connecticut's dominance of the top 20 — four markets from a single state, spanning price points from $442,000 to $807,000 — confirms that buyers are scanning the full range of the state's offerings and finding competition everywhere they look.
The five-times viewer ratio Hartford posted in April 2026 stands as a market-level indicator of scarcity. Five times the national average in viewer engagement signals that inventory relative to demand is acutely thin. Hartford's year-over-year rank movement of just one spot downward, from second to third, indicates the market held its competitive position almost perfectly from 2025 to 2026. Amherst Town-Northampton, Mass., jumped 13 spots year over year, and Worcester, Mass., climbed five, both markets ascending within the same Boston-adjacent zone that feeds Hartford's buyer pool, suggesting the affordability-driven migration expanding outward from Boston is still gaining momentum with no ceiling in sight. The high engagement, accelerating pace, and relative price accessibility make Hartford one of the most supply-constrained markets in the country.
DenisTangneyJr / Getty Images
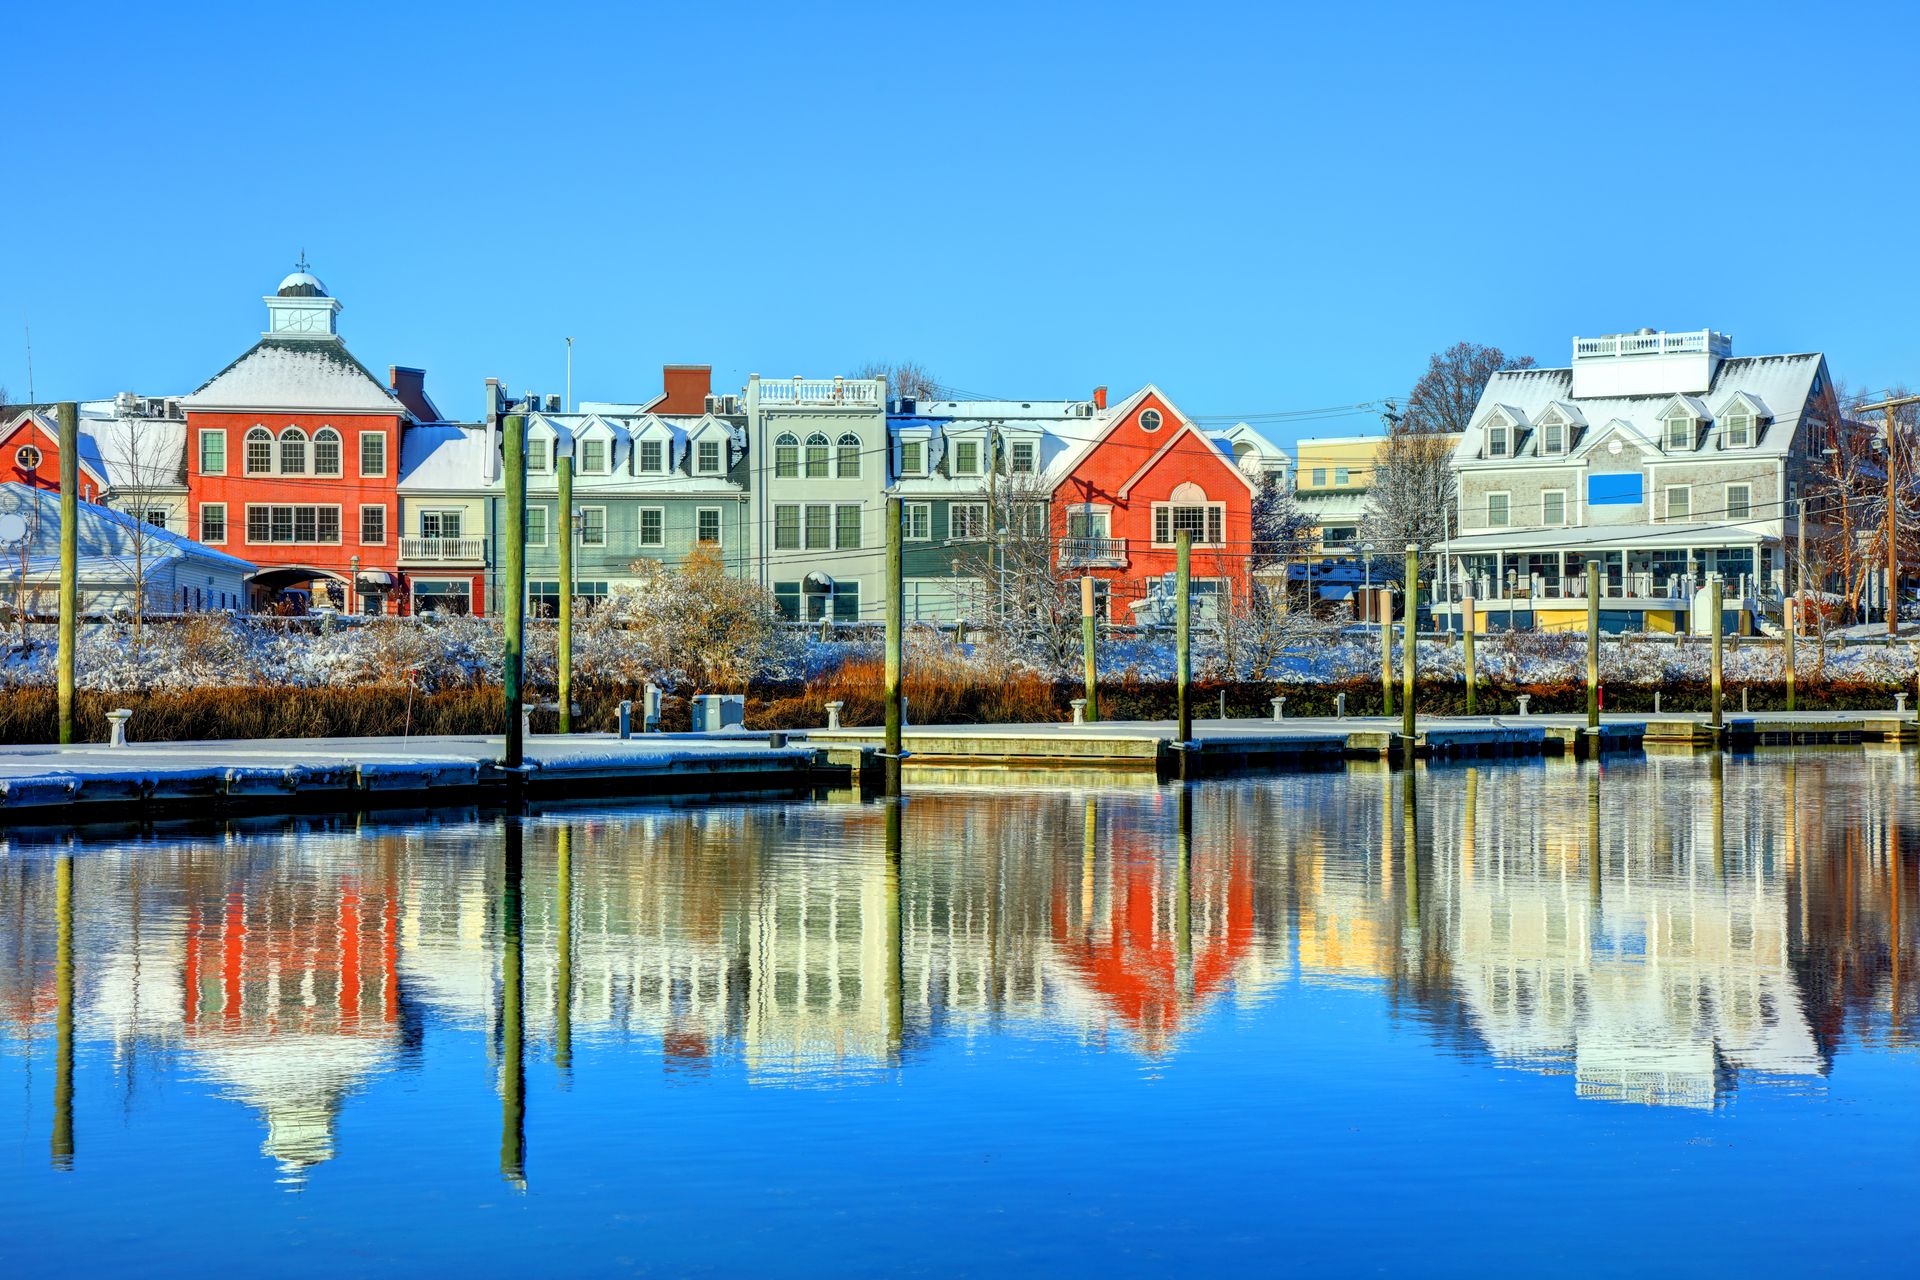
New Haven-Milford, Conn., tied for fourth in April 2026 with a median listing price of $442,000, 3.4 times the national average in viewer engagement, and a 31-day median time on market. The market arrived at that position after falling 14 spots year over year, the largest annual ranking decline of any metro in the top 10. A 14-spot drop is a significant shift in the competitive standings, yet New Haven still landed in a four-way tie at fourth, which illustrates how densely competitive this tier of the rankings has become.
Connecticut's lower-priced markets cluster around $442,000, and New Haven's position at that level represents the affordable anchor of the state's top-10 presence. Its 31-day median time on market was slower than Hartford's 25 days and the tied Rochester market's 25 days, suggesting buyers in New Haven faced slightly less acute urgency, though they still closed on homes more than three weeks faster than the national median. Days on market fell five days year over year, matching Hartford's acceleration exactly, meaning both Connecticut markets closed on homes more quickly in April 2026 than they did in April 2025 despite New Haven's drop in overall standing. The divergence between accelerating pace and declining rank reflects competition from other markets improving faster, not a retreat of demand within New Haven itself.
Yale University anchors New Haven's economy and gives the metro a workforce composition that differs from most similarly priced markets. Yale's institutional base provides steady employment demand and draws a graduate and professional population actively seeking ownership. Connecticut alone placed four markets in the top 20 in April 2026, and New Haven's presence among them — even after a 14-spot decline — confirms the state's continued hold on buyer attention. New Haven's viewer engagement of 3.4 times the national average leaves no ambiguity about the level of buyer interest the market continues to generate. The ranking decline is a statement about relative performance, not about the absolute level of competition a buyer entering this market will face.
DebraMillet / Getty Images
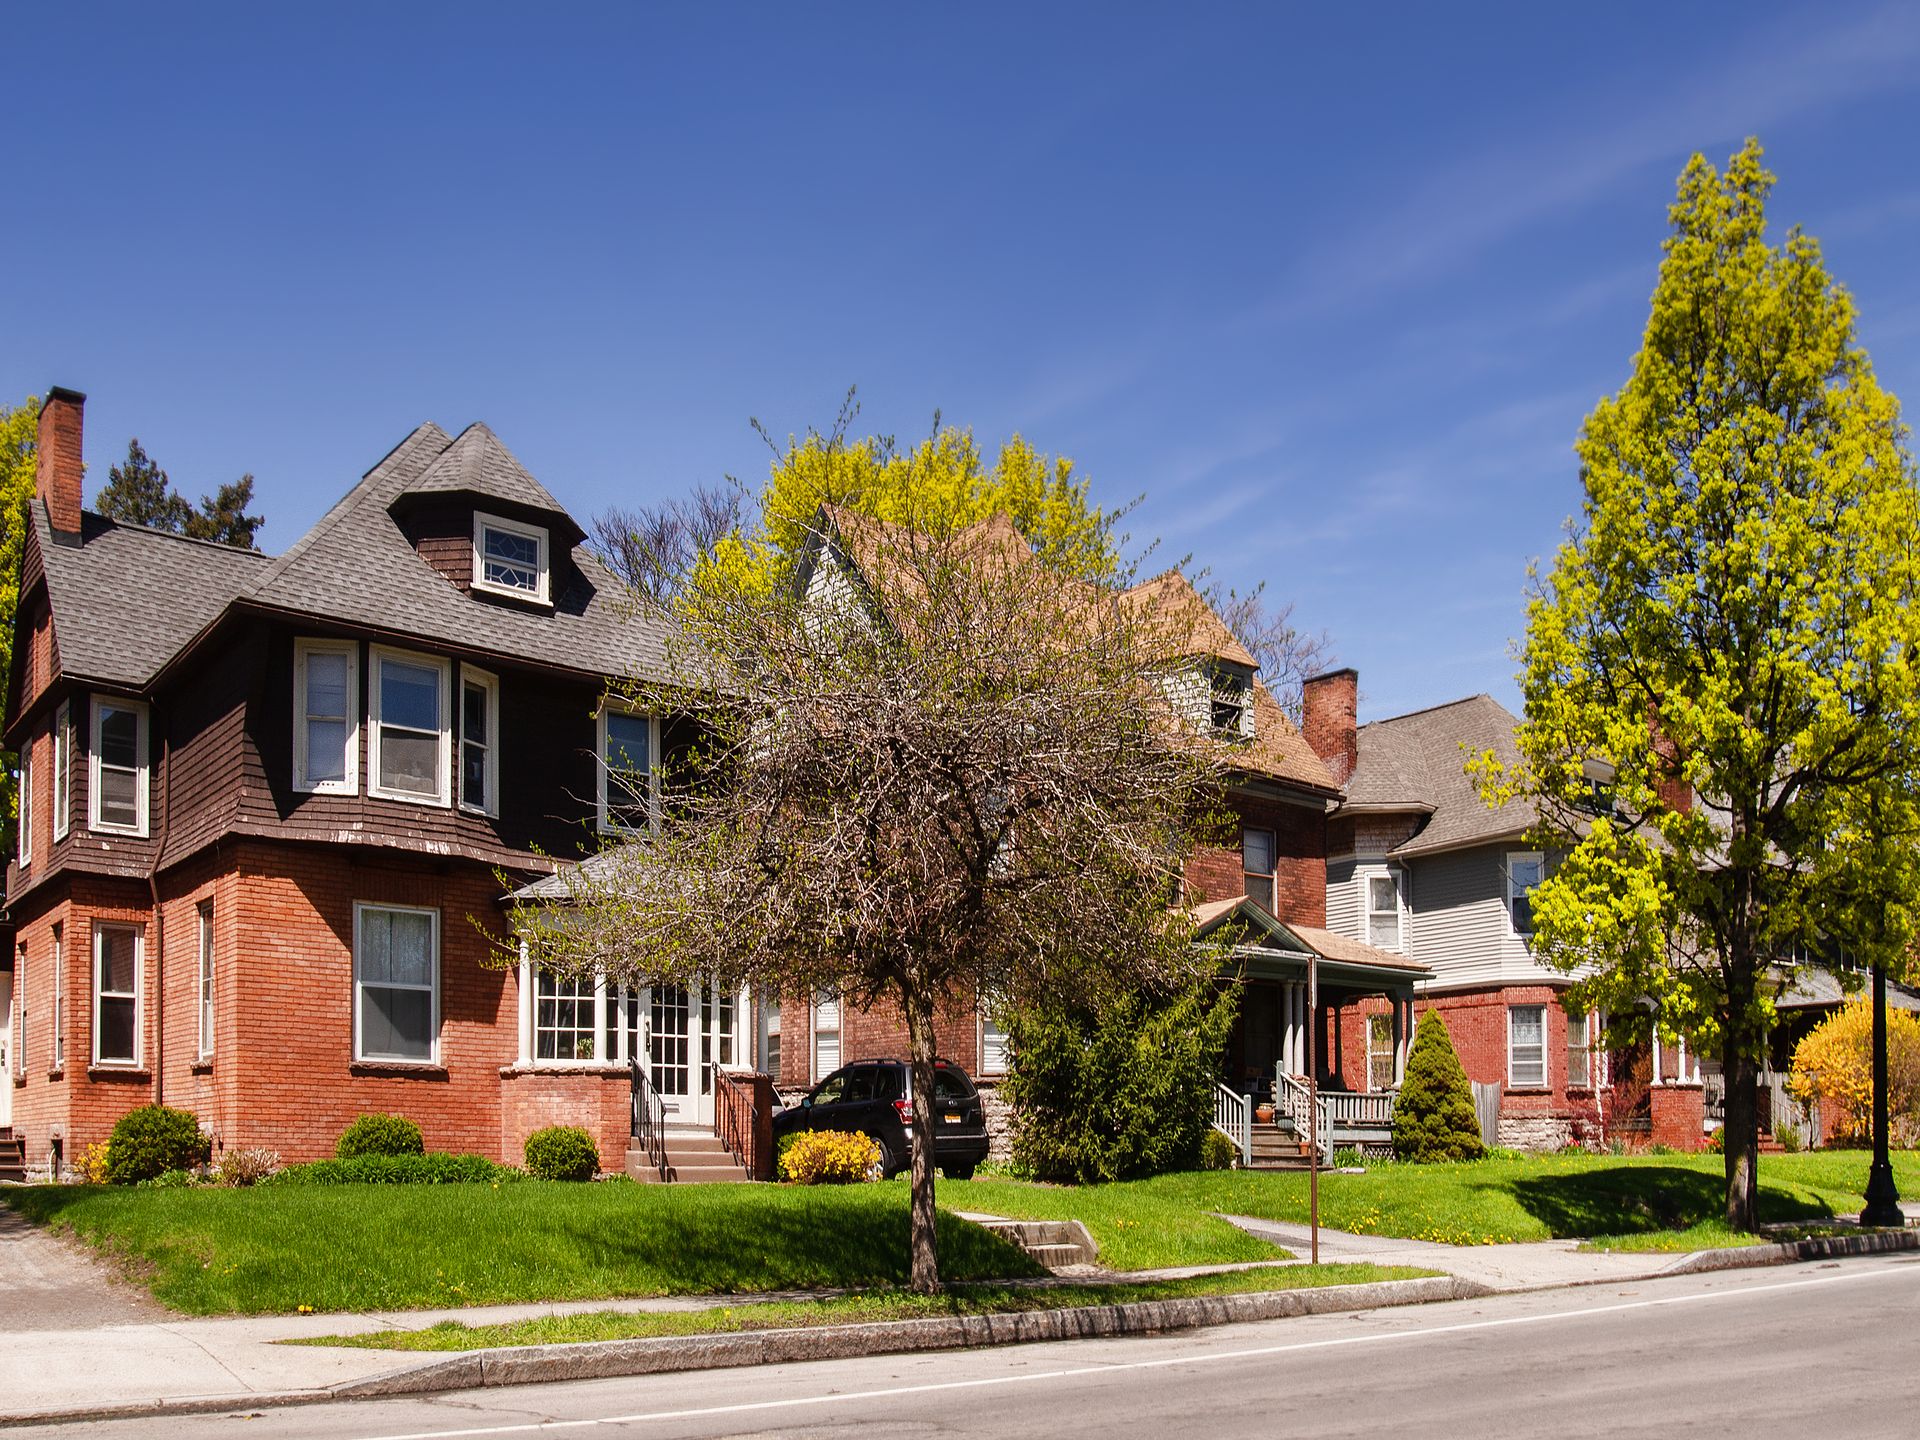
Rochester, N.Y., tied for fourth in April 2026 with a median listing price of $300,000, the lowest of any market in the top five and $65,000 below the next closest top-five market. The metro drew three times the national average views per property and posted a 25-day median time on market, two days faster than the prior year. Rochester's position in the rankings reflects buyer demand that is both broad and concentrated: broad enough to match the engagement of larger, higher-priced Northeast markets, and concentrated enough to push the typical home off the market in under a month.
Rochester operates within New York state but well outside New York City's price orbit, drawing buyers who need access to upstate economic activity without incurring downstate costs. The metro's year-over-year ranking decline of three spots represents a modest positional shift in a tier where every market continues to outperform the national average by a wide margin. Its days-on-market acceleration of two days year over year confirms the market tightened further from 2025 to 2026, moving in the opposite direction of what a declining rank might suggest.
The three-times viewer engagement ratio Rochester posted, tied with Kenosha, Wis., placed it at the lower end of the top-10 demand spectrum, but lower end in this group still means three times as many buyers per listing as the typical American market. Nationally, large metros attracted just 9.2% more views per listing than the national average in April 2026, a figure Rochester's three-times ratio dwarfs. The 25-day median time on market matched Hartford's exactly, and the two-day year-over-year improvement confirms the market tightened further in 2026. A $300,000 median listing price in a market running at this pace represents a narrowing window: buyers finding Rochester accessible now are competing against a growing pool who have reached the same conclusion.
Wirestock / Getty Images
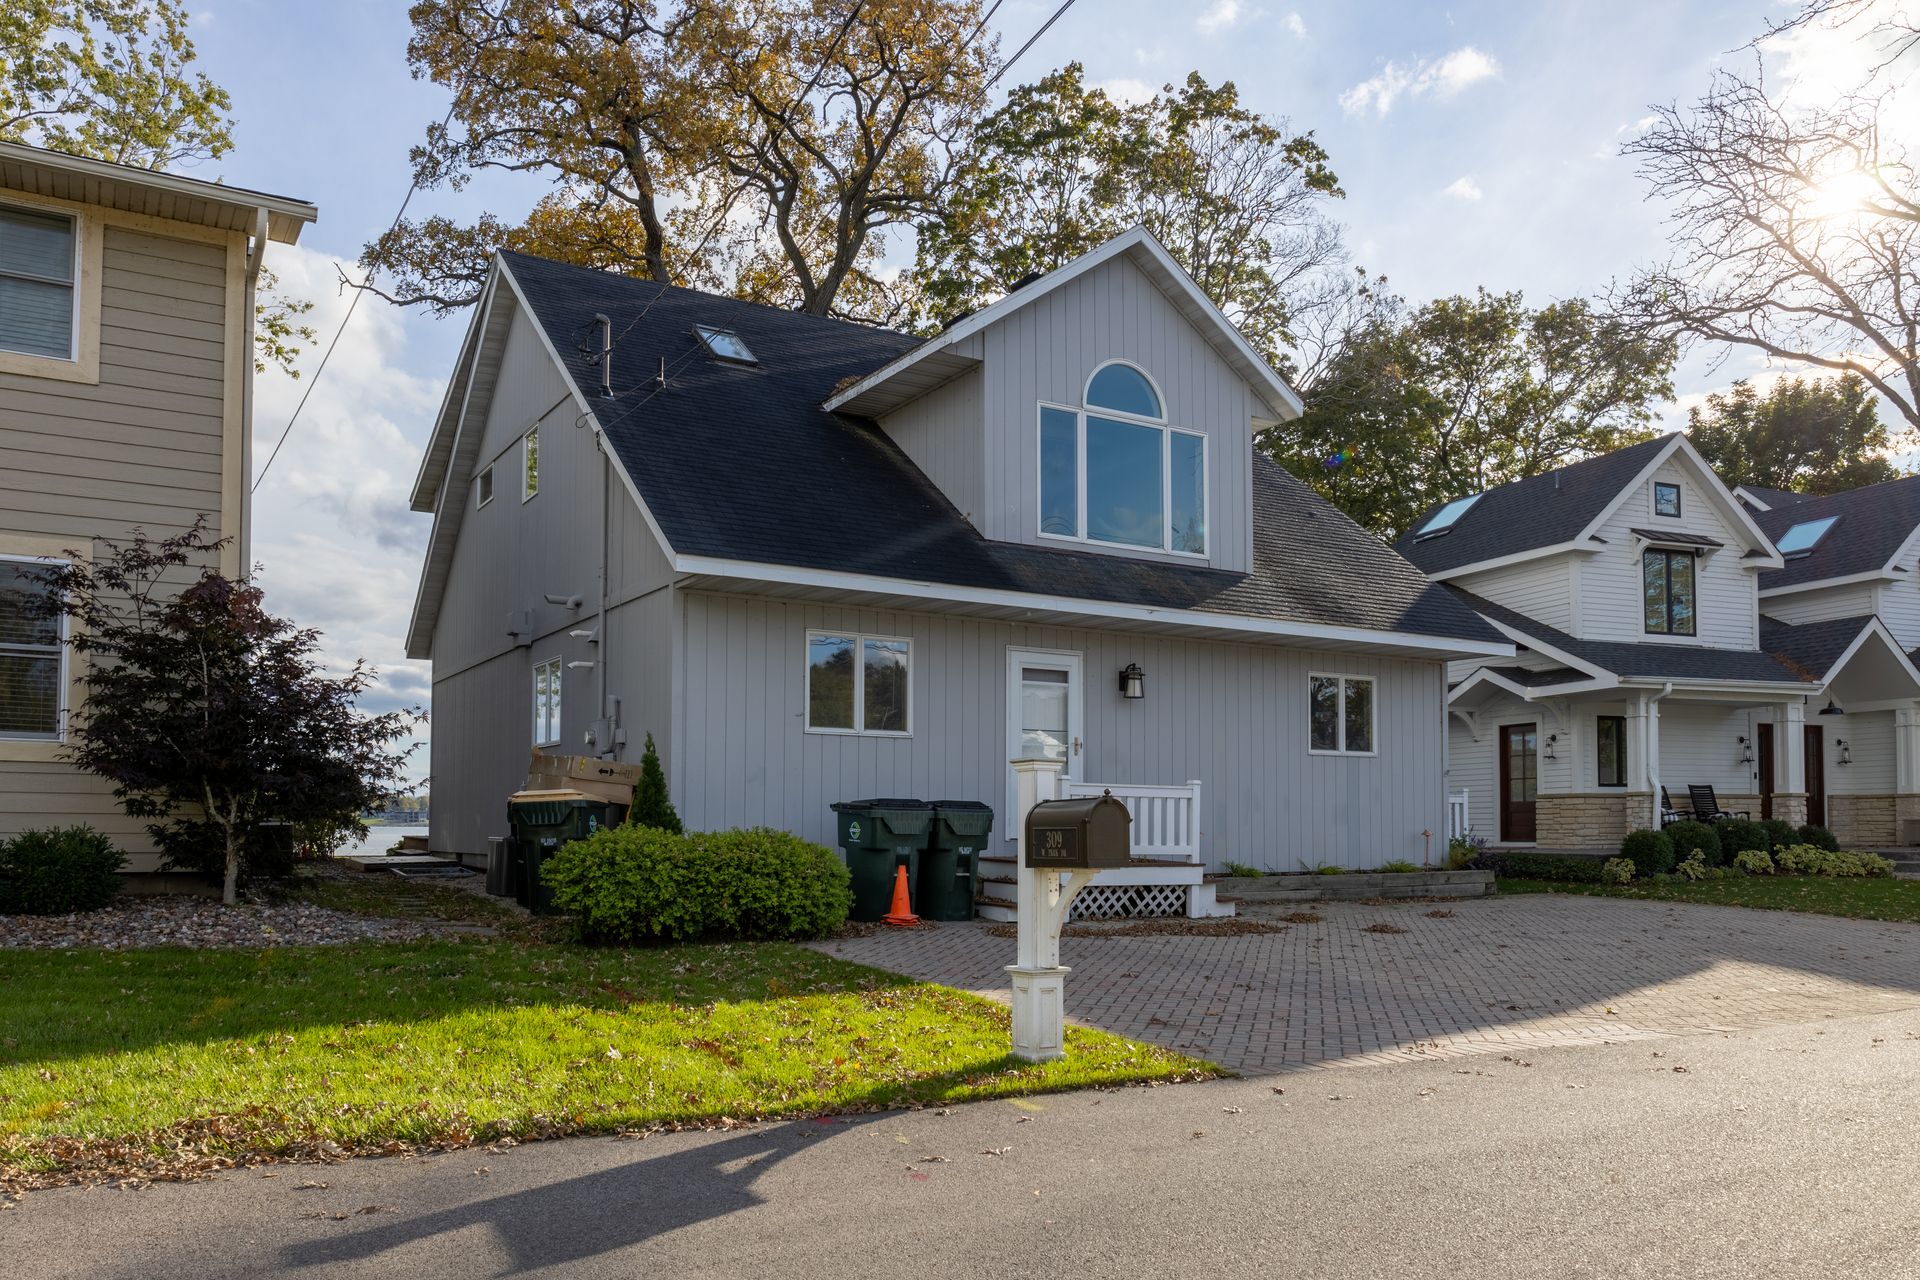
Kenosha, Wis., tied for sixth in April 2026 and rose two spots year over year, making it one of only two markets in the top 10 to improve its standing, and the only one to do so by more than one spot. Its median listing price of $420,000 matched Lancaster, Pa.'s exactly, and its 27-day median time on market extended three days compared to the prior year, the largest year-over-year days-on-market increase of any top-10 market. Kenosha stood as one of only two Midwest markets in the top 10, while the Northeast claimed the remaining eight positions.
Kenosha's geographic position drives its competitiveness. The city sits at the southern tip of Lake Michigan, roughly 60 miles north of downtown Chicago and 30 miles south of Milwaukee, making it one of the few markets in the top 10 that provides access to two major metropolitan economies simultaneously. Chicago's housing costs have pushed buyers outward along multiple corridors, and Kenosha's location and transit connections have made it a recurring destination for that overflow. The Midwest overall claimed just five of the 20 spots in April's full hotness rankings compared to the Northeast's 16, making Kenosha's two-spot gain stand out against a regional backdrop of relative retreat.
The three-day extension in days on market, from roughly 24 days the prior year to 27 days in April 2026, is the one metric that complicated Kenosha's otherwise improving picture. Kenosha's three-day slowdown likely reflects the two-spot ranking gain itself: as more buyers discovered the market, the competitive field widened slightly, producing marginally longer decision timelines. Kenosha's overall ranking improvement against a field where most Northeast markets either held position or fell suggests the Midwest market is genuinely closing the engagement gap with its regional counterparts. Midwest new listings rose 6.6% year over year in April 2026, a meaningful increase in supply that, despite the added inventory, did not cool demand enough to reverse Kenosha's upward movement in the standings.
DenisTangneyJr / Getty Images
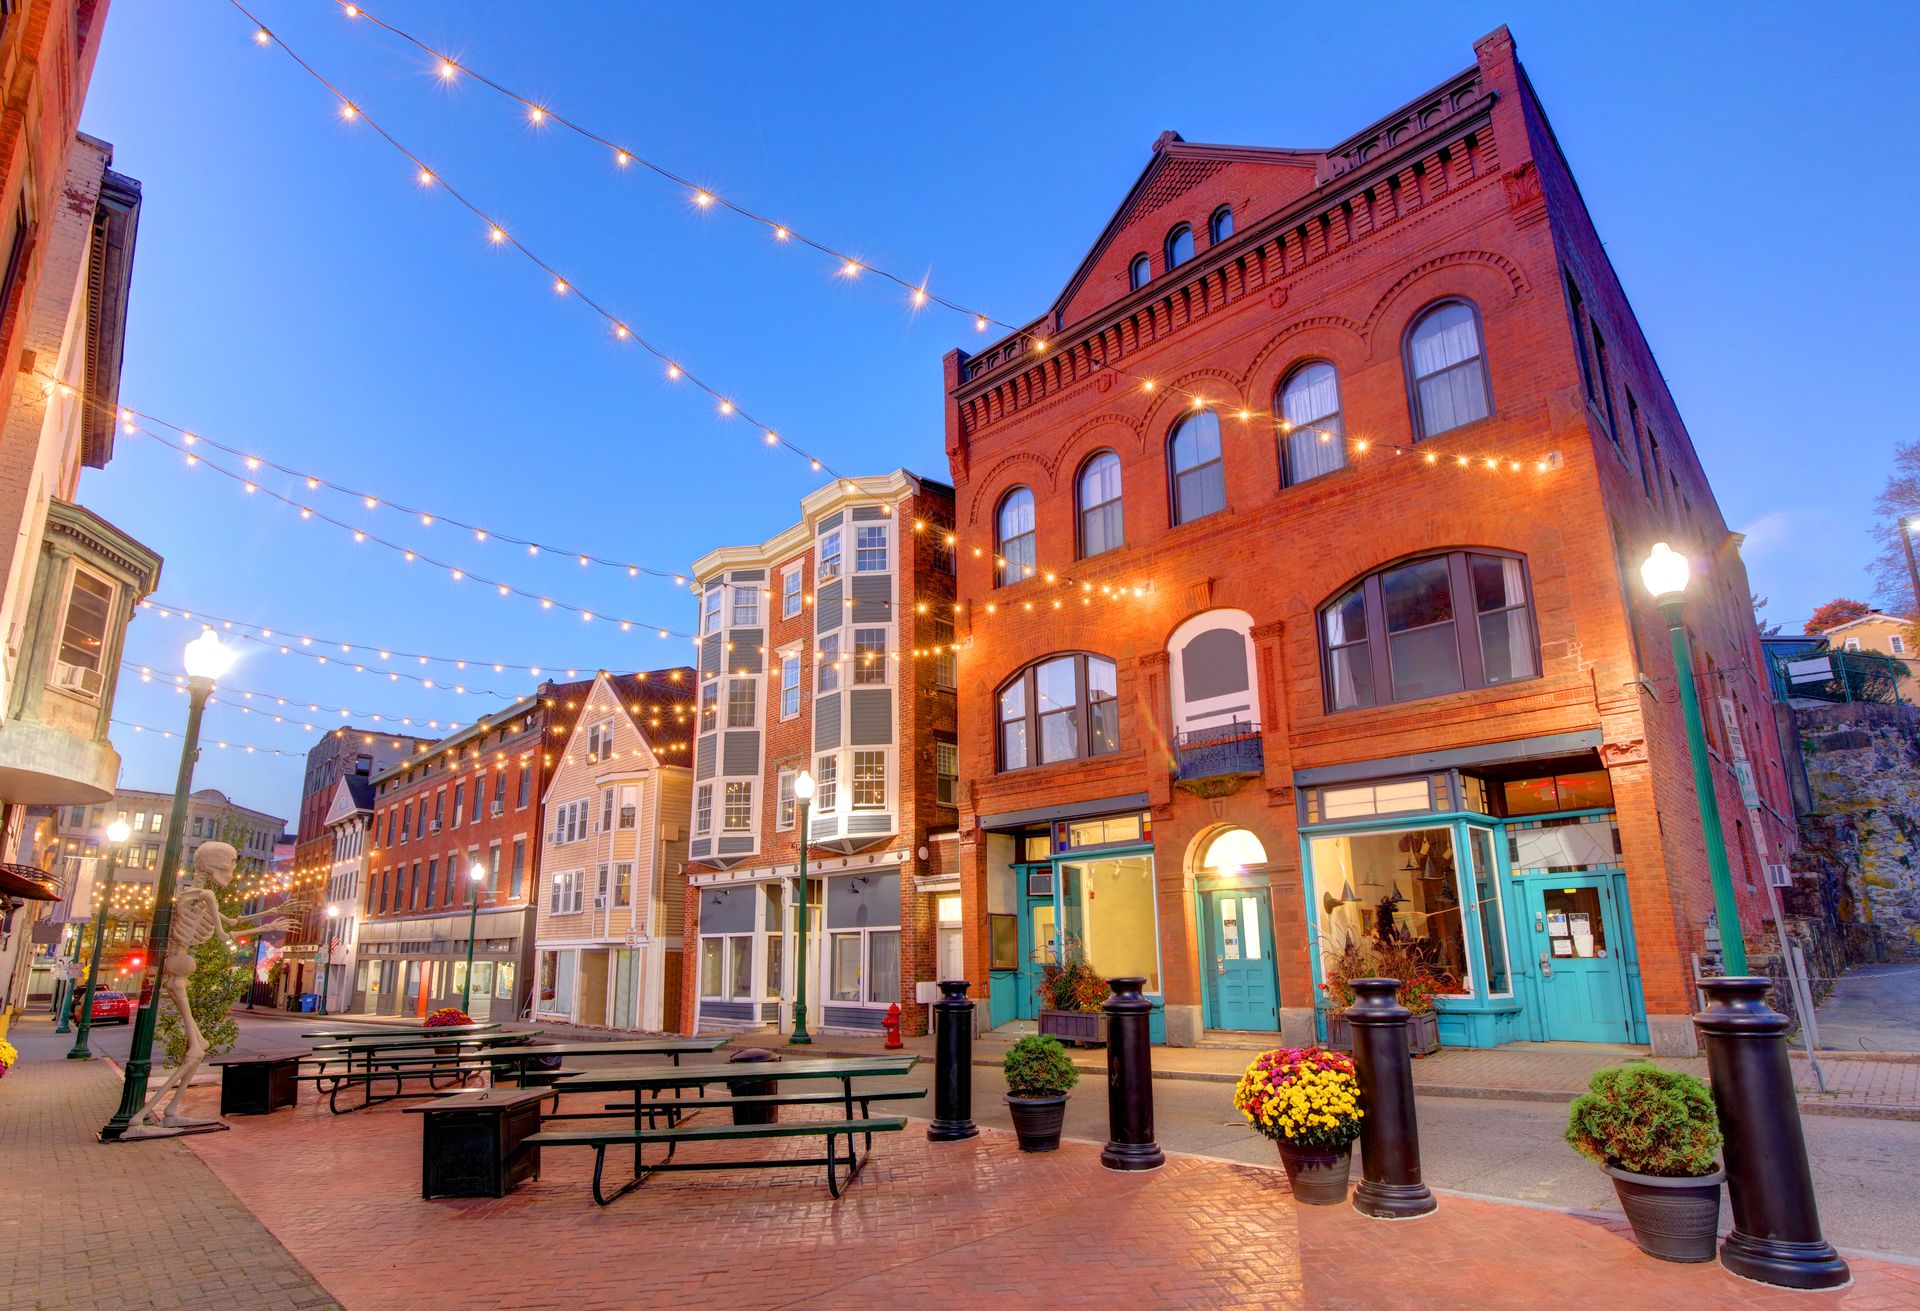
Norwich-New London, Conn., tied for sixth in April 2026, drawing 3.4 times the national average views per property and posting a 31-day median time on market, one day slower than the prior year. The metro's median listing price of $479,000 made it the most expensive Connecticut market in the top 10 outside of Bridgeport-Stamford-Norwalk. Its six-spot year-over-year decline placed it among the markets that lost the most competitive ground in the top 10 from 2025 to 2026, though it arrived at a tie for sixth despite that slide.
Southeastern Connecticut's position at the corner where the Thames River meets Long Island Sound gives the market access to coastal amenities unavailable in the state's inland cities. The area also sits within commuting range of Hartford to the northwest and Providence to the northeast, adding employment optionality that purely coastal markets often lack. The $479,000 median price reflects that dual accessibility, sitting above New Haven's $442,000 and Hartford's $465,000 but remaining well below the $807,000 recorded in Bridgeport-Stamford-Norwalk. Connecticut's four top-20 markets together span a $365,000 price range, and Norwich-New London occupies the upper-middle tier of that spread.
The 31-day median time on market, tied with New Haven-Milford for the slowest pace among the top six markets, signals that buyers in Norwich-New London face somewhat less compressed decision windows than in Hartford, Manchester-Nashua, or Springfield. A single day's slowdown year over year is not a meaningful deterioration on its own, but the six-spot ranking decline confirms that other markets outpaced Norwich-New London's demand growth from 2025 to 2026. New listings across the Northeast rose 9.4% year over year in April 2026, which added more options to buyers scanning the region. In a market already carrying a 3.4× viewer engagement ratio — matching New Haven-Milford's exactly — additional supply can widen decision timelines without eliminating the fundamental scarcity that keeps Norwich-New London in the top 10.
halbergman / Getty Images
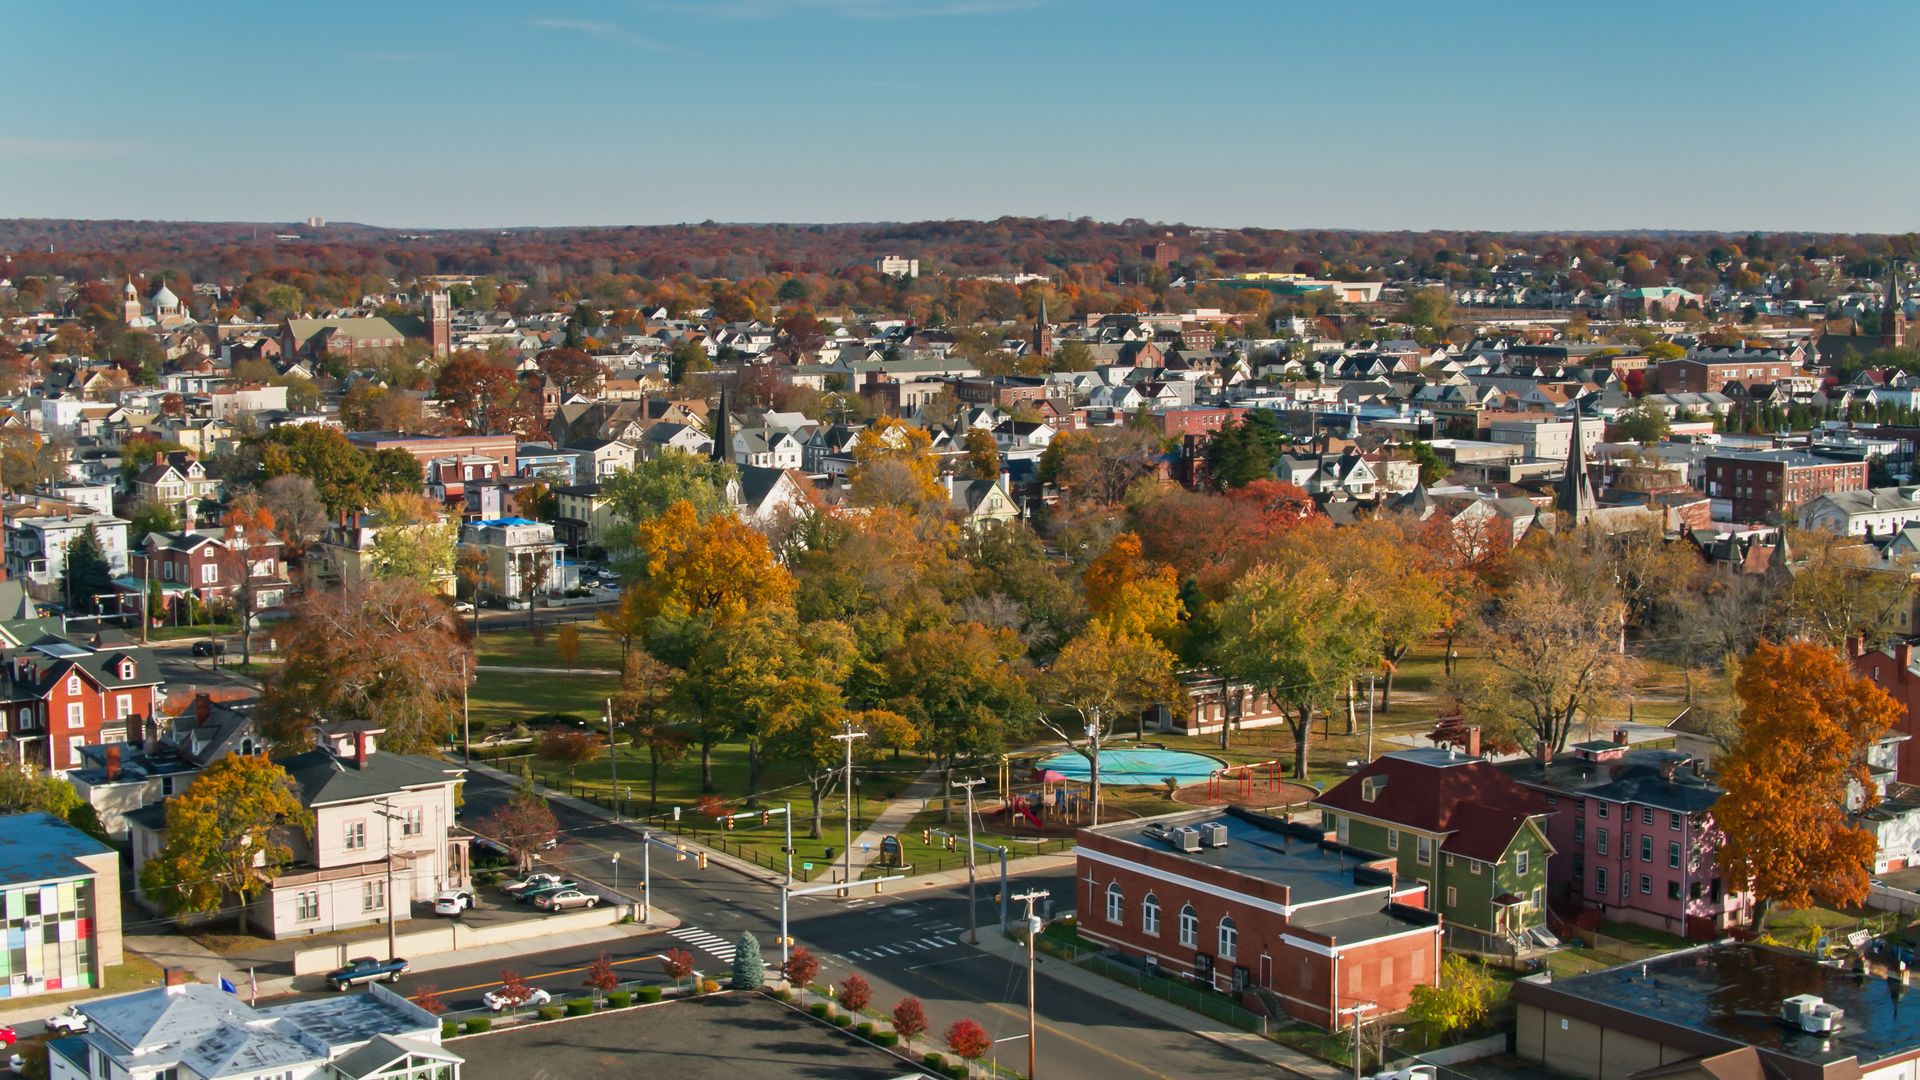
Bridgeport-Stamford-Norwalk, Conn., ranked eighth in April 2026 with a median listing price of $807,000, the only top-10 market priced above $800,000 and the highest median of any market on the list. The metro drew three times the national average views per property and posted a 27-day median time on market, two days faster than the prior year. Its year-over-year ranking change of one spot downward left it nearly stationary in competitive position from 2025 to 2026.
Bridgeport-Stamford-Norwalk's presence in the top 10 at $807,000 initially appears to contradict the affordability narrative that explains most of the list. The context that resolves that contradiction is New York City immediately to the southwest. New York-Newark-Jersey City ranked 133rd nationally in April 2026, and its housing costs have pushed buyers who need physical proximity to the financial and media sectors that anchor Fairfield County employment northward into Connecticut. Stamford functions as a New York City suburb with its own office market, drawing buyers who earn New York wages and treat $807,000 in Bridgeport-Stamford-Norwalk as a comparative value against Manhattan or Brooklyn pricing. Average listing prices in large U.S. metros fell 1.8% year over year in April 2026, tracking close to the national norm, a softening that New York's own metrics reflect and that accelerates the outward flow of buyers into Connecticut.
Connecticut's four top-20 markets collectively span a price range from $442,000 to $807,000, a spread of $365,000 within a single state. Connecticut's $365,000 price spread confirms demand pressure runs through every accessible price tier, not just the affordable end. Bridgeport-Stamford-Norwalk's days-on-market acceleration of two days year over year, from roughly 29 days to 27 days, confirmed the market absorbed buyer interest at a pace that exceeded even its own prior year. The one-spot ranking decline moved it to eighth, a negligible positional shift that leaves the metro's fundamental competitive conditions unchanged.
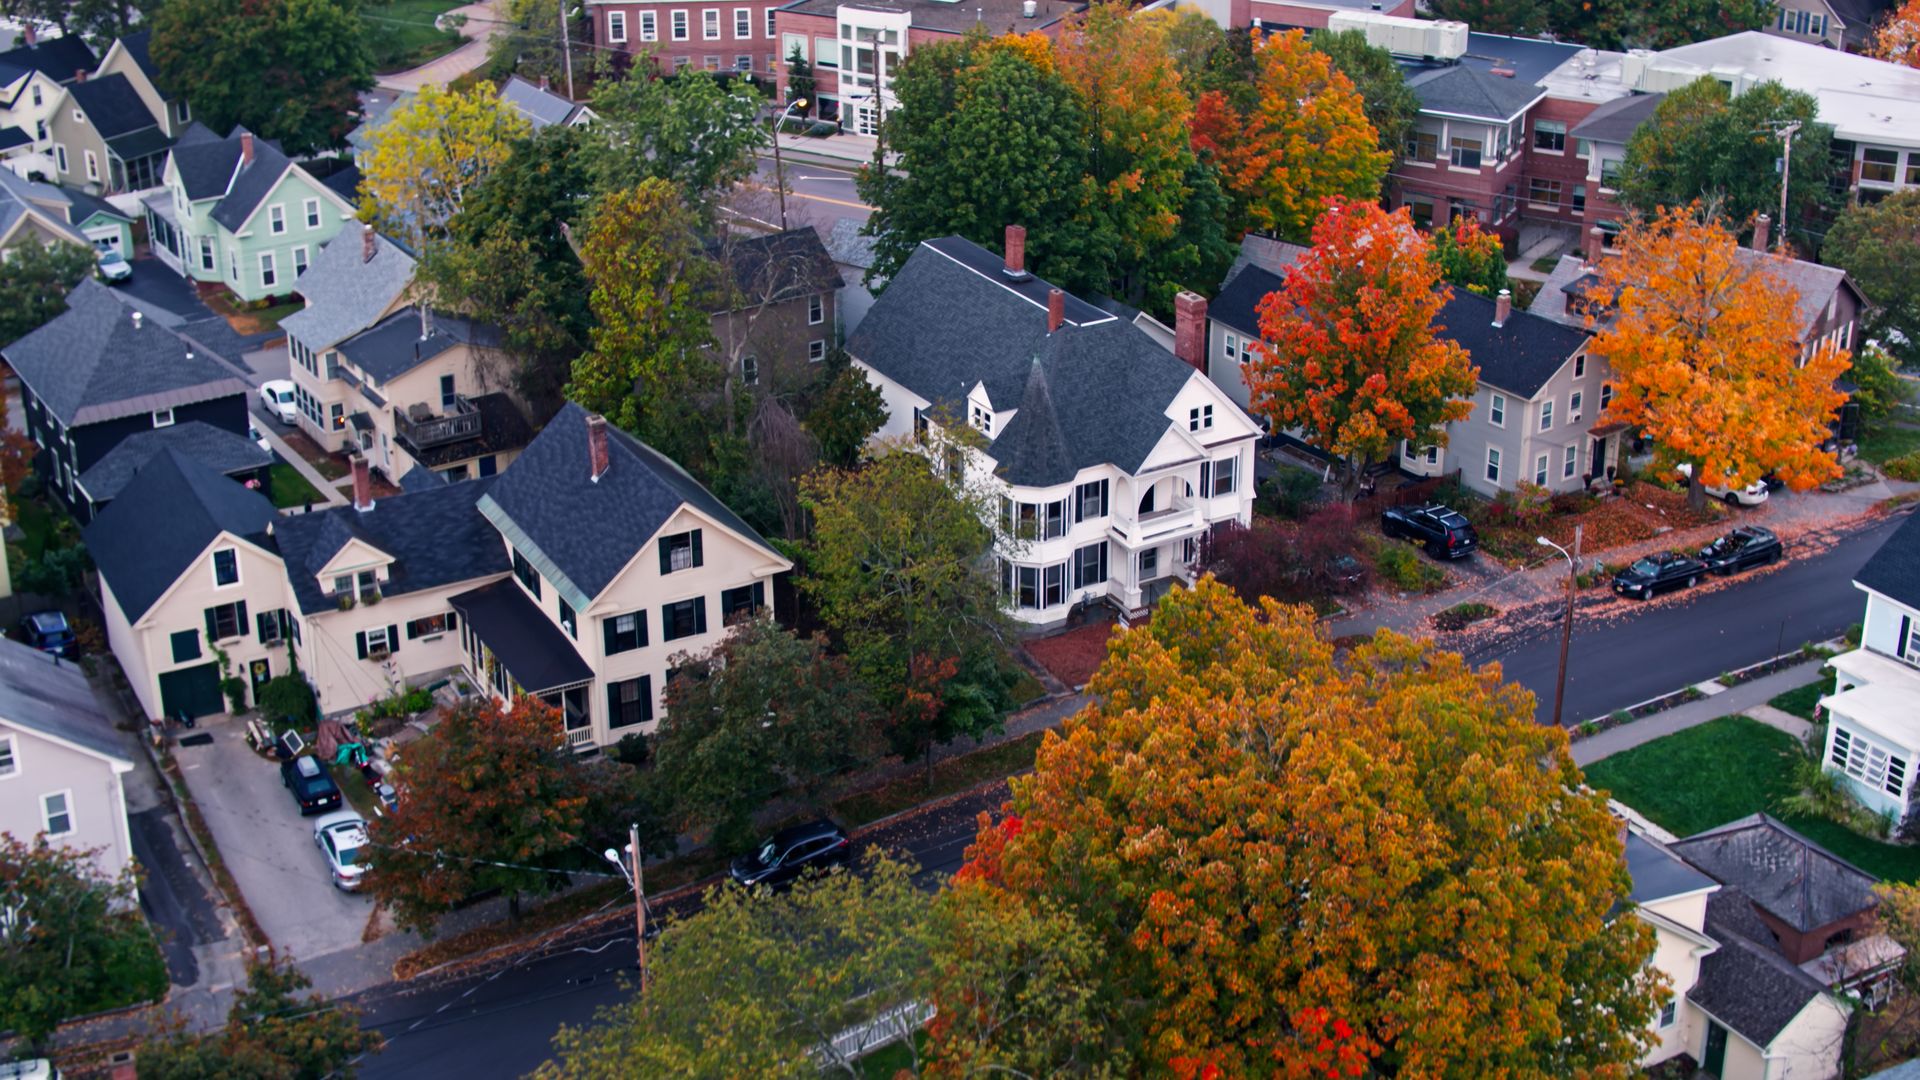
halbergman / Getty Images
Concord, N.H., rose one spot year over year to rank ninth in April 2026, drawing 3.2 times the national average views per property and posting a 30-day median time on market. Its median listing price of $573,000 sat $2,000 below Manchester-Nashua's $575,000, effectively the same price tier, with both markets serving buyers priced out of Massachusetts. Concord's year-over-year days-on-market change of zero indicated the market's pace held exactly steady from 2025 to 2026, a contrast to the acceleration visible in most other top-10 markets.
New Hampshire's state capital carries employment anchored in government, healthcare, and education, sectors that generate stable professional-class demand for homeownership. Concord sits roughly 75 miles north of Boston, extending the commuter corridor well beyond Manchester-Nashua's more established position and drawing buyers willing to accept a longer drive in exchange for more accessible prices. The simultaneous appearance of both Concord and Manchester-Nashua in the top 10 confirms that the absorption of Massachusetts demand into southern New Hampshire has expanded to include the state capital, not just the state's largest city. New listings across the Northeast rose 9.4% year over year in April 2026, yet Concord's pace held steady and its ranking improved, indicating that the additional supply was not sufficient to absorb the buyer interest flowing into the market.
The 3.2× viewer ratio Concord posted in April 2026 sat above Rochester's and Lancaster's but below Hartford's and the two Springfields' engagement levels. Its 30-day median time on market was faster than New Haven-Milford's, Norwich-New London's, and every market outside the top seven, placing Concord in the middle of the top-10 speed distribution. The one-spot year-over-year improvement mirrors Manchester-Nashua's precisely, suggesting the two New Hampshire markets are moving together, both gaining ground in the national rankings at the same time and for the same underlying reasons, as the demand wave from Massachusetts continues spreading northward with no clear ceiling in sight.

DenisTangneyJr / Getty Images
Lancaster, Pa., ranked 10th in April 2026 with a median listing price of $420,000, 2.9 times the national average views per property, and a 27-day median time on market. Its year-over-year ranking decline of one spot was the smallest drop of any market that fell in the top 10, and its days-on-market figure held exactly steady year over year. Lancaster stood as the only Pennsylvania market in the top 10 and one of the few non-New England markets in the upper tier of the rankings.
Lancaster's position in the rankings reflects its place within the Mid-Atlantic affordability chain. Philadelphia's housing market sits to the east along established transit and highway corridors, drawing buyers who need regional access without Philadelphia prices. Lancaster's $420,000 median provides that access point, and the 27-day median time on market confirms buyers are converting interest into offers at a pace well above the national norm. The 2.9× viewer engagement ratio placed Lancaster at the lowest end of the top 10 but still nearly three times the national average, a figure that would rank as extraordinary in most of the country. Nationally, large metros attracted just 9.2% more views per listing than the average, a measure Lancaster's 2.9× ratio far exceeds.
The steadiness of Lancaster's metrics year over year distinguishes it from most of the top 10. Most ranked markets either accelerated their pace or declined in ranking. Lancaster did neither at a meaningful scale. Days on market held flat, ranking fell one spot, and viewer engagement remained near the top of the national distribution. Lancaster's stability suggests the market has reached a competitive equilibrium at a price point where buyer demand and available supply have settled into a sustainable but intense balance. The market offers no sign of cooling and none of the sharper deterioration visible in markets such as New Haven-Milford, which fell 14 spots over the same period. National inventory rose 4.6% year over year in April 2026, and list prices fell for the sixth consecutive month, conditions that have not disrupted Lancaster's competitive standing in the slightest.