
Rent affordability depends on income, not just price. WalletHub ranked 182 U.S. cities to find where paychecks stretch furthest

FotografiaBasica / Getty Images
Rent has become one of the heaviest financial burdens of the past decade in the U.S. Rental costs climbed by more than 50% over the last 10 years, according to the Federal Reserve's Consumer Price Index, tracking the rise in home prices. Wages did not keep pace, leaving millions of renters to balance stagnant earnings and rising housing bills.
In the country's most affordable cities, rent consumes as little as 15% of the median household income. In the least affordable, it takes nearly 34%. For a household earning the local median wage, the difference amounts to thousands of dollars a year — money that could build an emergency fund, pay down debt, or accumulate toward a home purchase.
Personal finance website WalletHub measured this relationship across more than 180 U.S. cities, dividing median annual gross rent by median annual household income in each location. The resulting ratio captures something raw price comparisons cannot: whether local wages are strong enough to absorb housing costs, or whether renters face pressure regardless of what their lease says.
The cities that fare best are not always the ones with the cheapest apartments. A city with low rents but lower wages can impose just as heavy a burden as a pricier market with strong salaries. The reverse also holds. Several cities on the list carry above-average rents but still score well because local incomes keep pace. The Midwest and Great Plains dominate the top of the table, but surprises appear elsewhere, too.
Below are eight places where renters face the most favorable conditions.

halbergman / Getty Images
No city in WalletHub's study outperforms Bismarck, North Dakota, where residents devote just 15.29% of their median household income to rent. At the other end of the table, Miami's ratio reaches 33.77% — more than double Bismarck's figure. The distance between those two numbers defines the full range of what affordability can mean in the U.S. today.
Bismarck's edge comes from a combination that is harder to achieve than it appears. The city's median annual gross rent comes in 16th lowest among all cities examined — well below the national midpoint, but not the cheapest in absolute terms. Its median household income is 80th highest, placing it squarely in the middle of the national distribution. Neither number is extreme on its own. Together, they produce a rent-to-income ratio that no other city can match.
Low-rent cities fall into a trap Bismarck avoids. Cheap apartments lose their advantage when local wages are even lower. Its labor market generates enough income to make moderately priced housing feel genuinely manageable — not merely cheap on a spreadsheet.
For renters weighing where to live, Bismarck's result captures a principle that sticker-price comparisons miss entirely. Affordability is a ratio, not a dollar figure. A $900 apartment in a city where the median household earns $35,000 is harder to carry than a $1,200 apartment where earnings reach $60,000. Bismarck strikes the balance more cleanly than any other city in the study.
Denis Tangney Jr. / Getty Images
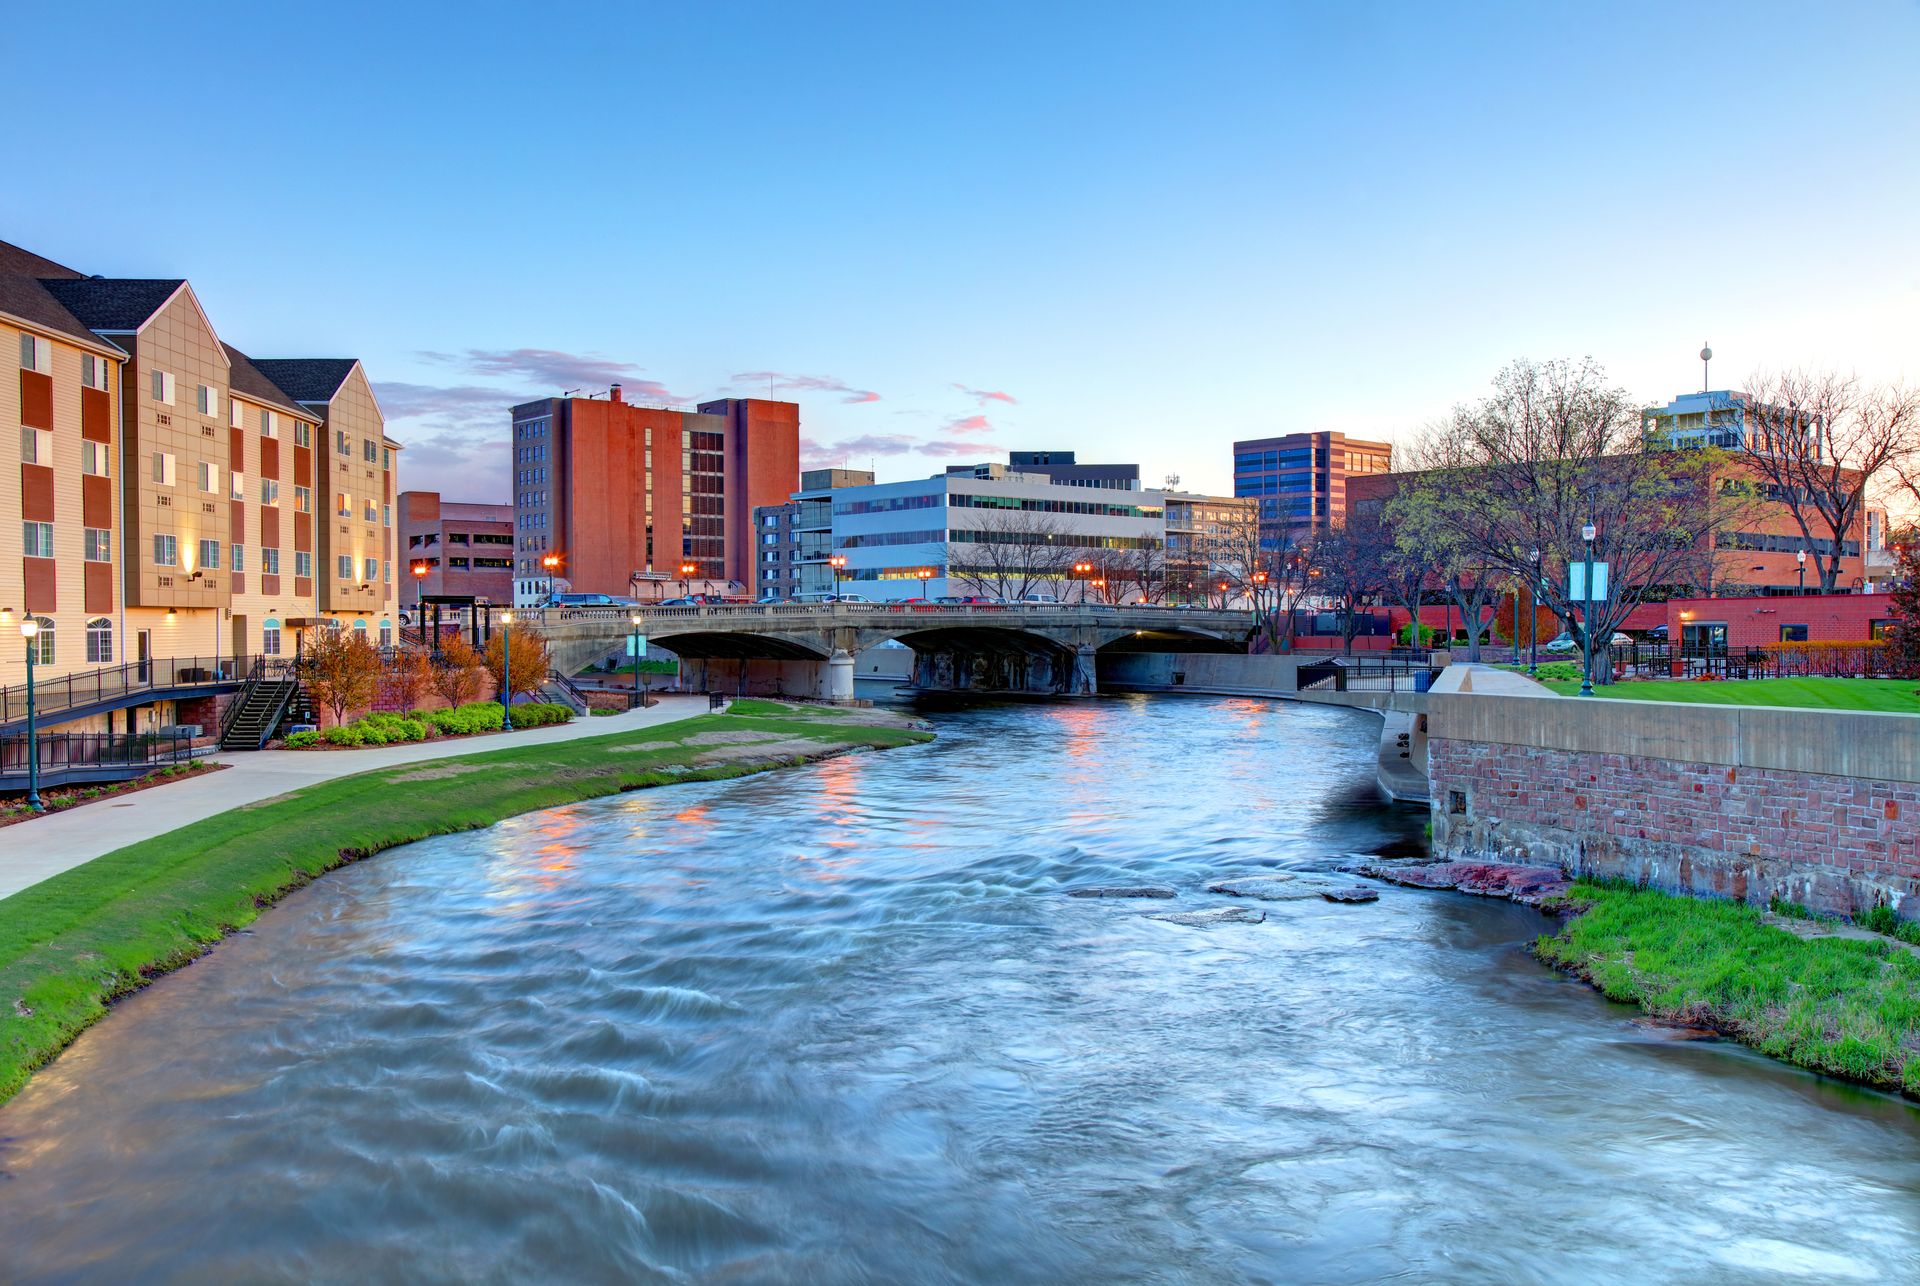
Wages, not cheap rent alone, explain why Sioux Falls, South Dakota, holds second place with a ratio of 16.35%. The city's median annual gross rent comes in 20th lowest nationally — competitive but not exceptional. What keeps the ratio tight is its 86th-highest median household income, which sits near the middle of the national distribution and provides enough earning power to absorb the cost.
The comparison with first-place Bismarck is instructive. Sioux Falls is the 20th cheapest for rent, versus Bismarck's 16th, and the 86th highest for income, versus Bismarck's 80th. Neither gap is wide. The modest but consistent advantage Bismarck holds on both counts separates the two by just over one percentage point.
In practice, the gap between those two cities matters less than the gap between both of them and the rest of the table. At a time when many U.S. metros extract a third of household income through rent, Sioux Falls' 16.35% leaves substantial room for saving, investing, or covering other household costs. The proportion of a paycheck that goes to housing governs everything else in a household budget. In Sioux Falls, it stays low.
The city's standing also reflects a broader pattern in the study. Markets with incomes at or above the midpoint of the national distribution and rents below the median consistently outperform markets that offer cheap housing without the wage base to match it.

Denis Tangney Jr. / Getty Images
On wages alone, Cedar Rapids, Iowa, would not appear on a list of renter-friendly cities. Its median household income is 105th — in the lower half of the national distribution — but it is also 10th cheapest in median annual rent among all cities in the study. The result is a ratio of 16.48%, the third lowest in the study.
Cedar Rapids demonstrates something the top cities illustrate in different ways: As much as income matters, a low enough rent can compensate for a modest wage base. No other city in the study carries a rent figure that low alongside an income position that far down the distribution and still finishes in the top five.
Conventional housing coverage focuses on rising rents as the primary threat to affordability. Cedar Rapids shows that a city can absorb a middling income level if its rental market stays genuinely cheap. A household earning the local median devotes less than one-sixth of its income to housing — a proportion that leaves room for saving, debt repayment, and the financial flexibility that tighter markets deny.
The city's profile also points to where affordability gains are most durable. Cities that hold the line on rent in absolute terms, without depending on income growth to offset rising costs, give renters a more stable foundation. Cedar Rapids has maintained that position by keeping its rent figure in the bottom 10 of a 180-plus city study.

Posnov / Getty Images
Just four cities in WalletHub's study post a rent-to-income ratio below 17%. Charleston, West Virginia, is one of them at 16.56%. The spread across those four cities is narrow — less than 1.3 percentage points separate first-place Bismarck from fourth-place Charleston. That compression signals a cluster of markets where housing costs have remained static.
WalletHub measured affordability through a single metric: median annual gross rent as a share of median annual household income. That ratio cuts through the noise surrounding housing debates — absolute price levels, regional cost-of-living indexes, square footage comparisons — and asks the only question that matters to a renter making monthly decisions. Can the local labor market support the local rental market without squeezing household budgets?
Charleston's answer is yes. Its position near the floor of the rent-to-income distribution means renters there retain a far greater share of their earnings than counterparts in cities further down the table. At the unaffordable end of the study, the least favorable markets demand more than twice the income share Charleston renters pay.
For anyone evaluating relocation on the basis of housing costs, Charleston's result carries weight. Charleston falls in the top 2% of the study — a distinction that translates into real financial room for the households that live there.
Denis Tangney Jr. / Getty Images
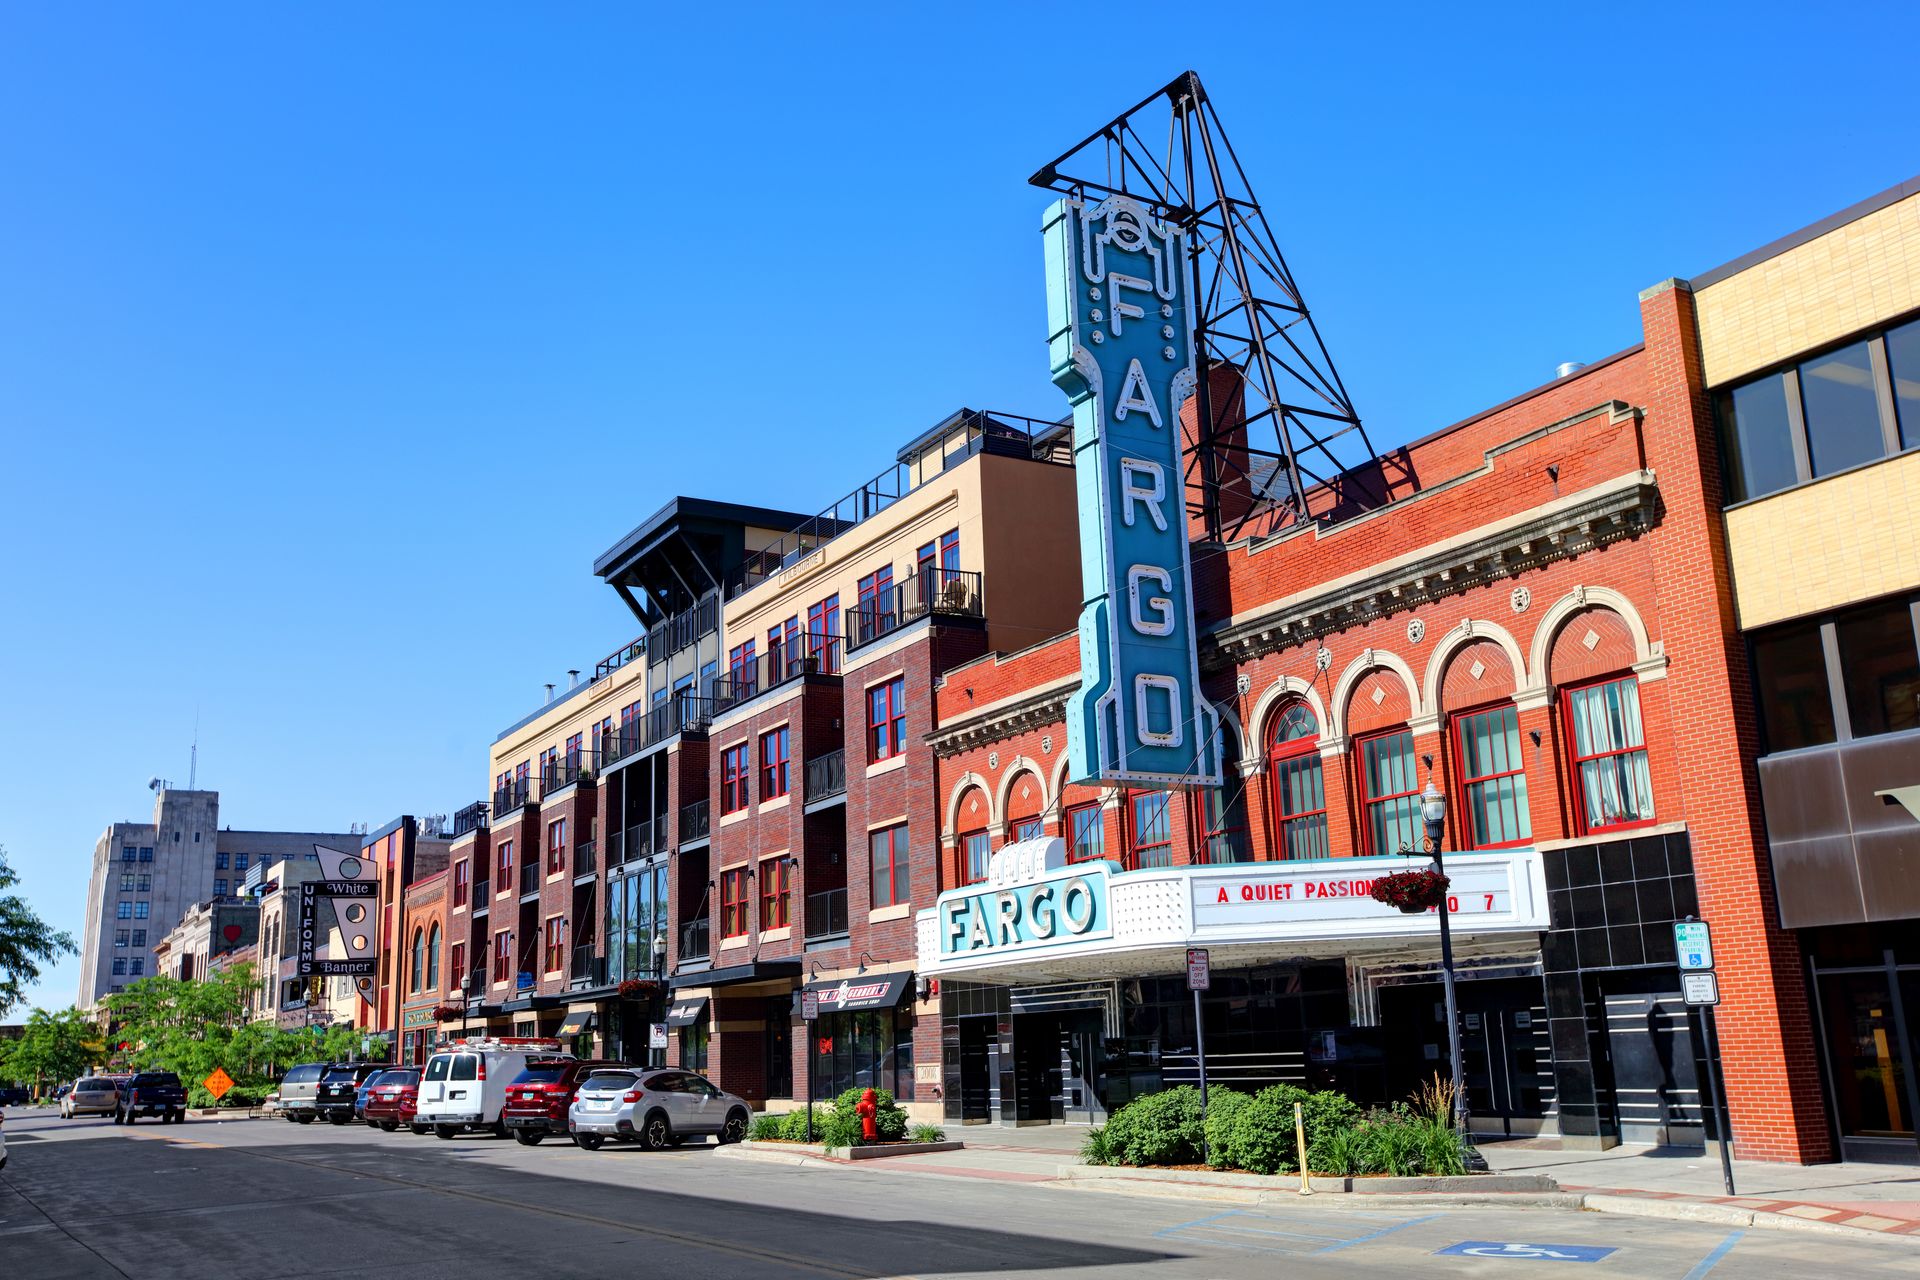
North Dakota sweeps two of the top five spots in WalletHub's study. Bismarck leads at 15.29%. Fargo, the state's most populous city, comes in fifth at 16.94%. No other state places two cities among the five leading outposts. The double appearance points to a structural feature of North Dakota's rental markets rather than a quirk in any one city's numbers.
Fargo's 16.94% sits 0.38 percentage points above fourth-place Charleston and 1.65 points above Bismarck. The spread across the entire top five is tight: Every city in that group falls below 17%, and no city outside it can say the same. Sixth-place Cheyenne, Wyoming, sits just above the threshold at 17.02%.
Both North Dakota cities share a profile that explains their standing. Neither holds an extreme position on either input. Bismarck and Fargo combine modest but not rock-bottom rents with household incomes that are competitive nationally. Their strong showing reflects income strength as much as cheap housing. Sustaining that balance is harder than simply holding rents low, and it produces more durable affordability.
The least affordable cities in the study require renters to commit close to a third of their income to housing. Fargo's 16.94% stands at roughly half that level. Compounded over a year, the difference runs to thousands of dollars that stay in household budgets.

larrybraunphotography.com / Getty Images
Wyoming's capital city comes in sixth at 17.02%, holding the strongest result of any city in the Mountain West region. Cheyenne sits just above the top-five threshold, separated from fifth-place Fargo by eight-hundredths of a percentage point. The margin is narrow enough to be essentially statistical. What separates it from the cities further down the table is more meaningful.
Across all 182 cities, the most affordable posts 15.29% and the least affordable reaches 33.77%. Cheyenne's 17.02% places it near the affordable end of a range that spans nearly 19 percentage points. The majority of cities in the study fall between roughly 20% and 28% — a band that sits well above Cheyenne's figure.
Sixth place also reflects deliberate performance on both inputs WalletHub measured. A city must hold its rent low relative to its income to land near the top of the study. Cheyenne's rental market remains accessible relative to local wages, a balance that faster-growing Mountain West cities have struggled to maintain as housing demand has accelerated over the past decade.
Cities at the unaffordable end of the study require renters to commit nearly twice the income share to housing. Cheyenne's ratio contains the burden, giving residents a financial position closer to the top-scoring cities than to the national average.
Danny Lehman / Getty Images
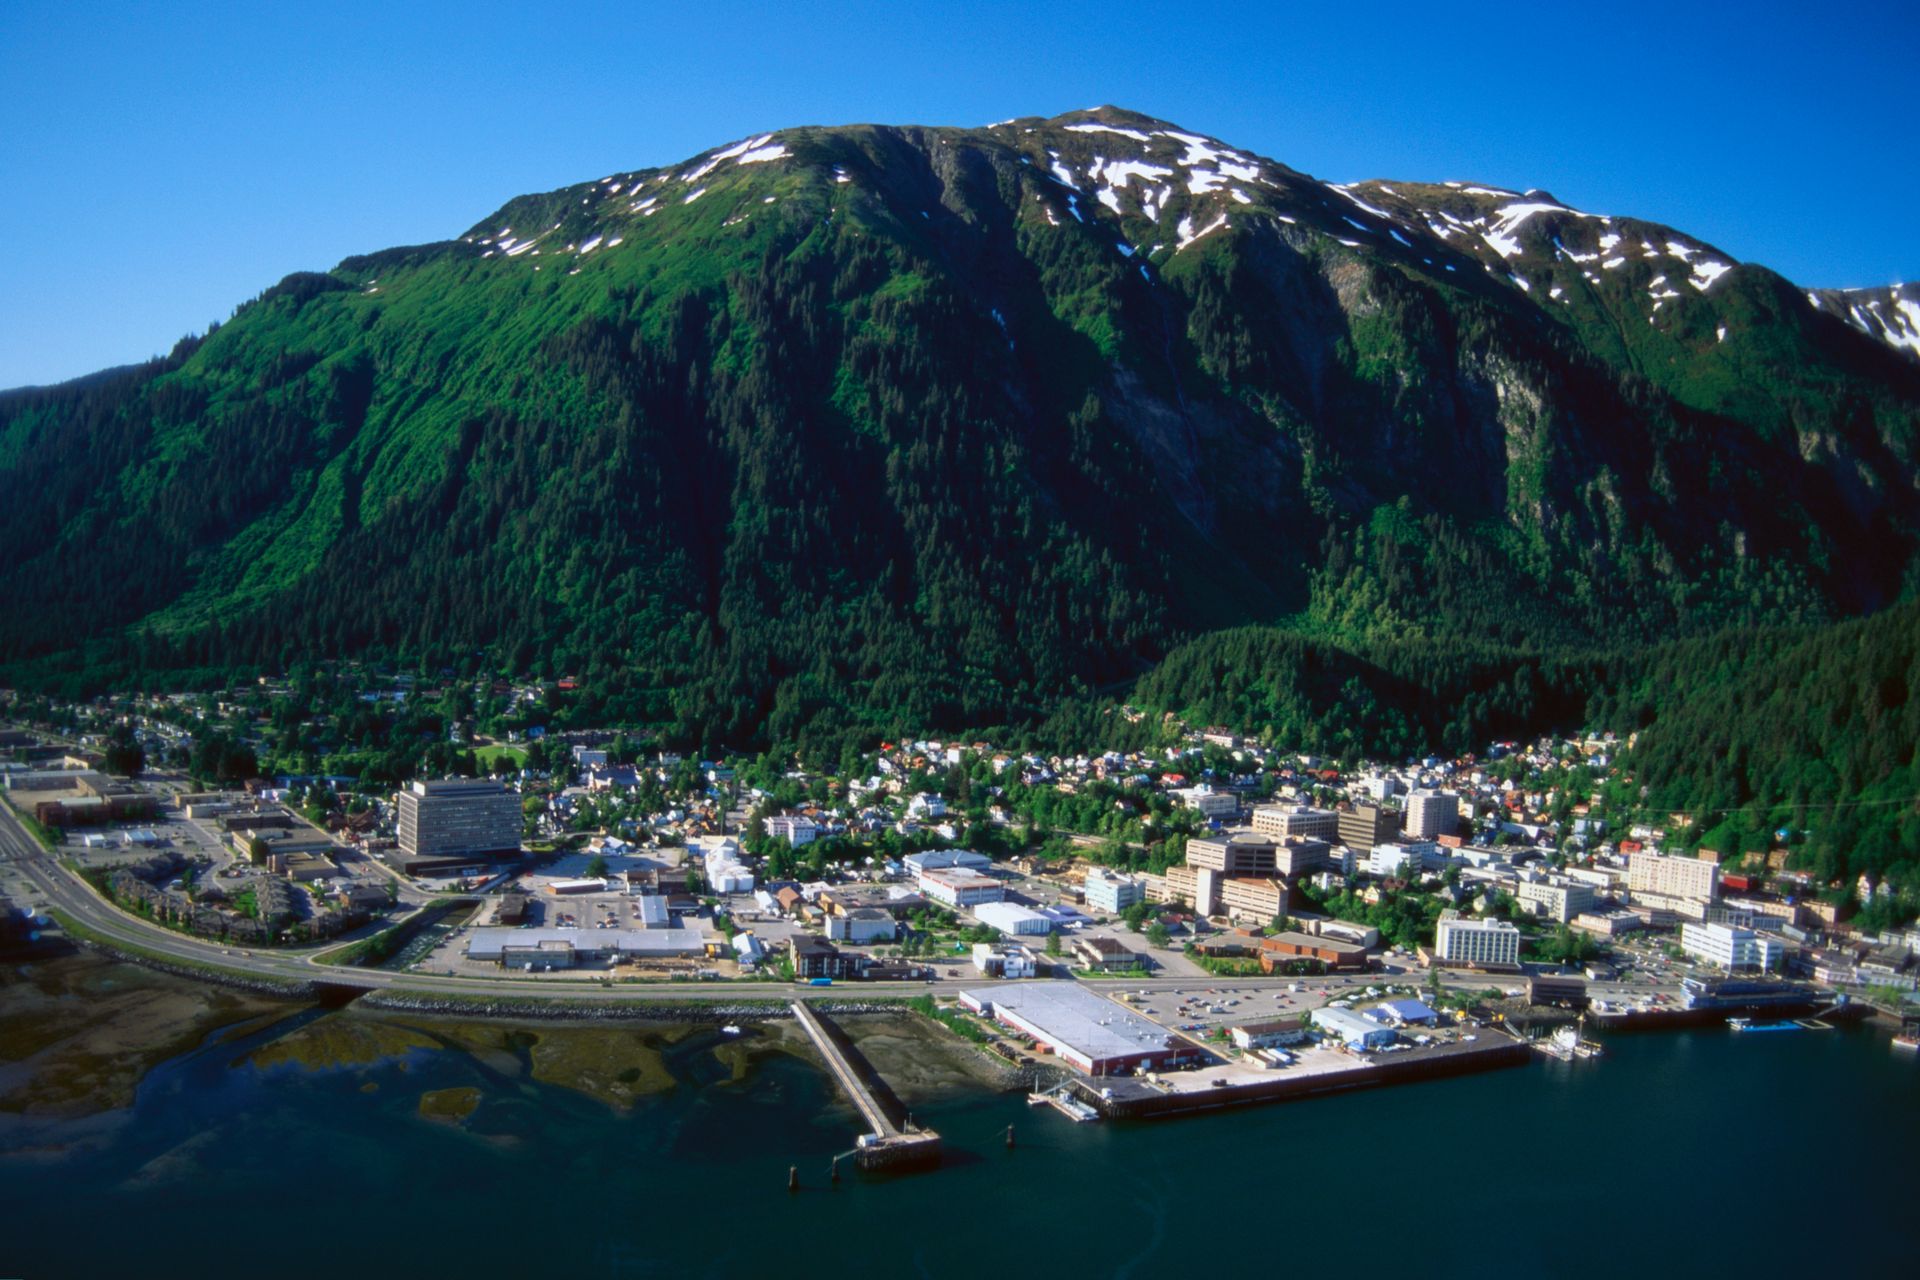
Two Alaskan cities appear in WalletHub's top 10. Juneau, the state capital, comes in seventh at 17.04%, and Anchorage, Alaska's largest city, follows in ninth at 17.30%. Their presence near the top of the national affordability table challenges a common assumption: that Alaska's remoteness and logistical costs make it expensive across the board.
Juneau's result reflects the same logic that drives every city near the top of the study. WalletHub's metric rewards places where wages are strong enough relative to rental costs to keep the ratio low — regardless of whether absolute rent levels are high or low by national standards. A city where both rents and incomes sit above the national median can outperform one where both sit below it, if the income advantage is large enough.
Juneau's 17.04% is almost exactly half of last-placed Miami’s 33.77% figure. A renter earning the local median in Juneau keeps far more of their paycheck available for savings, debt service, or other expenses than a counterpart in Miami or any of the cities below the midpoint of the table.
Juneau's outcome contradicts its reputation for high living costs, which has historically discouraged people from considering it as a financially viable place to live.
larrybraunphotography.com / Getty Images
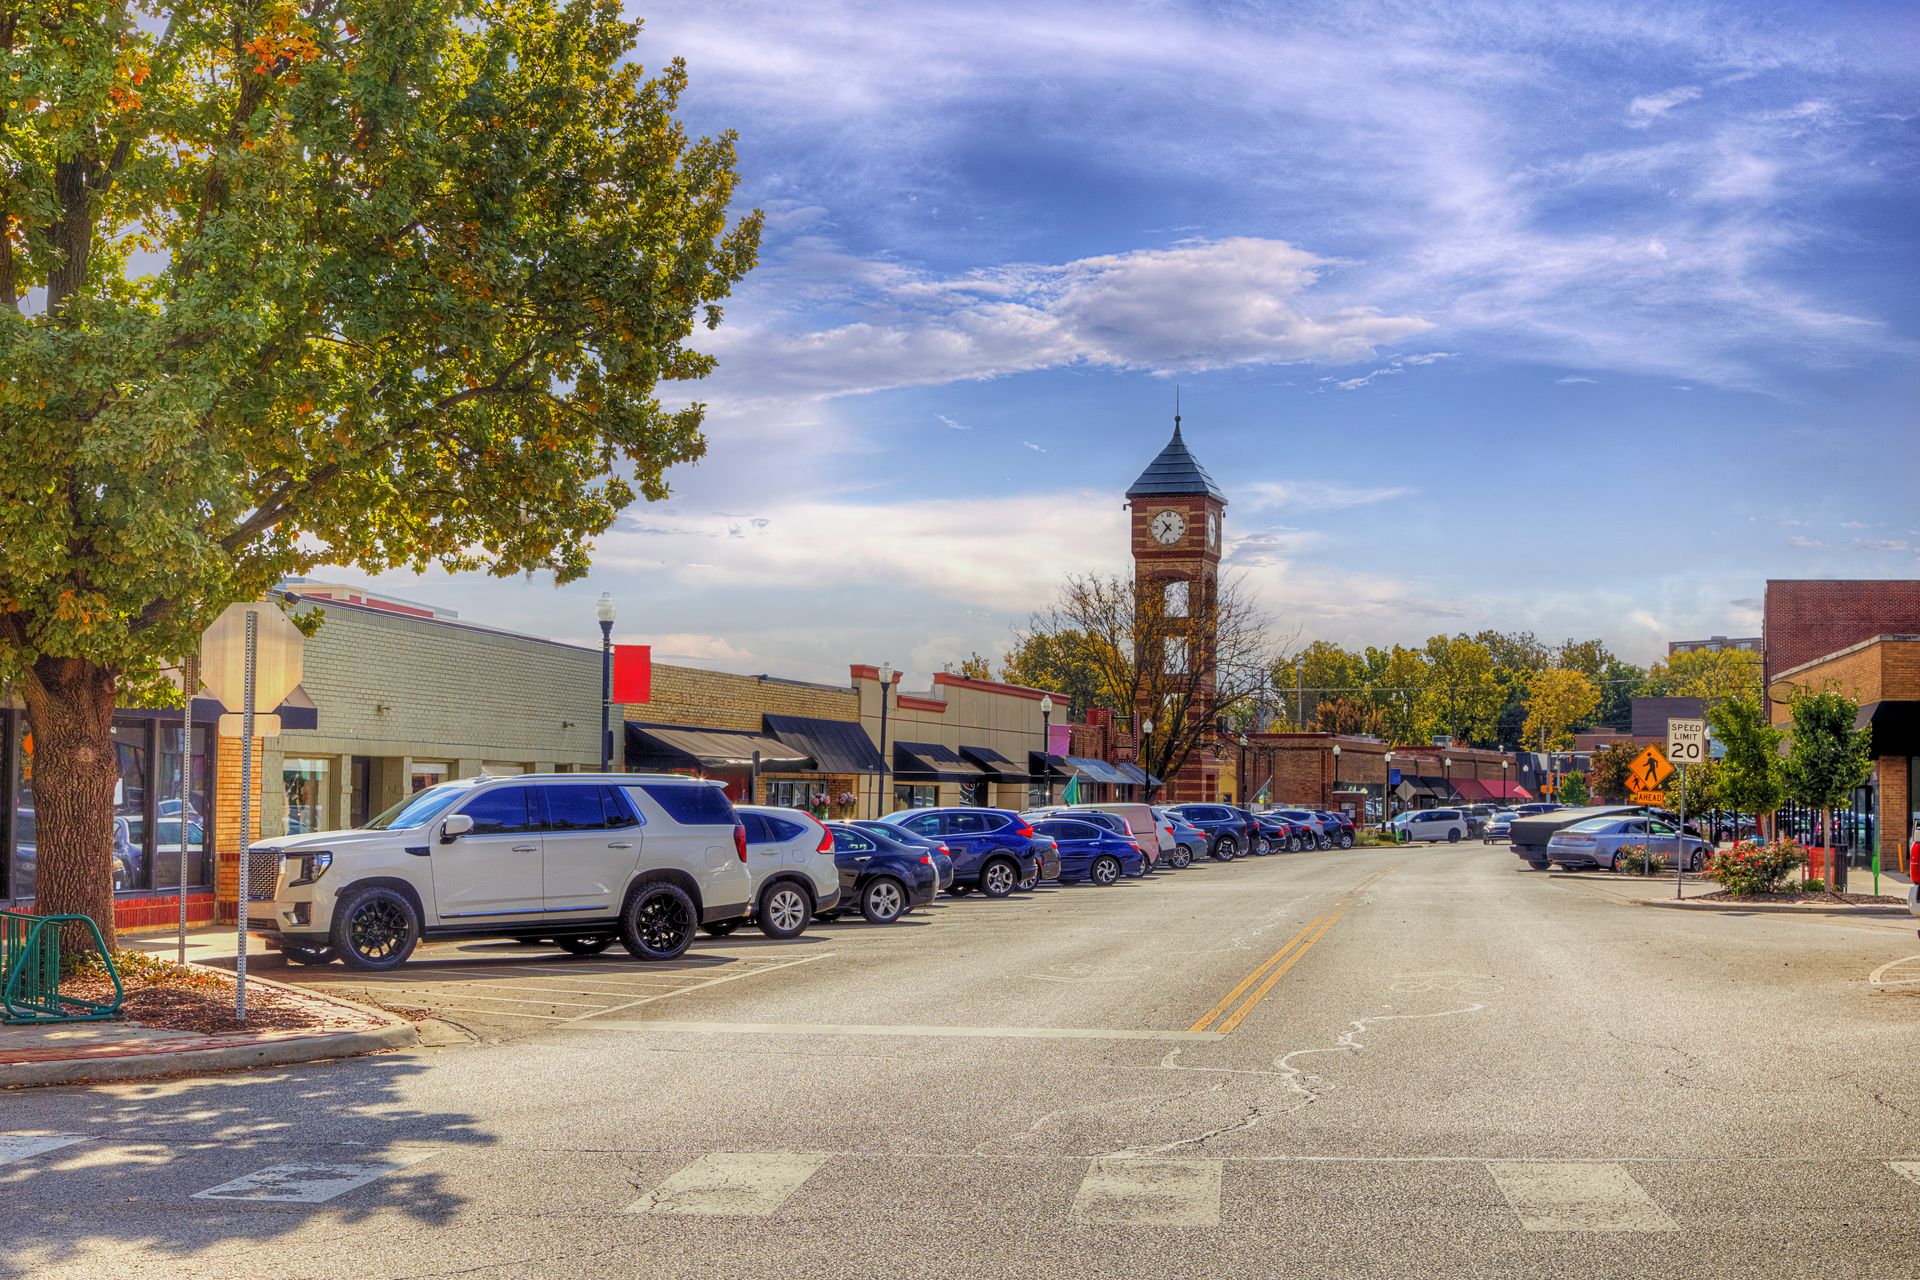
Suburban markets rarely appear near the top of national housing affordability studies. Overland Park, Kansas, a suburb of Kansas City, is an exception, coming in 10th at 17.34%. The broader Kansas City metro does not typically attract attention for housing value at the national level. Overland Park's result proves the suburb's wage base has kept pace with its rental market in a way the region's reputation does not reflect.
WalletHub's methodology rewards exactly that dynamic. A suburban economy tied to a growing metropolitan area can perform well if income grows alongside rising housing costs. Overland Park's 17.34% ratio shows that this is the case here.
The study's full range gives Overland Park's 10th-place finish its proper weight. The top city posts 15.29%. Overland Park's figure sits two percentage points above that — a small gap in a study that spans nearly 19 percentage points from top to bottom. Cities in the middle of the table post ratios in the low 20s. Overland Park sits well below that midpoint.
Among more than 180 cities, only nine post a lower ratio. Overland Park falls in the top 6% of the study.