
TriggerPhoto / Getty Images
Where a homeowner lives now determines more about their property's value trajectory than any broad national trend. For most of the post-pandemic era, elevated mortgage rates and tight supply held prices up across most of the country, masking structural differences between local markets. The masking effect is dissolving. Metros that rode pandemic-era migration booms — particularly in Florida, Texas, and California — are shedding value in nominal terms. Metros in the Midwest and Mid-Atlantic that entered the post-pandemic period with lower price bases are gaining ground. The result is a housing market that no single national figure can adequately describe.
The mechanism behind this split is not uniform. In the markets losing value, the pattern reflects an earlier cycle. Sun Belt metros attracted large volumes of buyers from 2020 through 2022, pushing prices sharply above their historical relationship to local incomes. Buyers who stretched to purchase at those elevated levels now compete with higher inventory and softer demand. In the Midwest metros gaining value, the dynamic runs in the opposite direction: lower pre-pandemic price bases kept those markets affordable relative to wages, and they are still drawing households that relocated out of high-cost coastal areas. Affordability — or the memory of it — is driving migration decisions that now show up in appreciation data.
The American Enterprise Institute's housing market indicators report tracked year-over-year constant-quality home price appreciation across the 53 largest U.S. metros through March 2026. The dataset draws on public records and applies a quasi-repeat-sales methodology to control for mix shifts in home quality, producing figures the report describes as constant-quality, not simple medians. The findings document a geographic split between appreciating and declining markets that cuts broadly across regional lines, with the spread between the strongest and weakest metro reaching 16.5 percentage points.
1 / 6
Tom Bettis / 500px / Getty Images
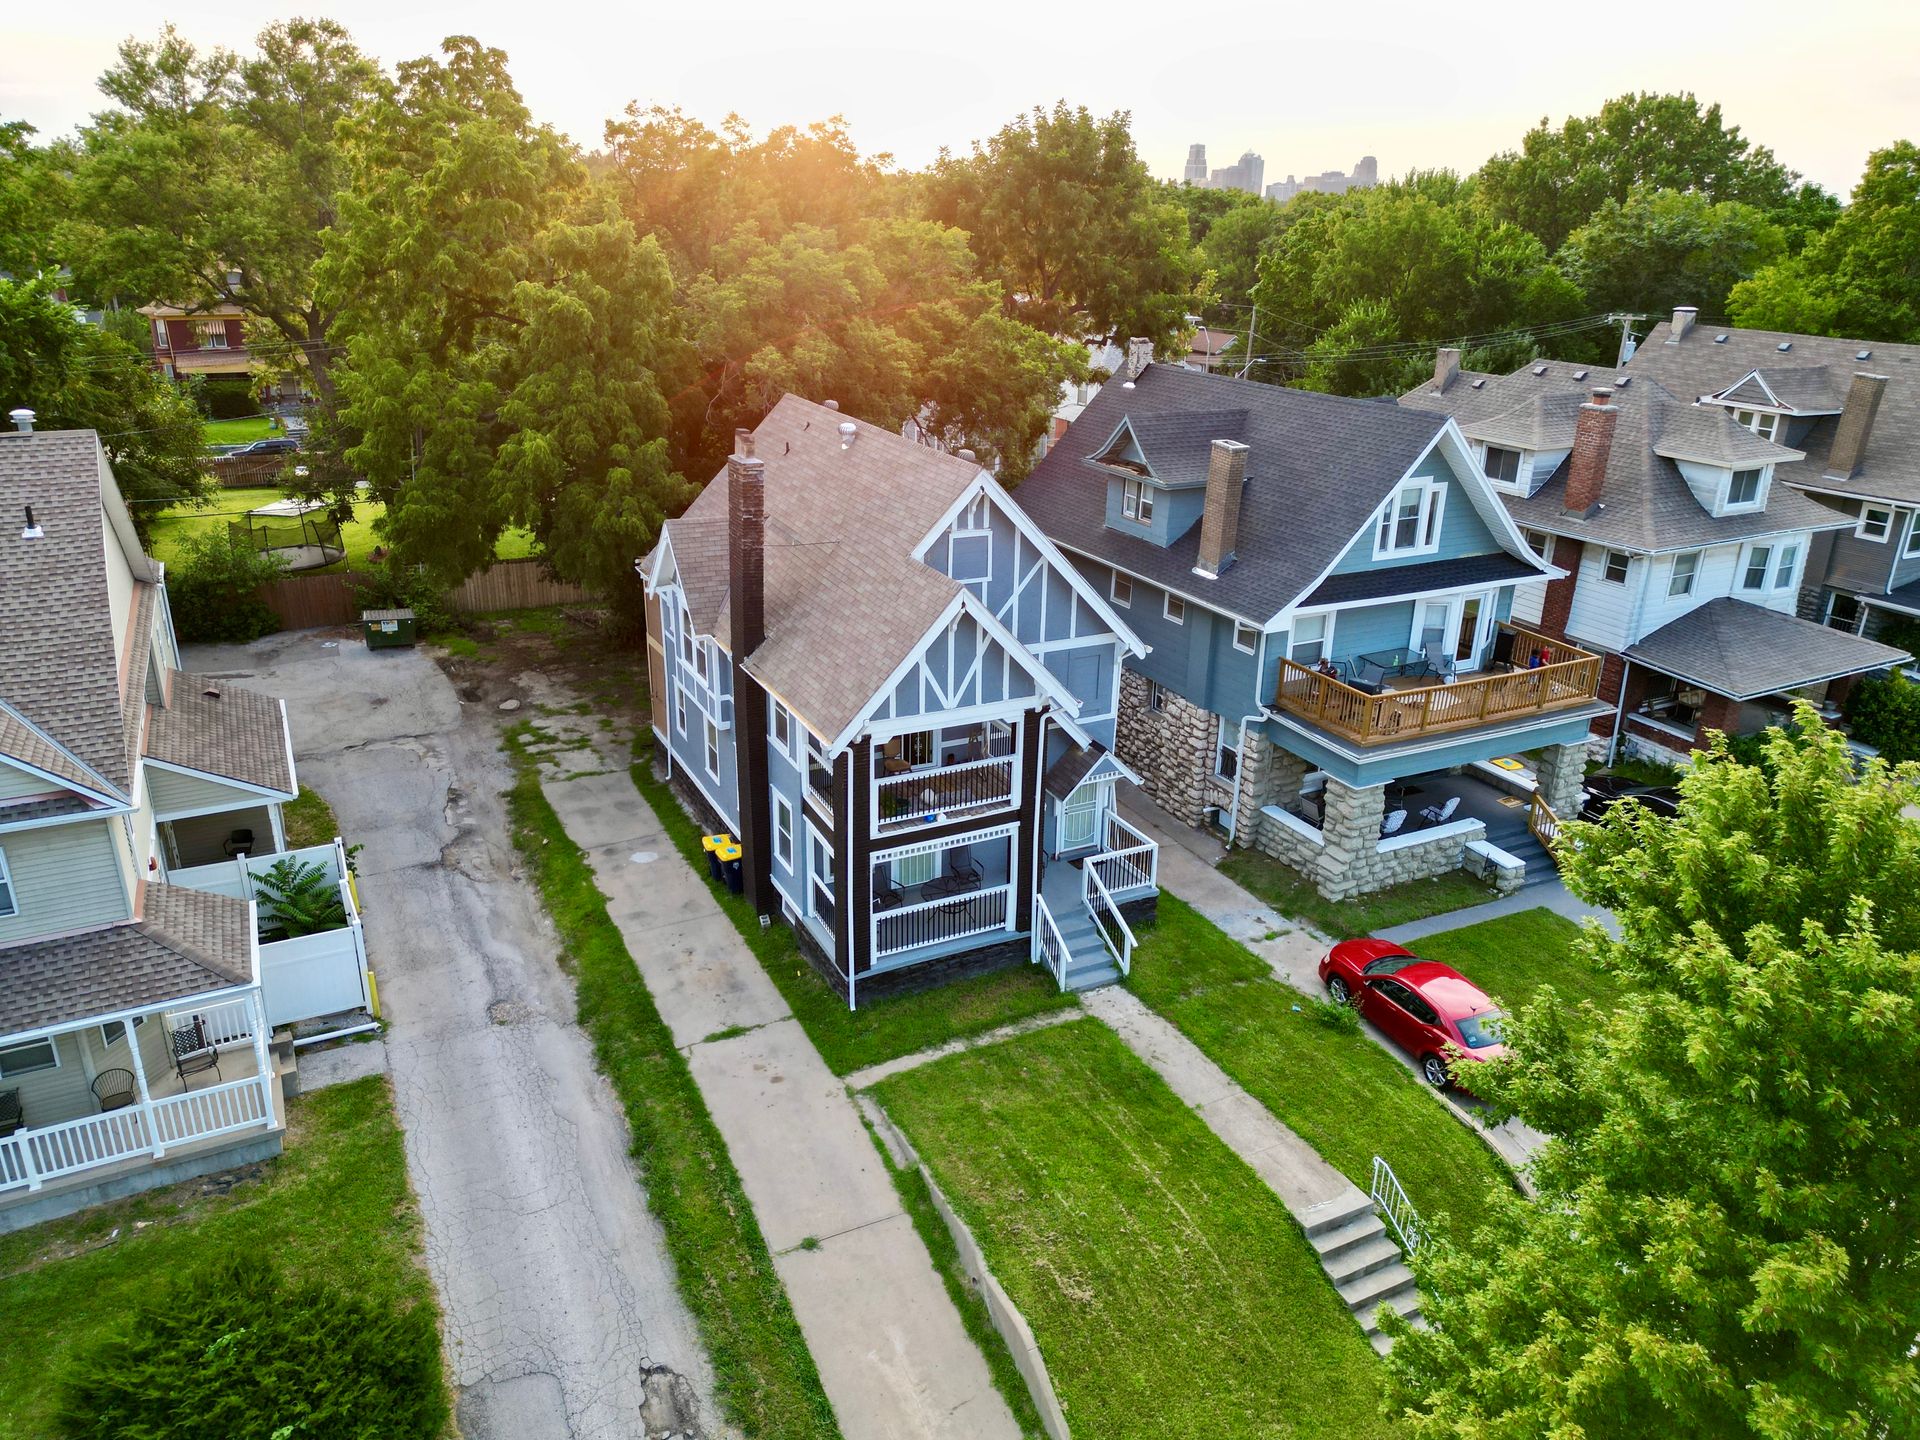
Kansas City posted year-over-year home price appreciation of 9.0% in March, the highest among the 53 largest metros tracked. The figure marks a significant shift: the metro's appreciation rose from 1.2% in March 2025 to 9.0% in March 2026 for a swing of 7.8 percentage points.
The AEI report identifies Kansas City as an example of a metro where relatively low pre-pandemic home prices have attracted buyers seeking affordable alternatives to more expensive markets. Before the pandemic began in January 2020, Kansas City's prices were already lower than those in the coastal metros that experienced the sharpest appreciation between 2020 and 2022. The AEI data show that metros with lower entry-level prices before the pandemic generally saw modest appreciation during the peak boom years and have since experienced stronger gains. The report characterizes this trajectory as a reversion to the mean.
The broader context for Kansas City's performance is a national market where mortgage rates and home prices remain elevated by historical standards. Where elevated prices have depressed demand in higher-cost markets, Kansas City offers buyers a relative escape. Monthly payments on a median-priced property in Kansas City remain more accessible than in coastal metros, and that relative accessibility has drawn households that would otherwise face severe cost burdens elsewhere. Migration-driven demand directly supports appreciation.
The data also reflect an important structural condition: Kansas City is not among the metros that experienced overheated appreciation between 2020 and 2022. Sun Belt metros that saw double-digit gains in that period are now correcting. Kansas City, which never reached those heights, is not correcting. It is catching up. The gap between overvalued and undervalued metros is not closing randomly. It closes through continued gains in the affordable markets and declines in the overpriced ones. Kansas City sits at the leading edge of that rebalancing.
2 / 6

P.J. Ziegler / 500px / Getty Images
Cleveland recorded year-over-year home price appreciation of 5.3% in March, down modestly from 5.6% in March 2025. The deceleration was minor relative to the broader national slowdown, and Cleveland held its position among the strongest-appreciating large metros in the country.
The AEI report frames Cleveland's performance within the wider Midwest pattern. Markets in that region did not accumulate the same excess valuations as Sun Belt metros during the pandemic migration boom, which means they are not working through the same correction. Cleveland's appreciation stayed positive and meaningful while markets in Florida posted outright price declines. The persistence of gains reflects consistent demand relative to supply, not a speculative surge.
Cleveland also benefits from the broader relationship the report establishes between pre-pandemic affordability and current appreciation. Its prices before the pandemic were low enough relative to incomes to remain attainable even as mortgage rates rose. Buyers who can no longer afford properties in markets like Miami or Cape Coral, Fla., face fewer barriers in Cleveland, where the price-to-income relationship is less stretched. Relative accessibility keeps the pool of eligible buyers larger and turnover more consistent.
The marginal deceleration — from 5.6% to 5.3% — signals that Cleveland is not entirely insulated from the national slowdown. The AEI data show that national YoY HPA fell from 2.6% in March 2025 to 1.2% in March 2026. The drop reflected a broad deceleration driven by elevated rates and rising inventory. Cleveland's appreciation slowed proportionally less than that national trend, which reflects stronger underlying demand conditions than the broader market. Its inventory position and buyer activity remain tilted toward sellers relative to markets in the South and West. Pre-pandemic price restraint, which looked like a weakness during the boom, has become a structural advantage in the correction. Markets that overshot are unwinding. Cleveland, which never overshot, has little to unwind.
3 / 6
stevegeer / Getty Images
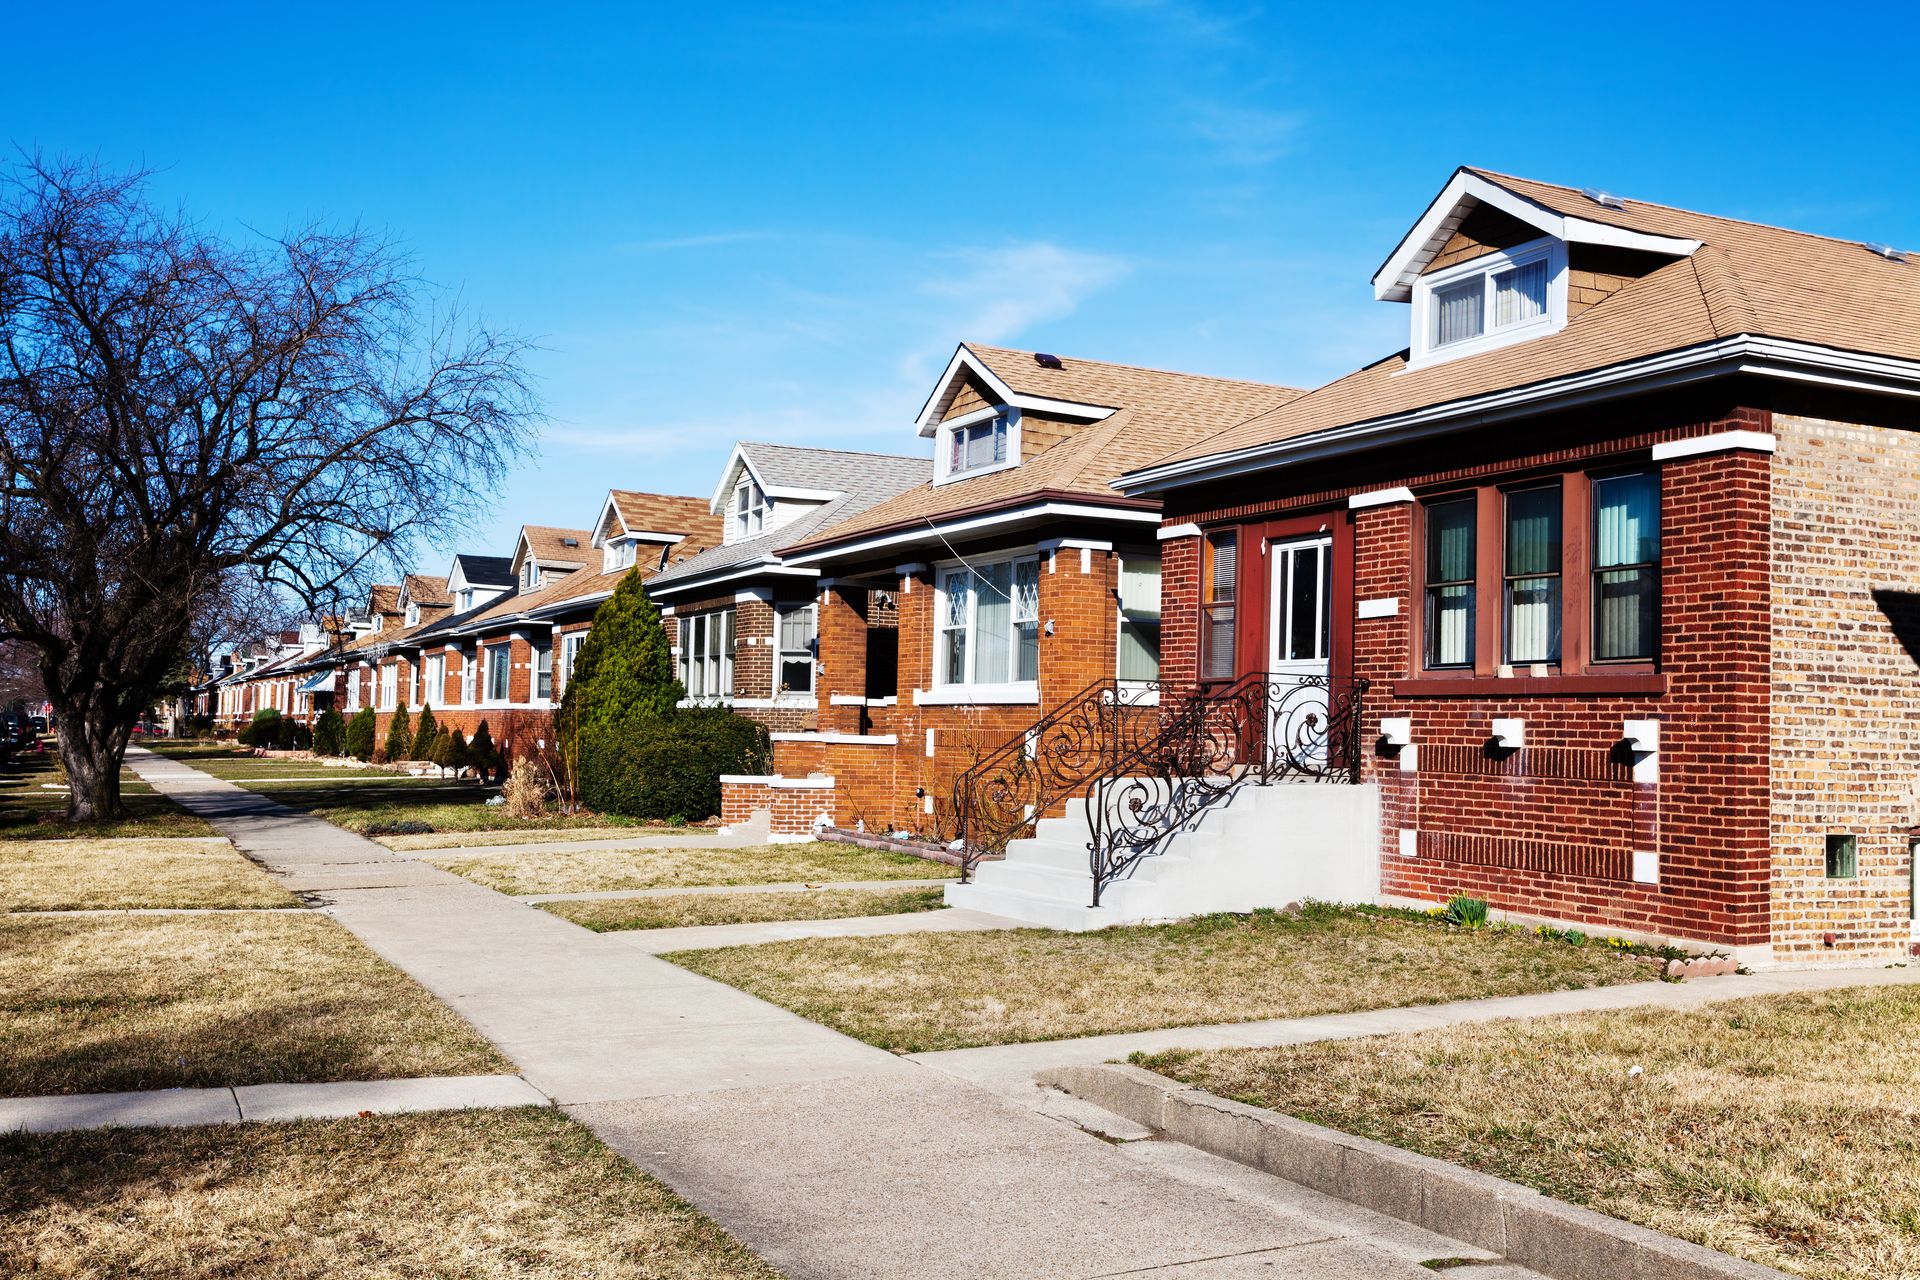
Chicago posted year-over-year home price appreciation of 5.2% in March , down from 6.3% in March 2025. Despite the deceleration, Chicago remained among the five strongest-appreciating large metros in the country, illustrating that Midwest cities continue to outperform the national trend.
The AEI report places Chicago within the pattern of metros that experienced limited appreciation before the pandemic and have since benefited from buyers seeking relative value. Chicago's market serves a large pool of both local demand and inbound migration from higher-cost coastal cities. Unlike Sun Belt metros that attracted pandemic-era buyers at elevated prices, Chicago never experienced the sharp speculative run-up that now requires a correction. Its appreciation is demand-driven, not a residual of excess pricing.
The 1.1-percentage-point deceleration from 2025 to 2026 compares favorably to the national rate of change over the same period. National YoY HPA fell 1.4 percentage points — from 2.6% to 1.2% — while Chicago's pace fell 1.1 points. The smaller-than-average deceleration suggests the metro absorbed headwinds — rising rates and weakening affordability — more effectively than most markets. The relative resilience distinguishes Chicago from markets in the South, where identical pressures produced outright price declines.
A key structural factor is Chicago's buyer base composition. In markets where the lowest price tiers dominate sales volumes, the AEI data show the steepest decelerations and the worst appreciation outcomes in March 2026. Chicago's buyer pool spans a broader range of price points, which diversifies demand and limits exposure to the entry-level affordability crunch. The AEI report's tier breakdown for March 2026 shows that the national low tier posted just 0.8% appreciation while the high tier reached 3.3%. The 2.5-percentage-point spread illustrates how important buyer base composition has become to a metro's aggregate result. Chicago's range of price points distributes its demand across tiers in a way that limits the drag from entry-level weakness.
4 / 6
sframephoto / Getty Images
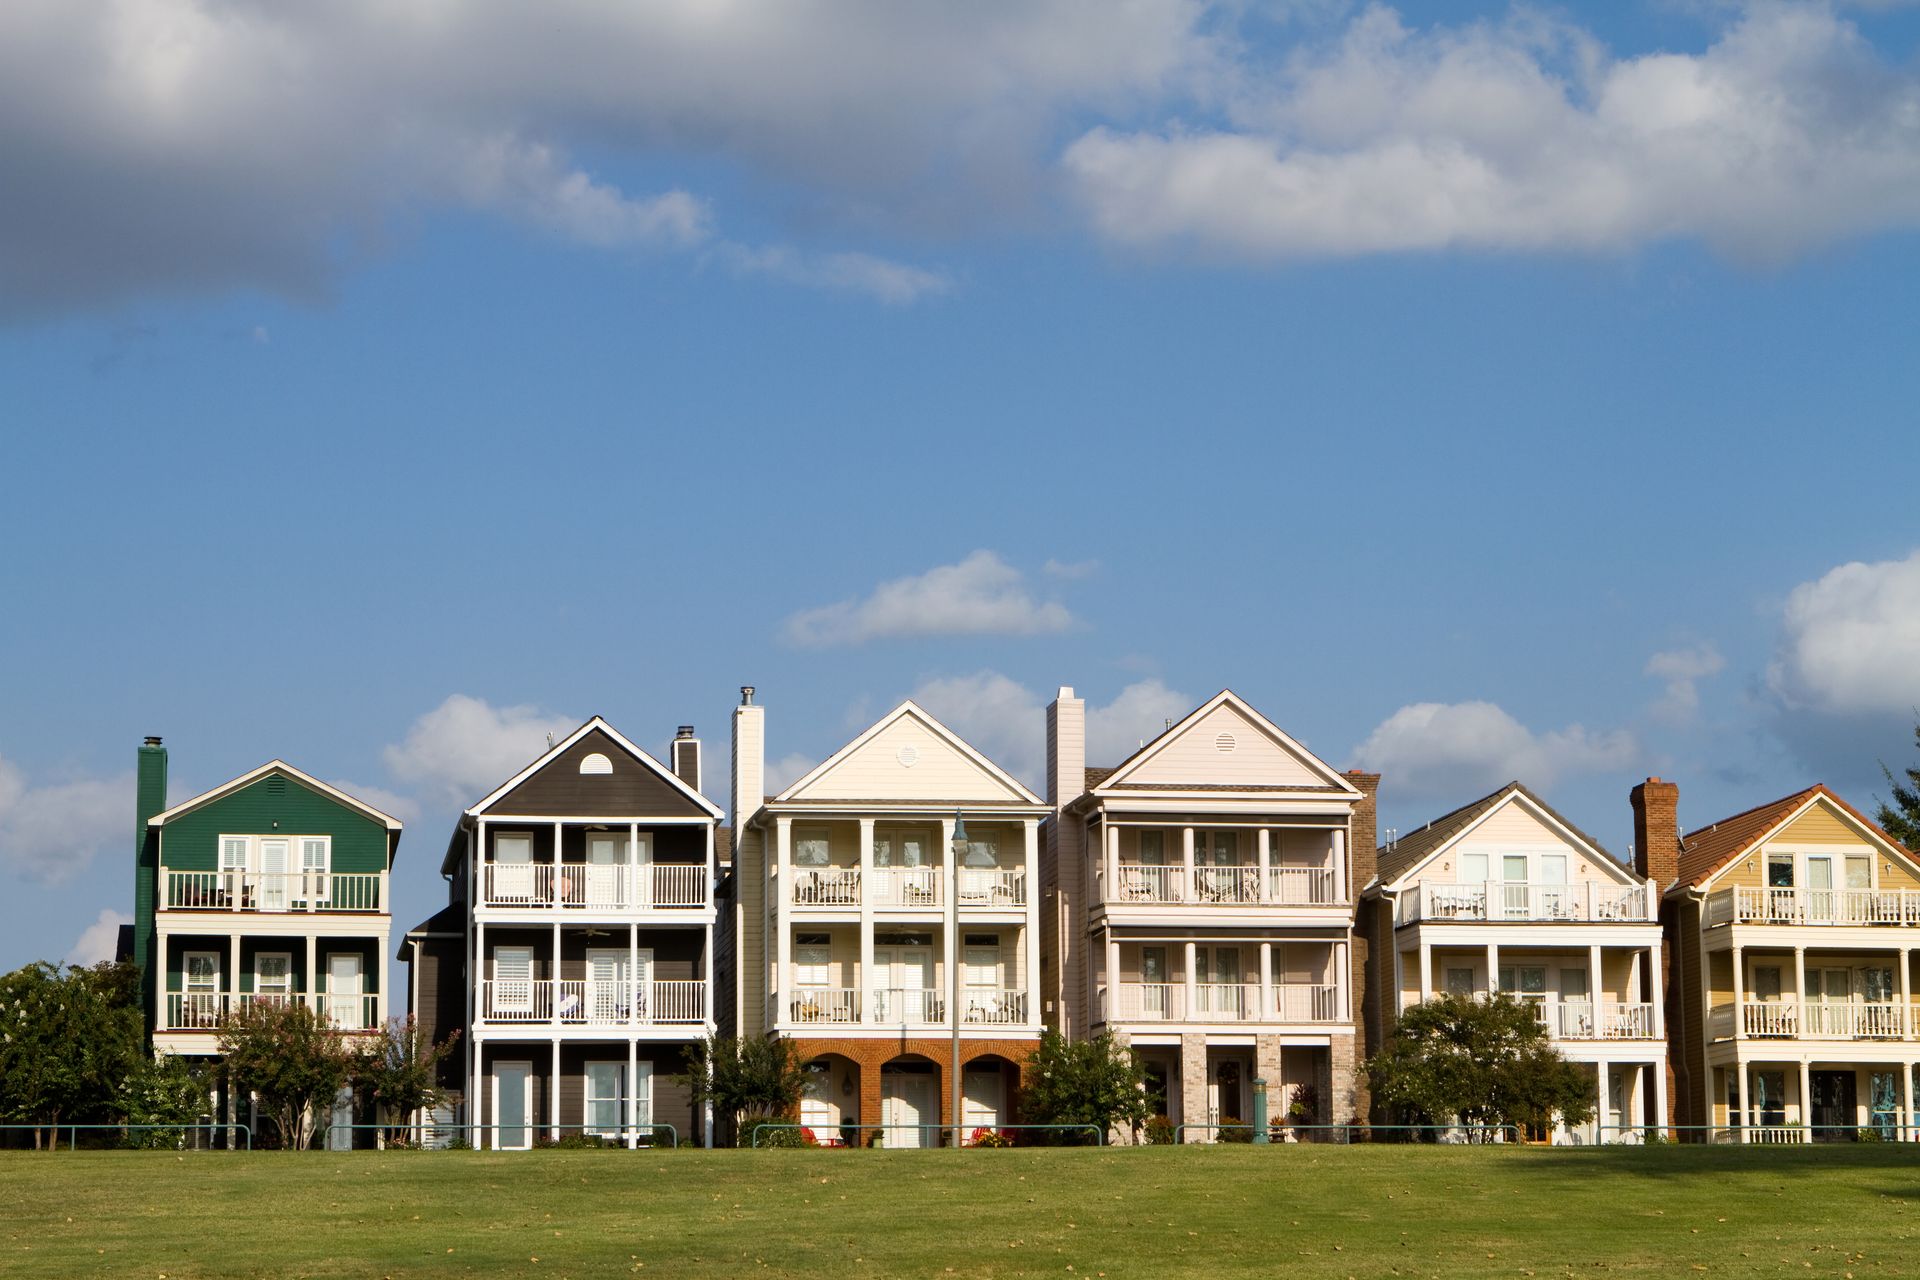
Memphis posted year-over-year home price appreciation of -7.5% in March, down from 1.5% in March 2025. The AEI report identifies Memphis as the slowest-growing metro among the 53 largest tracked, placing it at the bottom of a range that spans 16.5 percentage points from the fastest to the slowest market.
The depth of the Memphis decline stands out even against other metros posting negative appreciation. A drop from 1.5% to -7.5% is not a gradual slowing. It is a sharp contraction that implies meaningful price declines for owners who purchased in 2024 or early 2025. In real terms, accounting for the 3.3% inflation rate the AEI report cites for March 2026, the purchasing-power loss is considerably steeper than the nominal figure reflects.
The AEI report frames Memphis within a broader pattern of metros where the strongest pre-peak appreciation has given way to the weakest post-peak results. The reversion-to-the-mean dynamic works in both directions: metros that overbought are now surrendering their gains, while those that entered the pandemic period without overpriced inventory are gaining. Memphis at -7.5% sits at the far negative end of that correction.
The relationship between inventory and appreciation is also relevant. The AEI data show that the three metros with the highest months' supply all posted negative nominal HPA, and a strong correlation between rising inventory and declining appreciation runs across the 53 metros. Memphis's -7.5% result is consistent with a market where supply has outrun demand — whether from speculative construction, pandemic-era price gains that deterred buyers, or both operating simultaneously. The buyers who would have absorbed that inventory at peak prices no longer find those prices attainable, and sellers competing for a smaller pool of qualified buyers must accept lower prices to transact.
5 / 6
Michael Warren / Getty Images
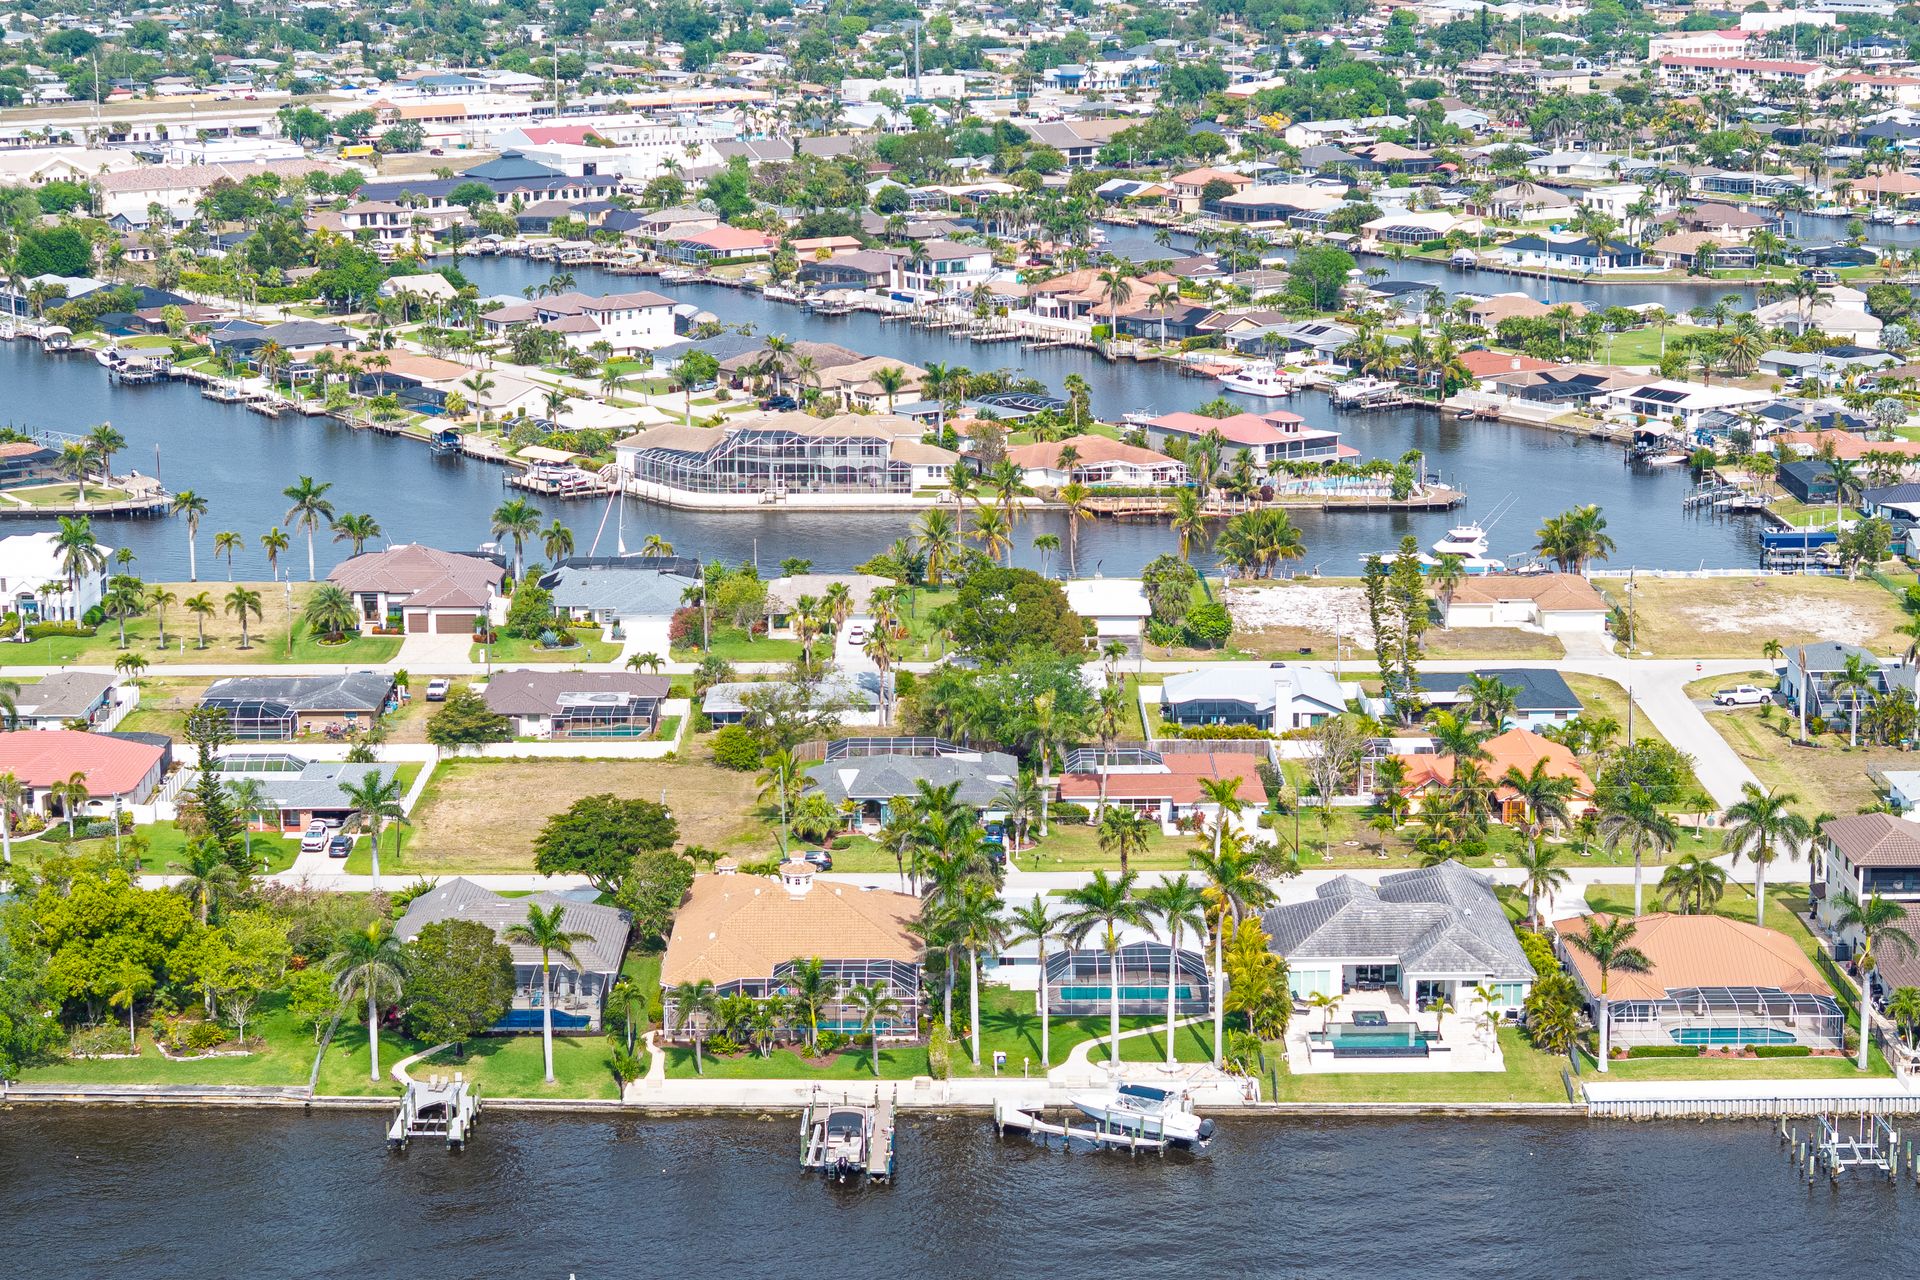
Cape Coral, Fla., recorded year-over-year home price appreciation of -6.9% in March, an improvement from -7.9% in March 2025. The 1.0-percentage-point moderation is notable, but Cape Coral remained the second-worst-performing metro among those tracked, with prices falling in both nominal and real terms.
The AEI report identifies a pattern across Florida metros: they uniformly posted appreciation below the national average, and most registered outright declines. Cape Coral sits among the deepest declines in the dataset. The metro experienced strong pandemic-era price growth driven by buyers relocating from high-cost Northeast and Midwest metros. Those buyers pushed prices well above historical norms, and the supply response — combined with a reversal of pandemic migration flows — left the market with excess inventory relative to current demand.
The modest improvement from -7.9% to -6.9% suggests the rate of decline is slowing. It is not reversing. A metro posting -6.9% YoY appreciation in nominal terms loses roughly 10% of real value annually once inflation is applied. The gap between Cape Coral's performance and the national average widened slightly over the year — the national rate fell 1.4 percentage points, and Cape Coral improved only 1.0 — meaning Cape Coral's divergence from the national trend is marginally less extreme than the prior year but still historically wide.
Cape Coral's inventory conditions are consistent with what the AEI report identifies as the driver of negative appreciation outcomes. The report establishes that a months' supply above eight to nine months nationally would be required to trigger broad nominal price declines. Cape Coral, as a Florida coastal market, almost certainly exceeds that threshold locally. Miami — the most closely monitored Florida metro in the dataset — reached 7.8 months' supply in March 2026, and Cape Coral's conditions are unlikely to be more favorable. The pandemic-era migration premium that pushed prices to unsustainable levels is unwinding, and the pace of that unwinding has only slightly decelerated.
6 / 6
ntzolov / Getty Images
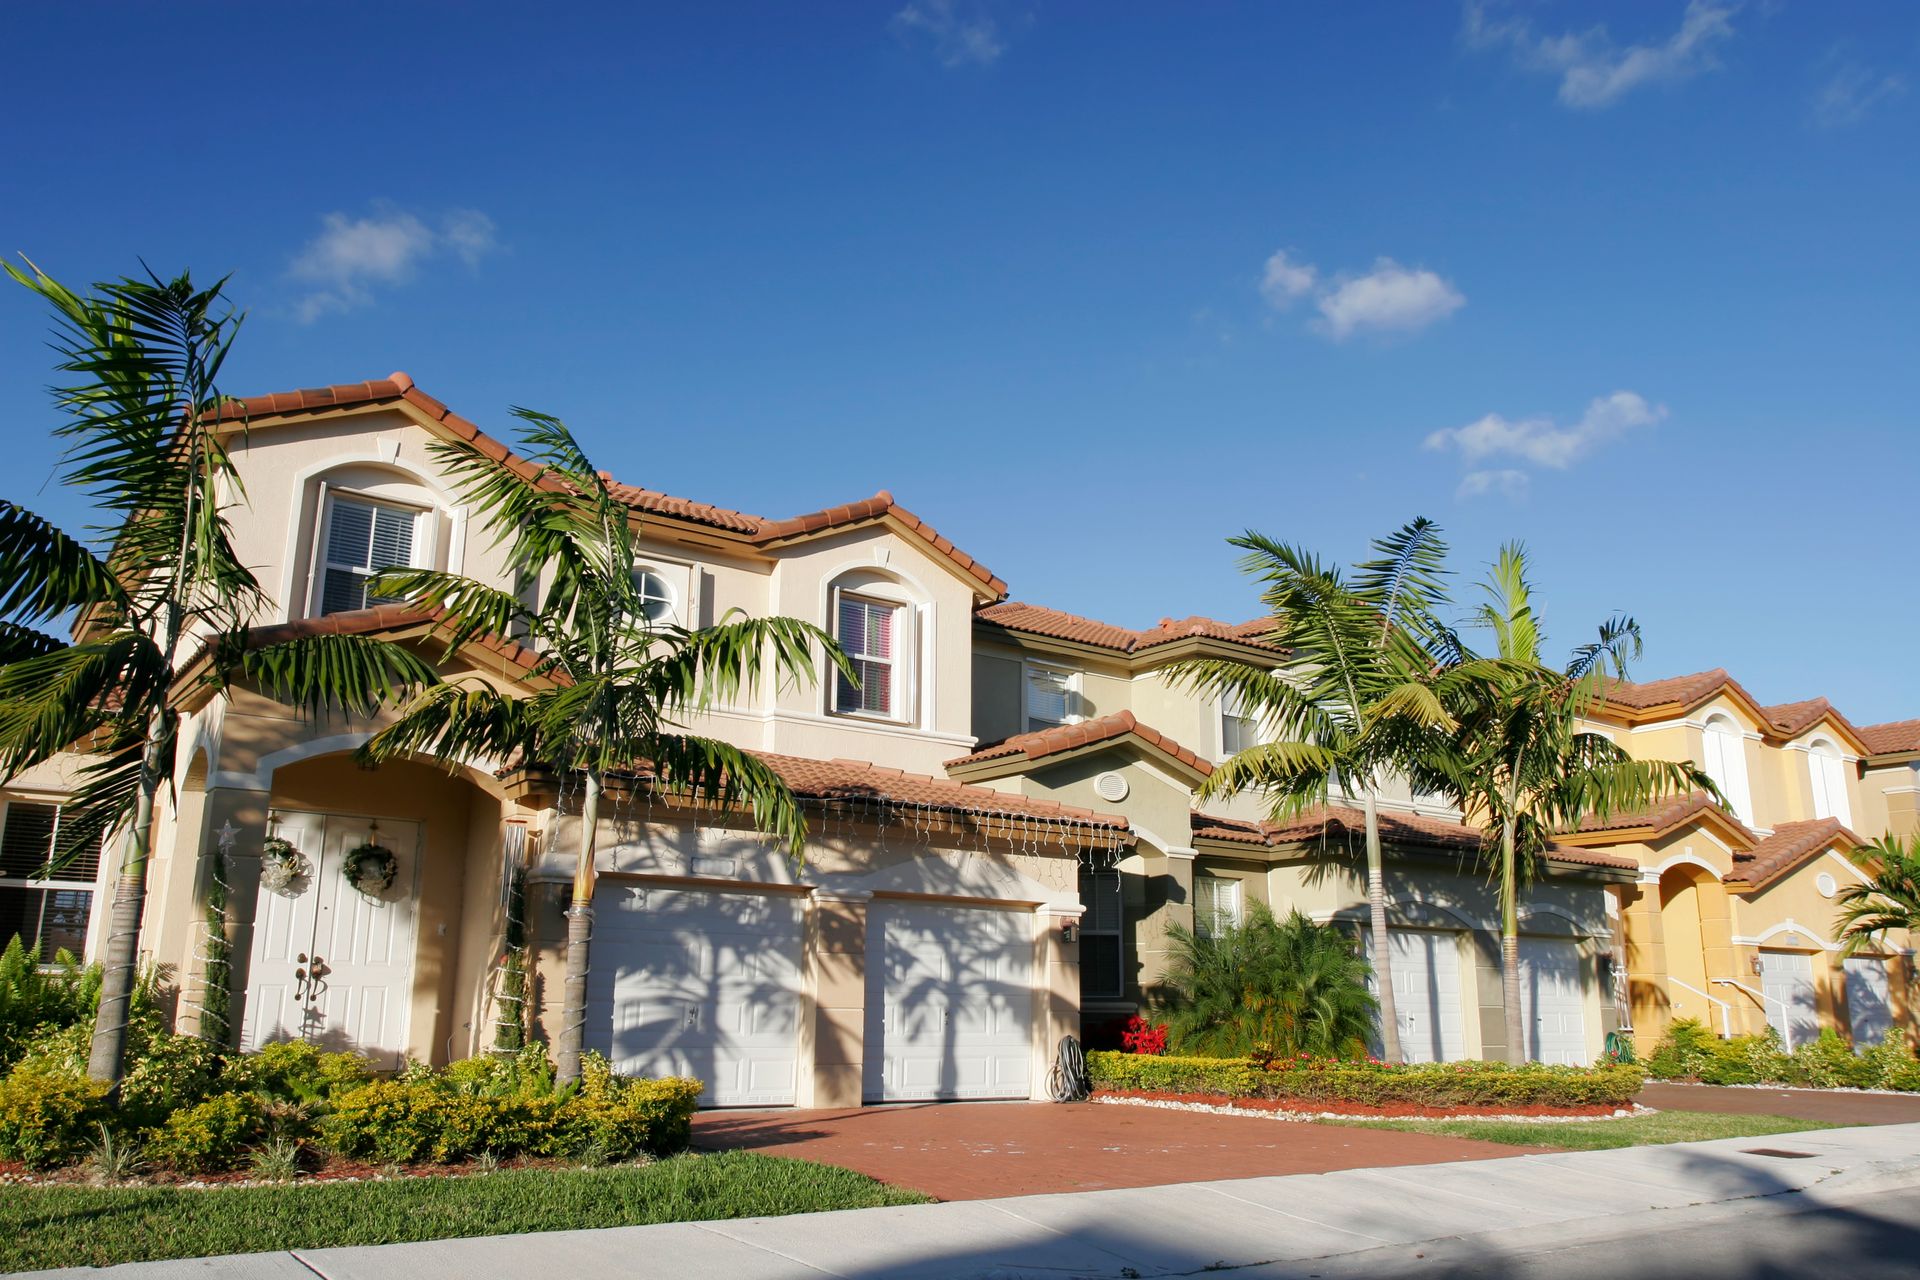
Miami posted year-over-year home price appreciation of -5.1% in March. It marked a deterioration from -2.0% in March 2025. The 3.1-percentage-point worsening makes Miami the Florida metro with the fastest-accelerating price decline among those tracked, as its months' supply climbed to 7.8 months, the highest of any metro in the AEI dataset and the only reading that crosses into buyers' market territory.
The AEI report classifies Miami's 7.8 months' supply as a buyers' market. In a buyers' market, sellers must accept concessions to transact, and those concessions compress the sale prices that feed into appreciation calculations. The transition from a sellers' market to a buyers' market shifts negotiating leverage decisively toward purchasers and puts downward pressure on valuations that can persist across multiple quarters.
Miami's pandemic-era price surge was among the most dramatic in the country, driven by a large influx of domestic and international buyers, particularly from the Northeast and Latin America. Prices rose sharply from 2020 through 2022, pushing the price-to-income ratio well above levels sustainable on local wages. The AEI report's broader dataset confirms that median home price-to-income is the single most predictive measure of homelessness across U.S. markets, explaining 76% of variance in that outcome — and Miami's elevated ratio signals structural unaffordability that cannot resolve quickly.
Rising inventory, prices stretched beyond local incomes, and decelerating migration inflows have removed the demand props that sustained Miami during the boom. The -5.1% figure for March 2026 represents the current stage of that correction. The trajectory from -2.0% to -5.1% in a single year does not suggest the market has found its floor, and the AEI base-case projection for national YoY HPA at December 2026 stands at 0.0%. The figure implies Miami's own trajectory could extend deeper into negative territory before stabilizing. Miami entered the correction later than Cape Coral or North Port but is now deteriorating faster than both.
