
Buyers in major U.S. markets hold growing leverage over sellers. Redfin measured the supply gap across 49 metropolitan areas
Zak Bennett / Bloomberg via Getty Images
Sellers outnumber buyers across most of the U.S., and the imbalance matters to anyone shopping for a home right now. When a buyer walks into a market with far more listings than competing offers, sellers feel the pressure. Prices stall or soften. Contingencies go back on the table. Inspection requests that would have been refused in 2021 get accepted without negotiation. The shift does not just change the tone of deals — it changes their economics. In markets where sellers outnumber buyers by a wide margin, homes sit longer, sellers cut prices more often, and buyers routinely close below list price. That practical difference separates a buyer's market from a seller's market, and right now buyers hold the upper hand in an unusually large share of major U.S. metros.
The pattern is not evenly distributed, and its underlying causes are structural, not cyclical. Sun Belt cities that attracted mass migration during the pandemic now carry the consequences of that boom: homebuilders accelerated construction to meet surging demand, and that supply keeps arriving even as in-migration has slowed. Florida and Texas build more homes than any other states, so their metros accumulate inventory at a pace buyers cannot absorb. On top of supply pressure, several markets face demand headwinds that compound the imbalance. High property taxes and rising insurance premiums make ownership more expensive after closing, pushing hesitant buyers toward waiting. Job-security concerns dampen willingness to commit to large purchases. The result is a widening gap between the number of people listing homes and the number willing to buy.
Redfin's March 2026 buyer-versus-seller analysis estimated the number of active buyers and sellers across 49 major metropolitan areas using proprietary tour-to-close data and MLS records on active listings and pending sales. The study defines a buyer's market as one where sellers outnumber buyers by more than 10%, and a seller's market as one where buyers outnumber sellers by more than 10%. As of March, 38 of the 49 analyzed metros qualified as buyer's markets, up from 29 a year earlier, while nationally there were an estimated 43.1% more home sellers than buyers. The metros below represent the 10 markets where that imbalance runs deepest — the places where a buyer's negotiating position is strongest.
felixmizioznikov / Getty Images
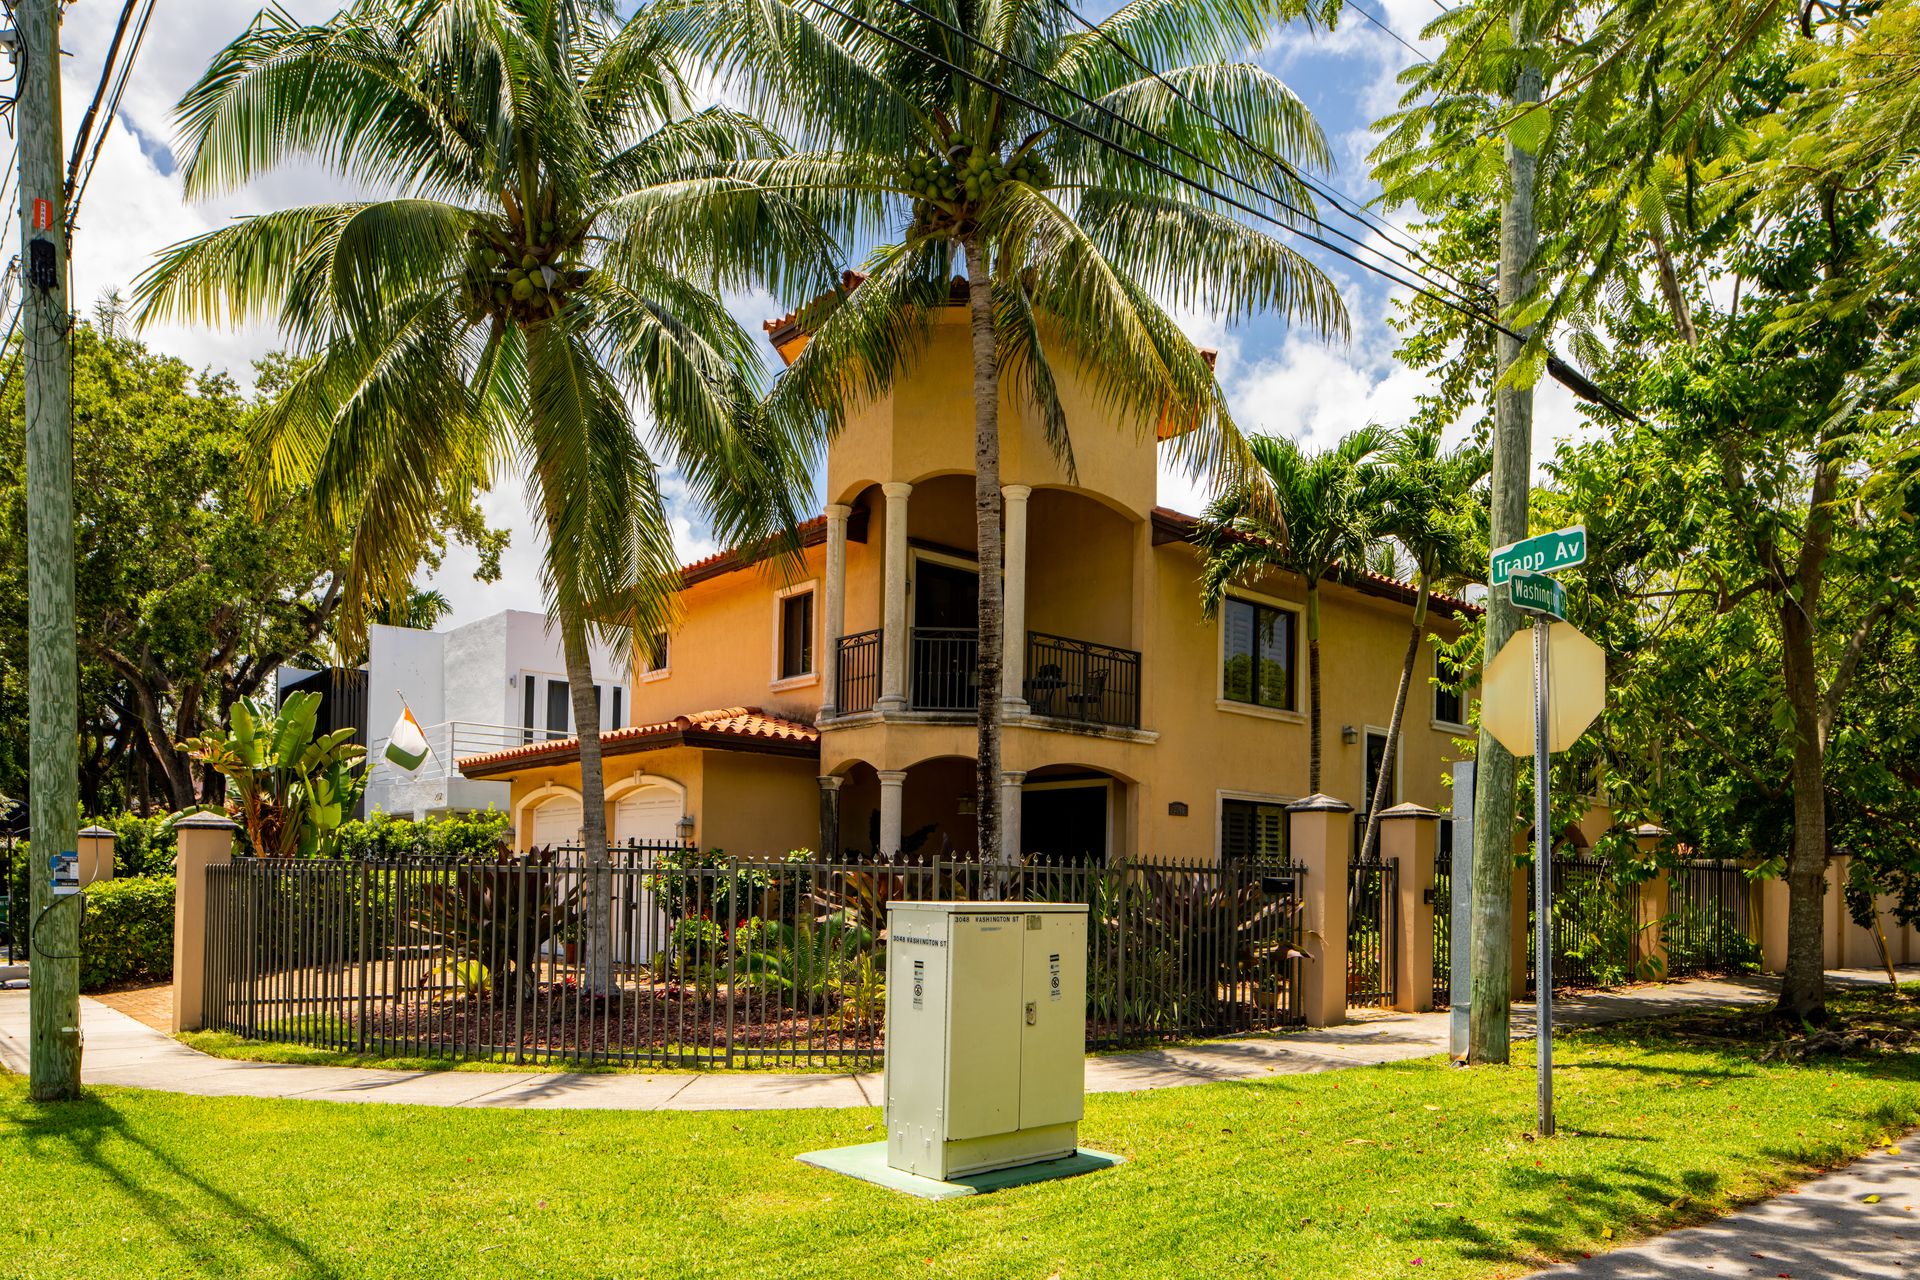
Miami carries the most severe supply-demand imbalance of any metro in the analysis. With an estimated 147.9% more sellers than buyers, the city's market has fundamentally inverted from the frenzy of the early pandemic years, when Miami drew intense out-of-state demand from buyers fleeing expensive Northeast and West Coast markets. Of the 19,347 sellers active in March, only 7,806 buyers were estimated to be in the market simultaneously — a gap of more than 11,500 people competing for buyer attention.
The forces behind Miami's imbalance extend beyond typical inventory cycles. Florida has faced a worsening insurance crisis as natural disasters increase in frequency and cost, driving premiums sharply higher for homeowners across the state. Buyers who calculate total monthly carrying costs find that insurance obligations add a significant sum on top of mortgage and tax payments, reducing the effective purchasing power of a given income. Some buyers who could afford a home at its purchase price find the ongoing cost of owning in Miami has moved past what they are willing to sustain long term.
Miami's condo market faces an additional structural pressure. Rising homeowners association fees tied to new state-mandated safety requirements have added significant carrying costs to thousands of units. For buyers considering condos — a substantial segment of the Miami market — those fees reset affordability calculations and suppress demand for properties that would otherwise sell competitively.
The city's pandemic-era population surge also seeded a prolonged correction. Buyers who relocated to Miami during 2020 and 2021 stretched to purchase at elevated prices. As remote-work policies tightened and some employers recalled workers to original locations, a portion of those buyers listed their homes, adding to supply while demand from new entrants remained constrained. The cumulative effect is a market where sellers compete sharply for a limited buyer pool, giving those buyers consistent room to negotiate on price, concessions, and contract terms across virtually every property type and price point.

Isabella Pino / REDA / Universal Images Group via Getty Images
Nashville's estimated 119% more sellers than buyers makes it the second-most buyer-advantaged market in the analysis. With 16,202 sellers and 7,398 buyers, the city holds a surplus of approximately 8,804 more sellers than active buyers. Nashville drew significant in-migration during the pandemic from higher-cost metros, particularly in the Northeast and Midwest, and homebuilders responded with aggressive construction designed to meet what appeared to be durable long-term demand.
The construction pipeline is the central mechanism behind Nashville's imbalance. The South historically permits more new housing than other regions, and Tennessee faces fewer regulatory barriers to development than states such as California or New York. Nashville's builders continued delivering units well past the initial demand surge, adding inventory even as the buyer pool contracted. Completed homes and new subdivisions entered a market where buyer urgency had already faded, pushing available supply above what existing buyers could absorb.
Buyers in Nashville benefit from a market where sellers have watched homes sit longer and grown more willing to negotiate. Price reductions have become more common, and contingency offers that would have been refused a few years earlier now carry greater acceptance. Sellers understand that flexibility on inspection requests, closing timelines, and repair credits is the cost of competing in a market with this much supply.
Nashville's affordability profile has shifted in ways that independently constrain the buyer pool. Home prices appreciated sharply during the pandemic boom, making the city considerably more expensive than its historical baseline. Even as demand cooled, those elevated prices persisted, limiting the pool of buyers who can qualify at current mortgage rates. The gap between what sellers need to recoup from earlier purchases and what buyers can afford given current rates and incomes keeps the market imbalanced, with buyers holding the stronger position in negotiations across most segments and price ranges.
Brandon Bell / Getty Images
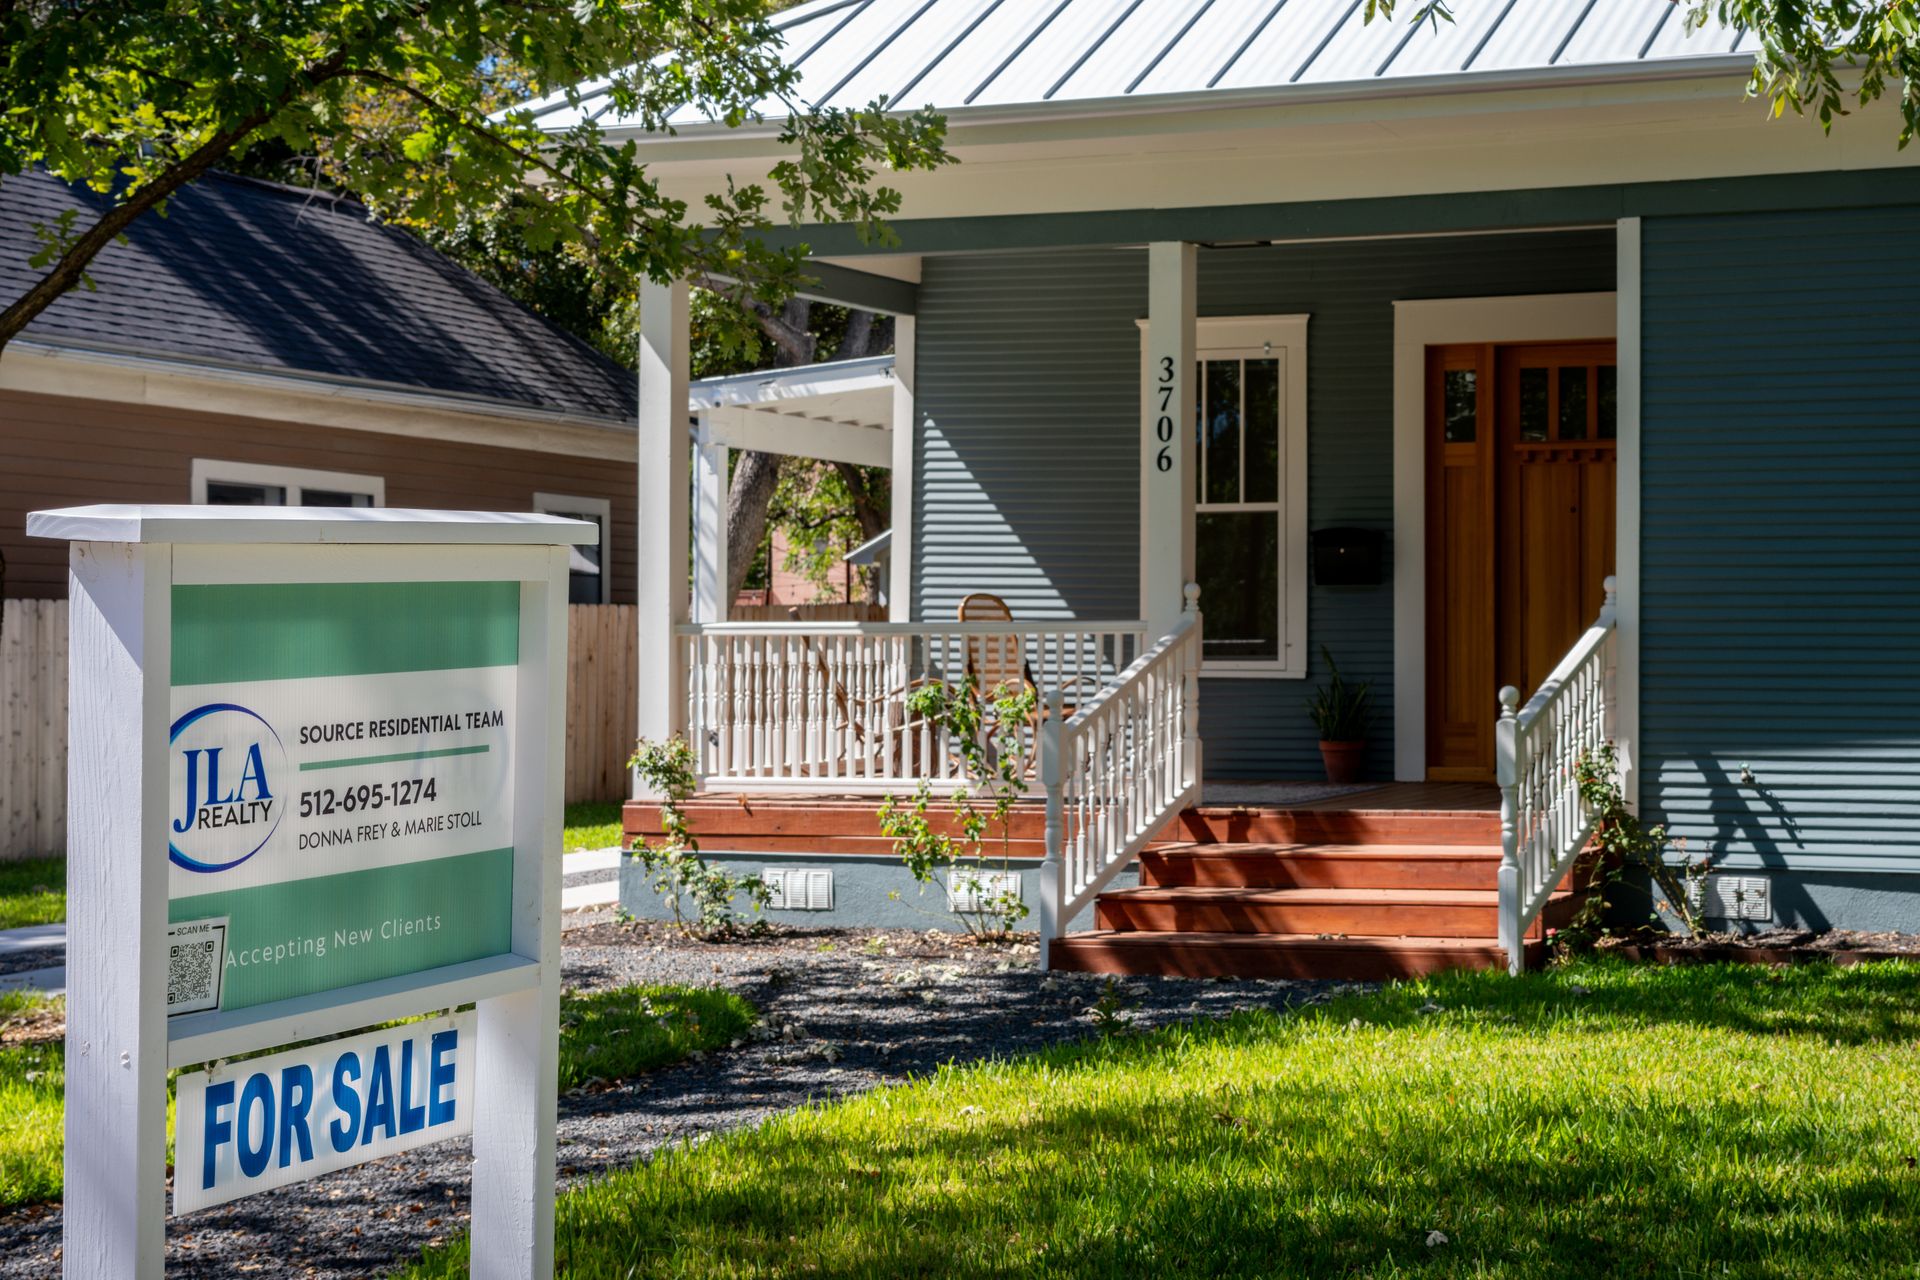
Austin's estimated 112.1% more sellers than buyers places it third in the analysis. With 18,043 sellers and 8,509 buyers, the market holds a surplus of more than 9,500 on the seller side. The city's real estate profile represents one of the clearest examples of a pandemic boom unwinding: Austin attracted enormous demand from technology workers and remote employees during 2020 and 2021, prices surged, and builders accelerated permitting and construction to levels the market cannot currently absorb.
Property taxes in Texas rank among the highest in the country, and that cost sits on top of a purchase price that remains elevated relative to pre-pandemic levels. A buyer calculating monthly carrying costs must add a substantial tax obligation that does not apply in lower-tax states competing for the same mobile workforce. The compounding effect of high acquisition cost and high ongoing tax burden makes Austin ownership expensive beyond what the sticker price suggests, and buyers who model total cost of ownership often defer or look elsewhere.
Job-security concerns add a second layer of hesitation. The technology sector, which drove significant migration to Austin, has experienced layoffs and hiring slowdowns across multiple companies since 2022. Workers in or adjacent to that industry who might have bought confidently during peak employment conditions now face uncertainty that makes a 30-year mortgage commitment more psychologically difficult.
A local real estate professional cited in the source noted that buyers in Austin have become highly selective given the intersection of high property taxes, rising insurance costs, and concerns about employment stability. That selectivity shows up directly in the data. Sellers outnumber buyers by more than two to one, homes accumulate on the market, and buyers who do engage hold meaningful price negotiating leverage. Austin's market continues to generate closed transactions, but the terms consistently favor buyers in ways unavailable during the peak years of the pandemic demand surge.
Jenae Escobar / Getty Images
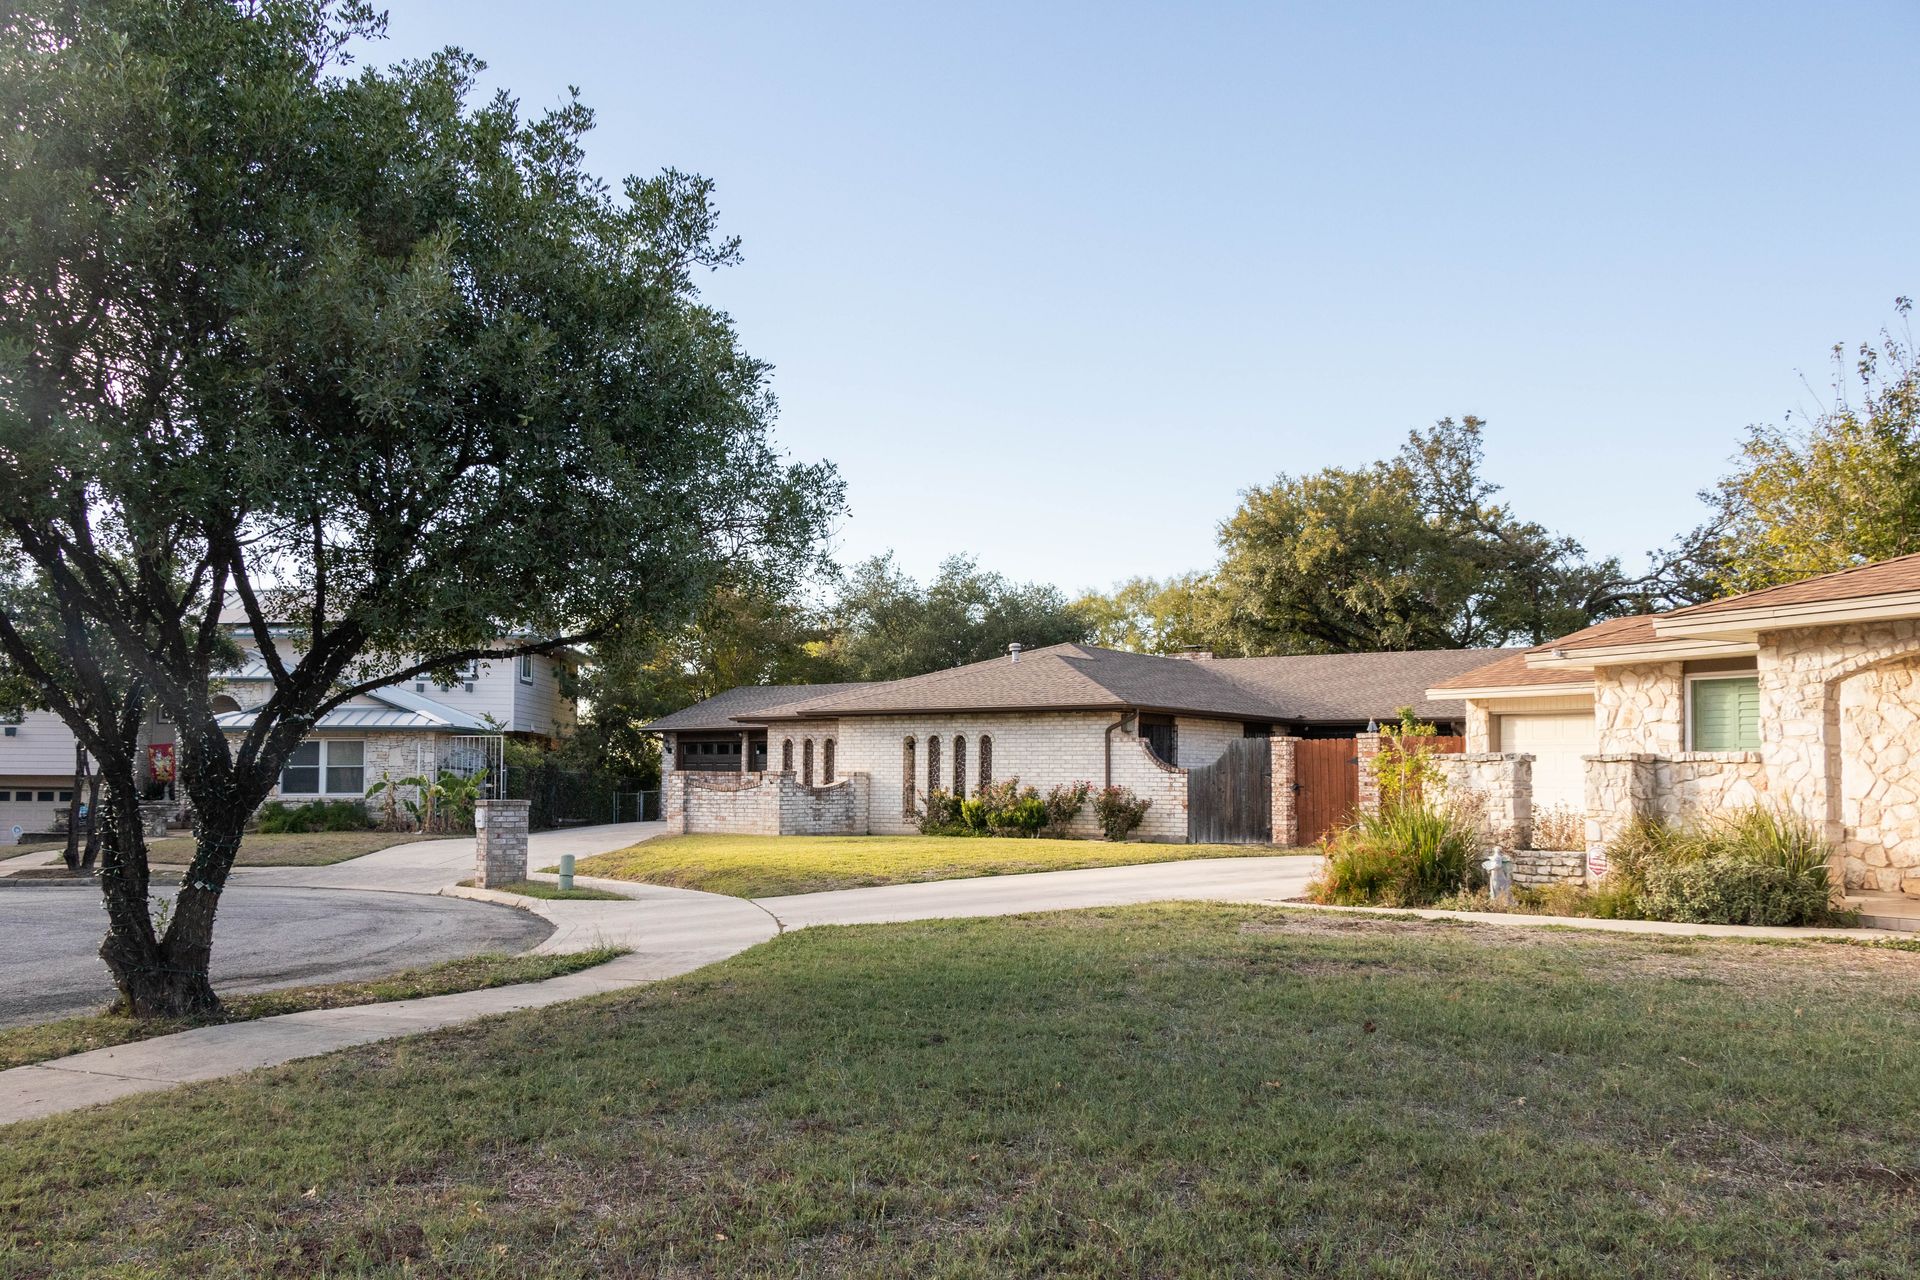
San Antonio's estimated 109% more sellers than buyers places it fourth, with 18,932 sellers and 9,059 buyers. The city shares the structural characteristics that define the Texas buyer-market pattern: a permissive development environment, active homebuilders, relatively high property taxes, and a buyer pool that has not grown quickly enough to absorb available supply. The surplus of approximately 9,873 sellers over buyers gives active buyers substantial leverage on price and terms in nearly every segment of the market.
Texas as a whole builds more homes than most other states, a pattern that predates the pandemic but accelerated sharply during the boom years. San Antonio's lower price point relative to Austin and Dallas historically made it an entry point for buyers priced out of those metros. As construction activity intensified, however, available inventory expanded faster than demand from those displaced buyers could sustain. The supply overhang has no near-term resolution, given that the construction pipeline does not reverse quickly once permitted units are under development and approaching delivery.
Insurance costs add to the buyer hesitation visible in the data. Texas faces significant homeowner insurance exposure from severe weather events, including hail, flooding, and winter storm damage, and premiums have risen accordingly. Buyers who model total ownership costs find that insurance expenses materially affect affordability even when the purchase price appears manageable at first review.
Sellers competing in San Antonio's current environment face buyers who are well-informed about market conditions and aware of their position. Multiple price reductions on individual listings have normalized expectations: buyers entering negotiations understand that asking prices frequently decline and that sellers are receptive to inspection contingencies, closing cost contributions, and repair credits. The depth of the surplus means buyers have genuine optionality — if one seller resists, comparable alternatives are available within the same price range and neighborhood, keeping the leverage firmly with the buyer throughout the transaction.

Scott Van Dyke / Getty Images
Las Vegas is the fifth-strongest buyer's market in the analysis and the last of the five metros where sellers outnumber buyers by more than double. Its estimated 100.7% surplus means there are approximately 14,272 sellers and 7,110 buyers in the market — a gap of more than 7,162. That threshold carries practical significance: when sellers outnumber buyers by more than double, competition among sellers intensifies to the point where multiple price reductions and meaningful concessions become routine, not exceptional.
The city attracted pandemic-era buyers drawn by Nevada's lack of state income tax, lower home prices relative to California, and the appeal of remote work in a market that had historically been volatile but accessible. That demand wave has receded substantially. Remote work adoption has not reversed entirely, but many of the buyers who relocated during 2020 and 2021 have settled their housing situations, and the pipeline of new in-migrants seeking the market has thinned considerably from its peak.
Nevada's construction sector has continued producing units, adding to available supply even as buyer urgency diminished. New home deliveries from builders who permitted during the demand surge keep entering the market, competing with existing listings and pushing sellers to distinguish their properties on price and condition. Sellers who resist that competitive pressure find their homes accumulating days on market at a pace that further weakens their negotiating position.
Buyers in Las Vegas today face wide selection, motivated sellers, and conditions that support negotiation on price and terms simultaneously. The city's market has historically been among the most sensitive to economic cycles, amplifying both gains and corrections relative to less volatile metros. The current imbalance reflects that amplification working in a buyer-favorable direction: sellers who entered the market expecting competitive conditions have found themselves waiting, reducing prices, and accepting terms they would have rejected during the peak years of the pandemic demand surge.
AzmanL / Getty Images
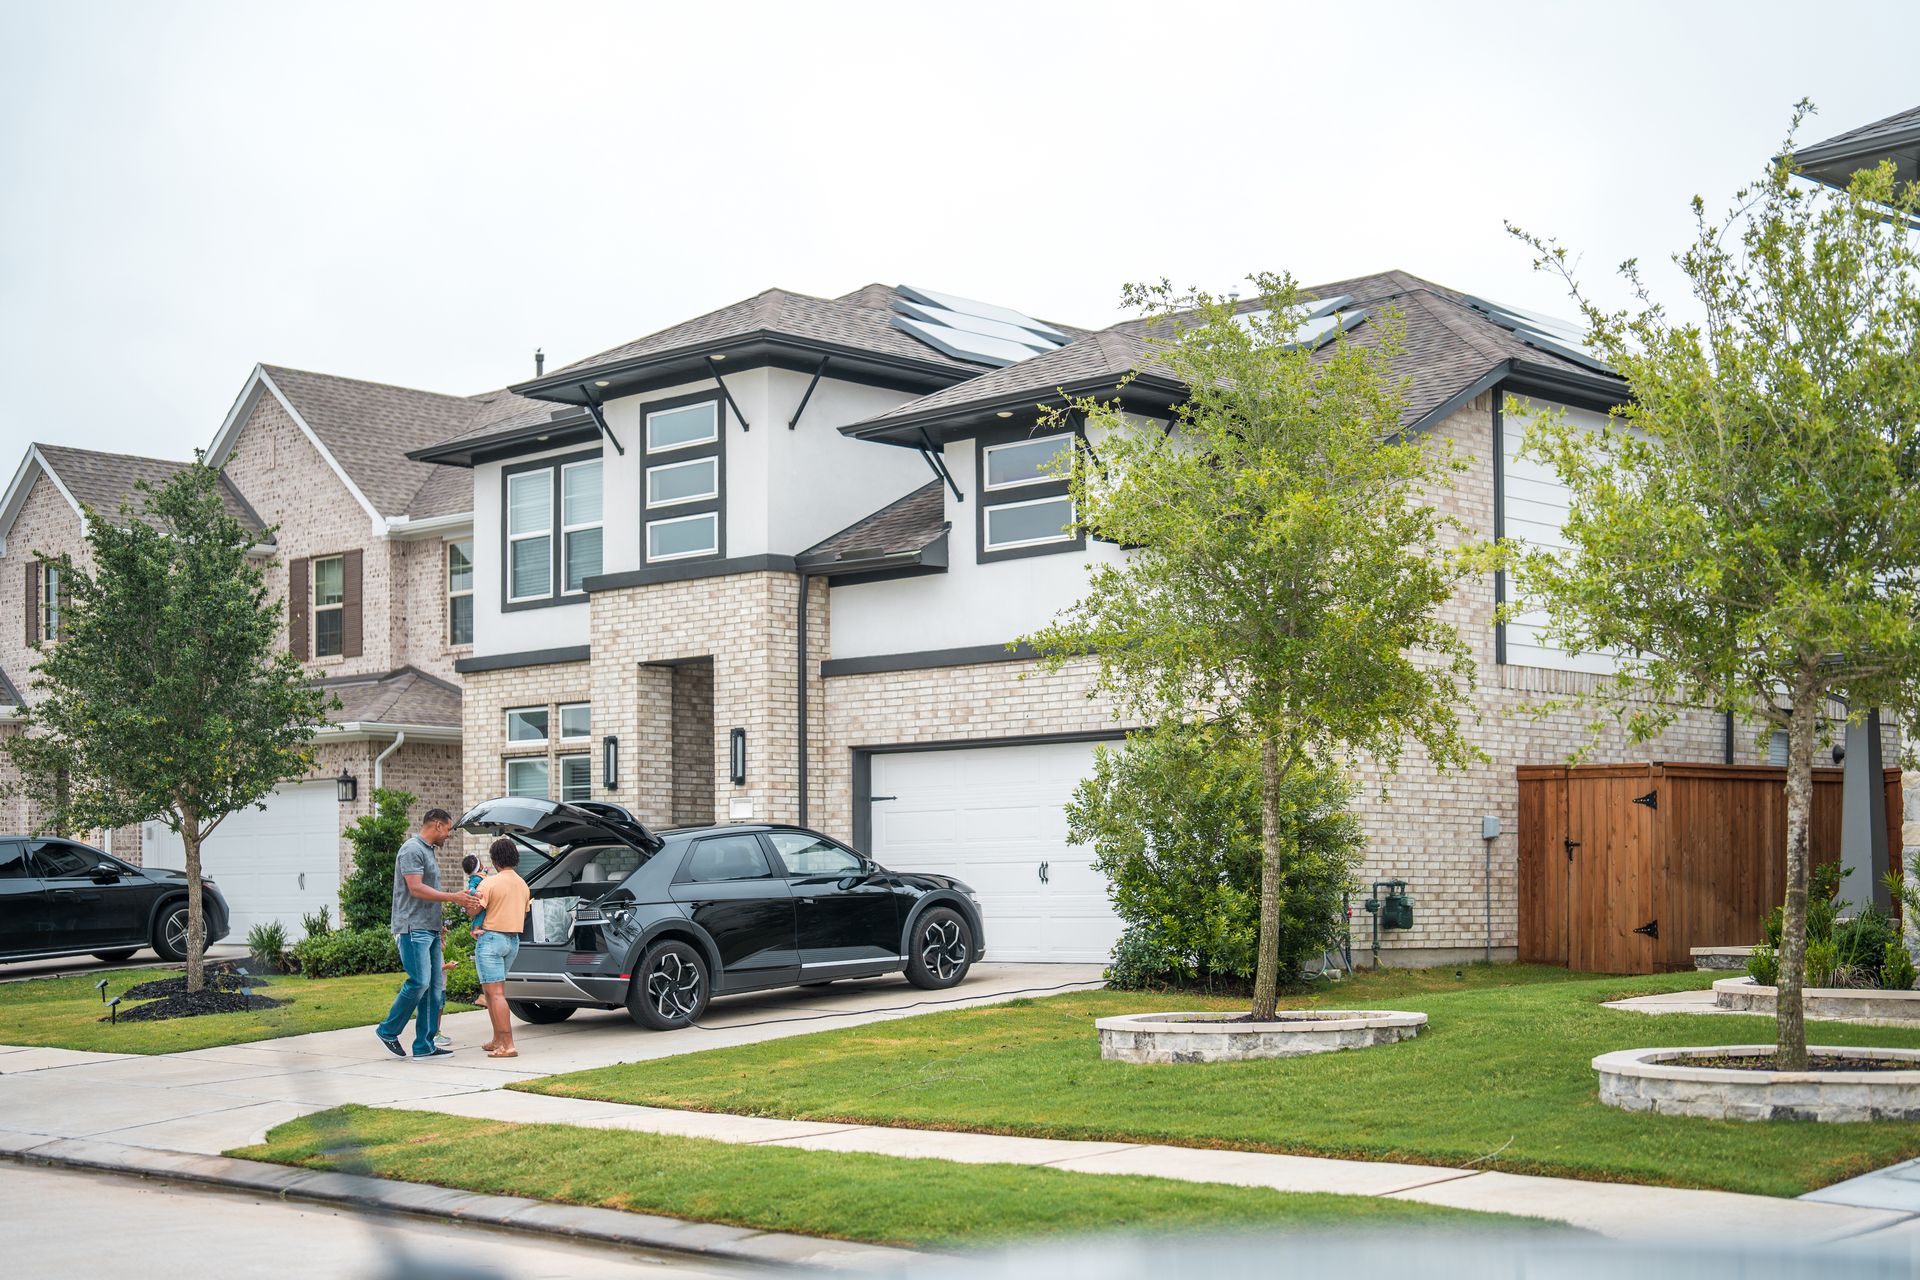
Houston's seller surplus of 96.5% translates into an absolute gap of approximately 22,157 more sellers than buyers — the widest numerical difference in the entire analysis. With 45,122 sellers and 22,965 buyers, the city's market operates at a scale where the imbalance is visible not just in percentages but in the sheer volume of homes competing for buyer attention. Texas's permissive development environment and Houston's historically high homebuilding rates created an inventory base that demand has not matched.
The city's real estate market has long reflected Texas's broader construction posture: fewer zoning restrictions, lower permitting costs, and an active homebuilder sector that delivers new units at a pace most other major metros cannot approach. During the pandemic, that activity accelerated as demand spiked. The delivery of those units continued into 2025 and 2026, adding new inventory to a market where buyer urgency had faded alongside the emergency conditions of pandemic-era migration.
Houston's economic base, centered on energy, healthcare, and logistics, provides more employment stability than technology-dependent metros such as Austin. Yet even a stable job market has not produced enough buyer demand to absorb available supply. Buyers who enter Houston's market encounter the practical reality of a large and motivated seller pool: homes sit longer on average, list prices reflect competitive pressure from neighboring listings, and buyers can negotiate without fear of being outbid on most properties.
The scale of Houston's market amplifies every dynamic within it. More sellers means more options and more flexibility for buyers who take time to compare across neighborhoods and price points. Sellers aware of this reality have increasingly moved first on price reductions and concessions, anticipating buyer requests and acting ahead of them. Buyers with financing in place hold a strong position across virtually every price segment, and the size of the surplus means that patience is consistently rewarded with better terms than initial offers would otherwise produce.
Saul Martinez / Bloomberg via Getty Images
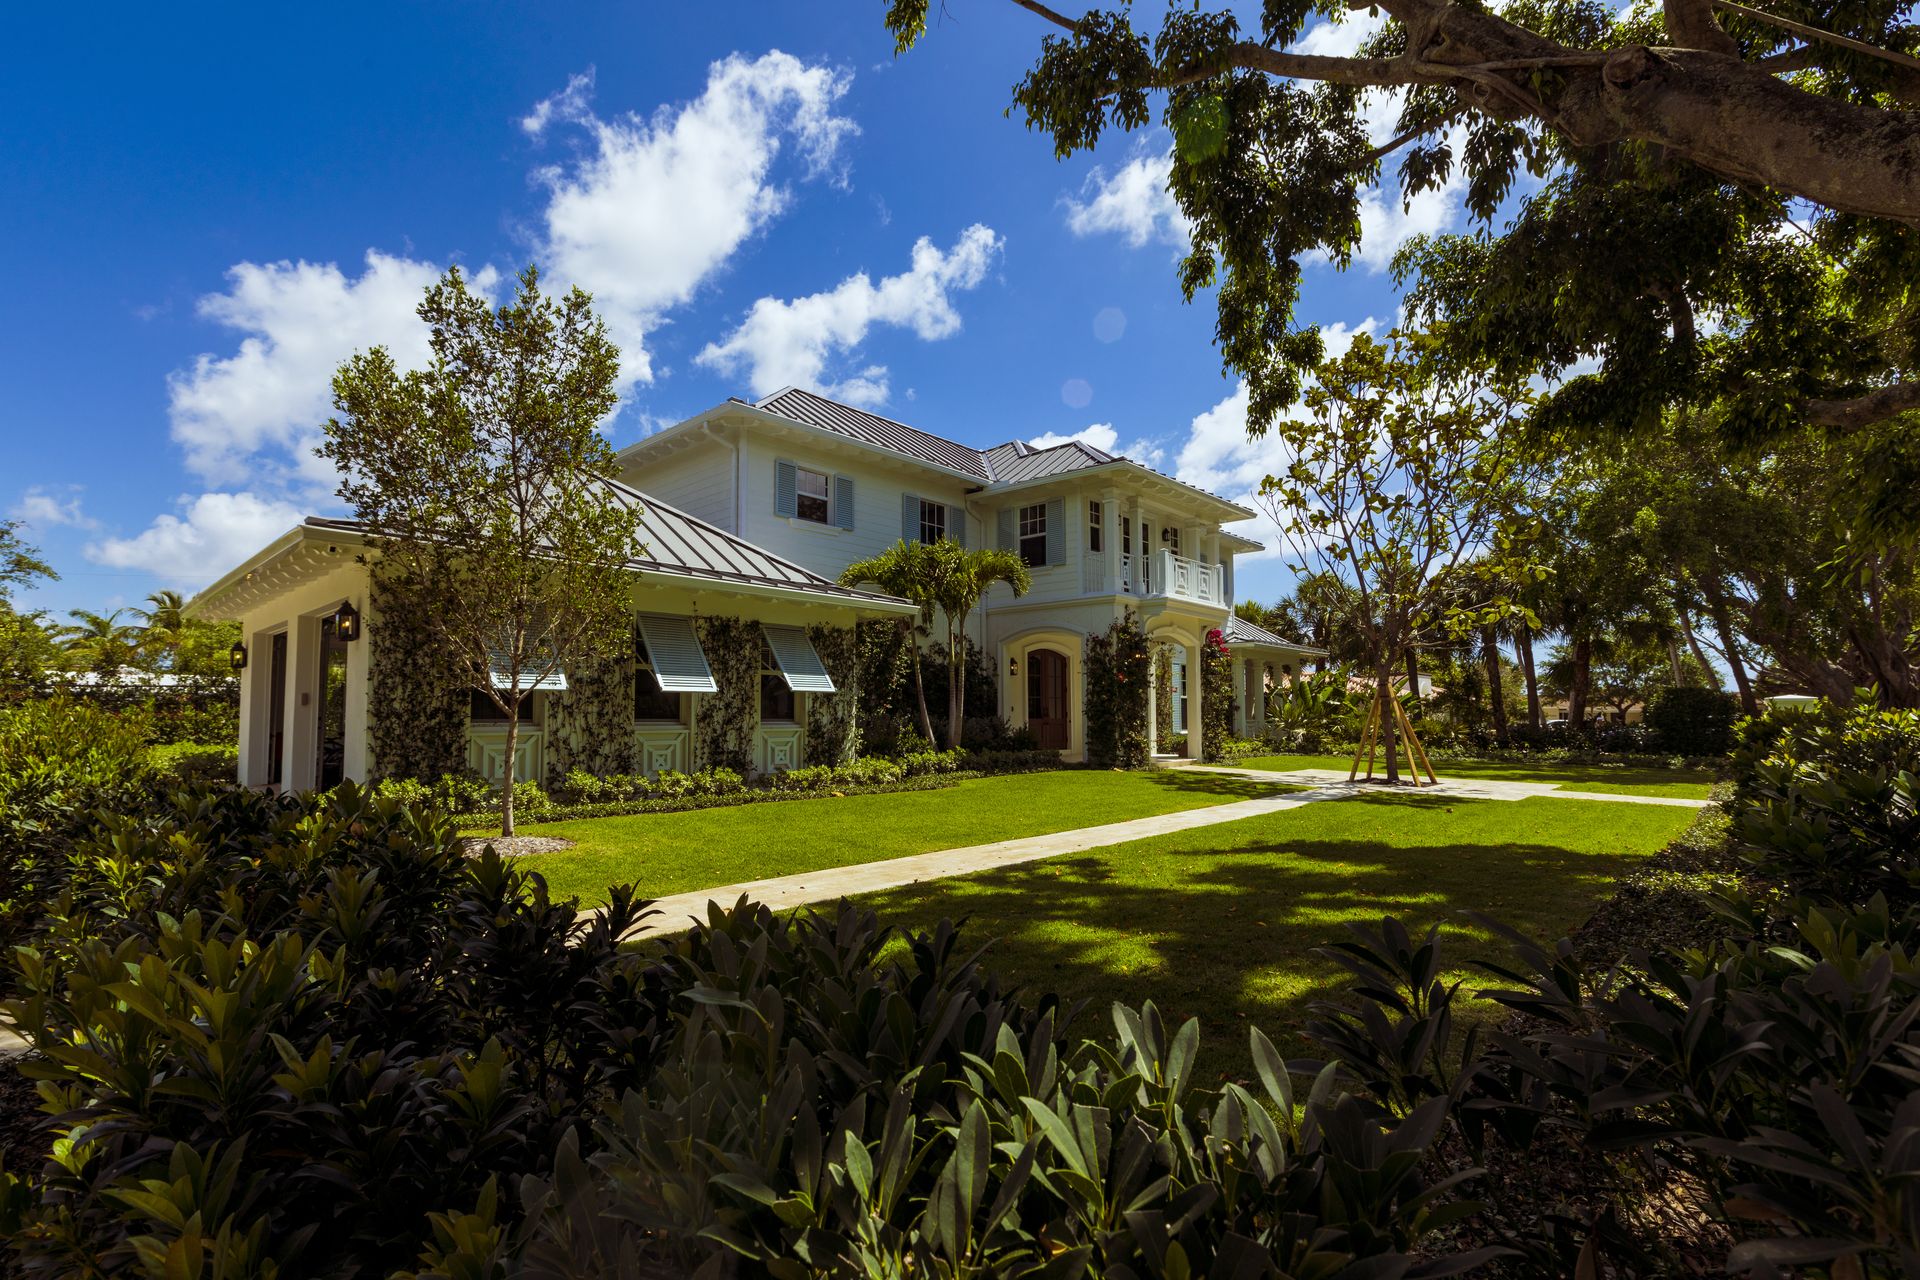
West Palm Beach's estimated 94% more sellers than buyers — with 15,694 sellers and 8,090 buyers — reflects a Florida-wide pattern concentrated in the state's most insurance-exposed markets. The Palm Beach area faces specific natural disaster vulnerability, including hurricane and flooding risk, that has driven homeowner insurance premiums sharply higher. Florida's insurance market has experienced carrier exits and rate increases that significantly affect monthly carrying costs, and buyers factor those costs directly into purchase price negotiations.
Florida's condo market faces an additional structural pressure that has no parallel in other states. Legislation passed following the 2021 Surfside building collapse requires older buildings to complete structural inspections and fund substantial reserves. Associations in many communities have responded with large special assessments and dramatically higher monthly fees. For buyers considering condos — a significant segment of the West Palm Beach market — those costs reset affordability calculations and reduce demand for properties that would otherwise sell competitively.
Sellers in West Palm Beach who hold condos face a particularly difficult market. Insurance costs, potential special assessments, and elevated homeowners association fees create an expense profile that buyers apply as downward pressure on purchase price. Many sellers find that achieving their target price requires months of waiting and accepting contingencies they would not have considered during the strong years of the market.
The surplus of approximately 7,604 sellers over buyers means the market consistently rewards buyer flexibility and punishes seller inflexibility. Sellers who resist negotiation on price, inspection results, or concessions simply wait longer as buyers move toward alternatives. For buyers, the environment supports a measured approach: requesting thorough inspections, negotiating repair credits, and submitting offers below list price with reasonable expectation that sellers will engage and work toward resolution. The depth of the supply surplus across West Palm Beach and the surrounding Palm Beach County area ensures that buyer leverage extends well beyond distressed or difficult properties.
John Coletti / Getty Images
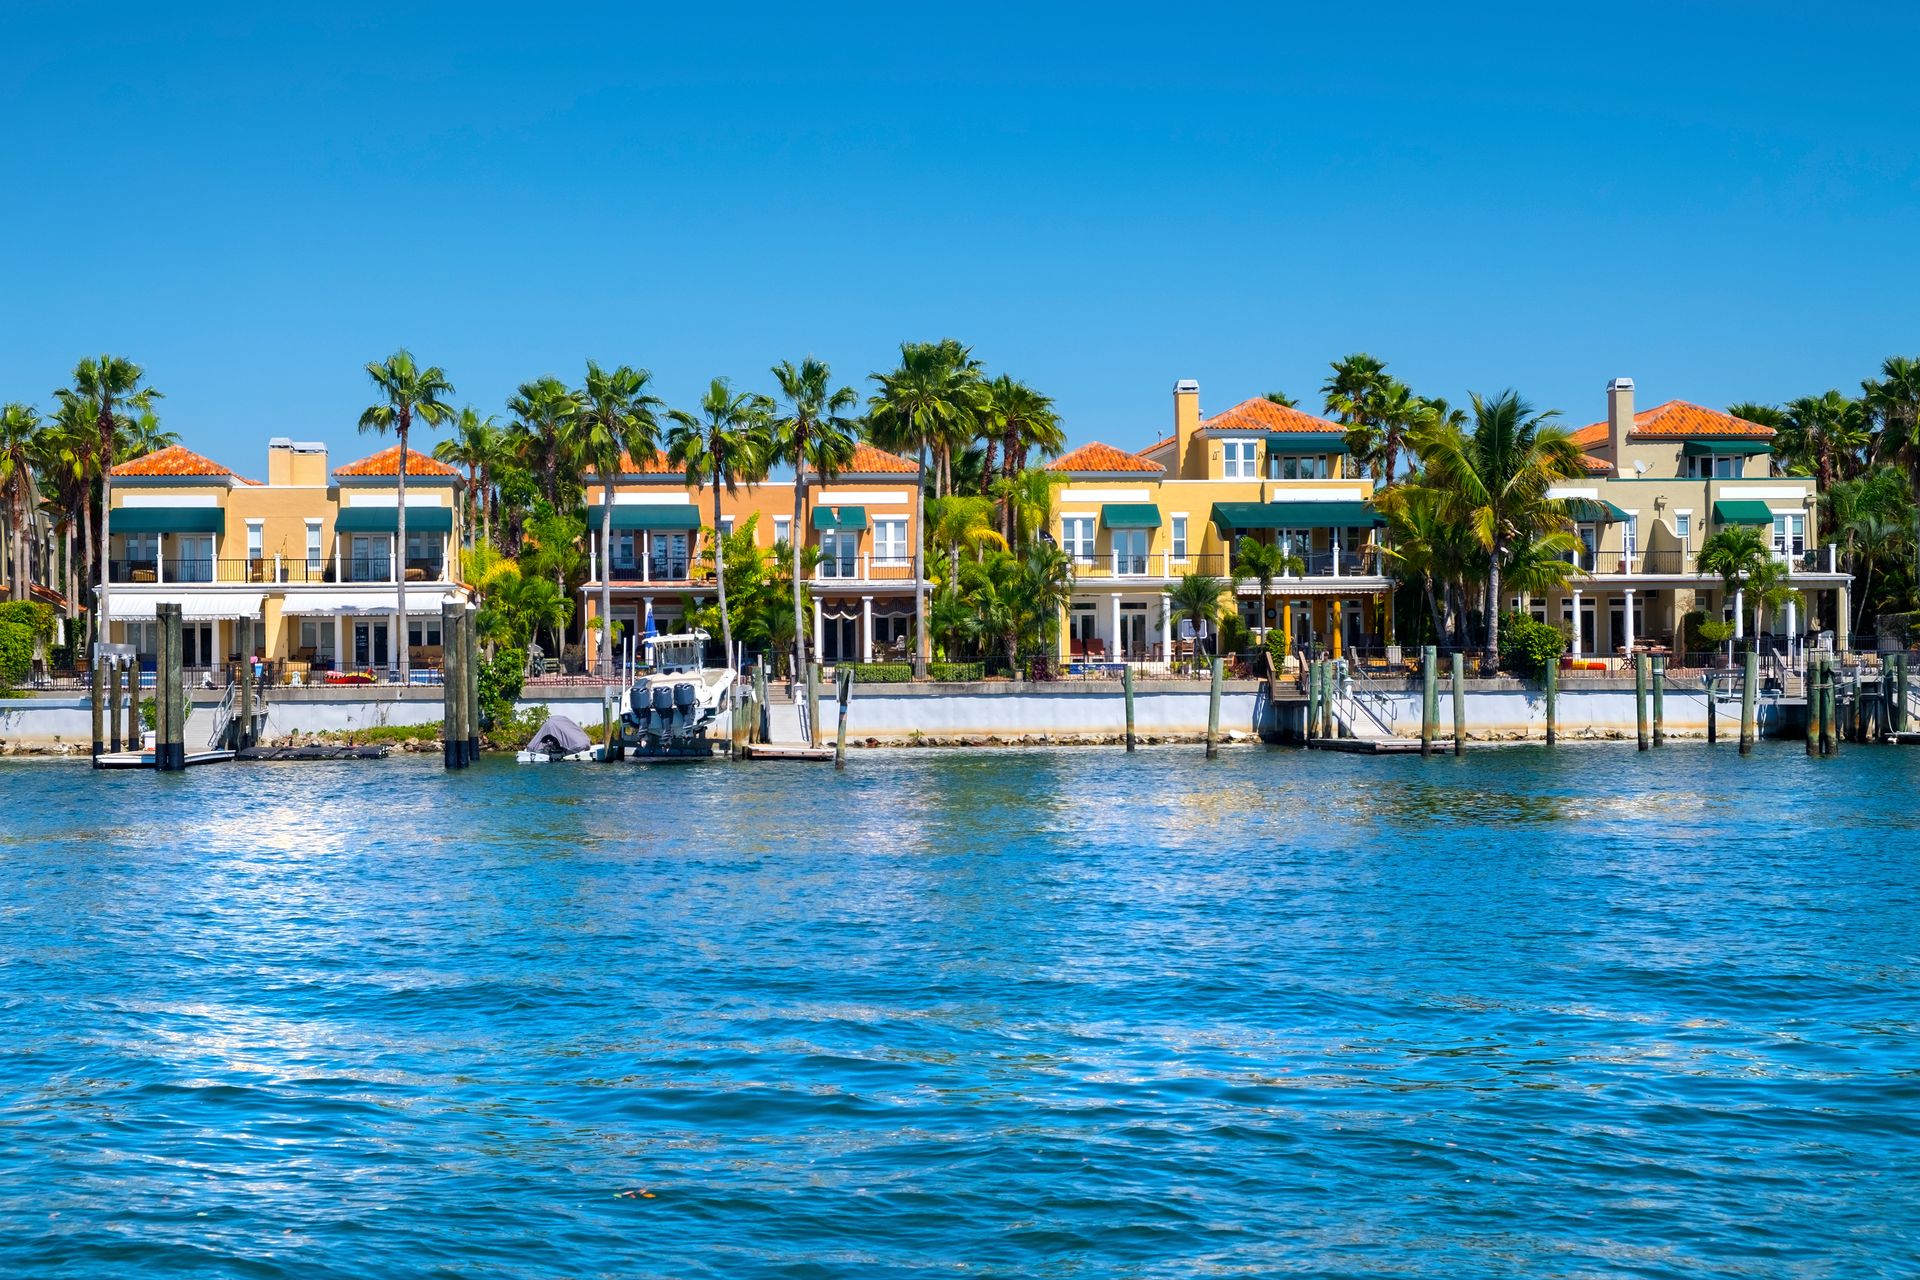
Tampa's estimated 82.7% more sellers than buyers produces a surplus of approximately 10,805, with 23,869 sellers competing for 13,064 buyers. The city sits within the same structural environment as other Florida metros: elevated insurance costs, new condo fee requirements, and a buyer pool that has pulled back after the pandemic surge. Tampa drew strong in-migration during 2020 and 2021, and that demand wave has crested, leaving a market with more supply than active buyers can clear efficiently.
The insurance dynamic carries particular weight in Tampa because the metro lies directly in the path of Atlantic hurricanes and has experienced significant flood events in recent years. Premium increases in the Tampa Bay area have ranked among the steepest in Florida, in some cases adding thousands of dollars annually to ownership costs that do not appear in mortgage payment calculations. Buyers who research total ownership costs find that homes priced attractively on a purchase basis become less compelling once insurance obligations are factored in, suppressing demand and contributing to the seller surplus.
New construction has played a supporting role in Tampa's supply picture. The city attracted significant builder activity during the pandemic boom, and completed units continued entering the market after buyer demand softened. Sellers of new construction and existing homes alike must compete in an environment that rewards competitive pricing and willingness to accommodate buyer requests on timing, contingencies, and concessions.
The practical effect for buyers is a market where patience generates results across all price ranges. Sellers who listed expecting quick, clean sales have revised their expectations after weeks or months without acceptable offers. The growing awareness among sellers that market conditions have shifted has made them more receptive to contingency offers, requests for seller-paid closing costs, and price negotiations that would have been rejected three years ago. Buyers who approach Tampa with current comparable sale data and financing in order consistently find sellers prepared to work toward a deal.
Jeffrey Greenberg / Universal Images Group via Getty Images
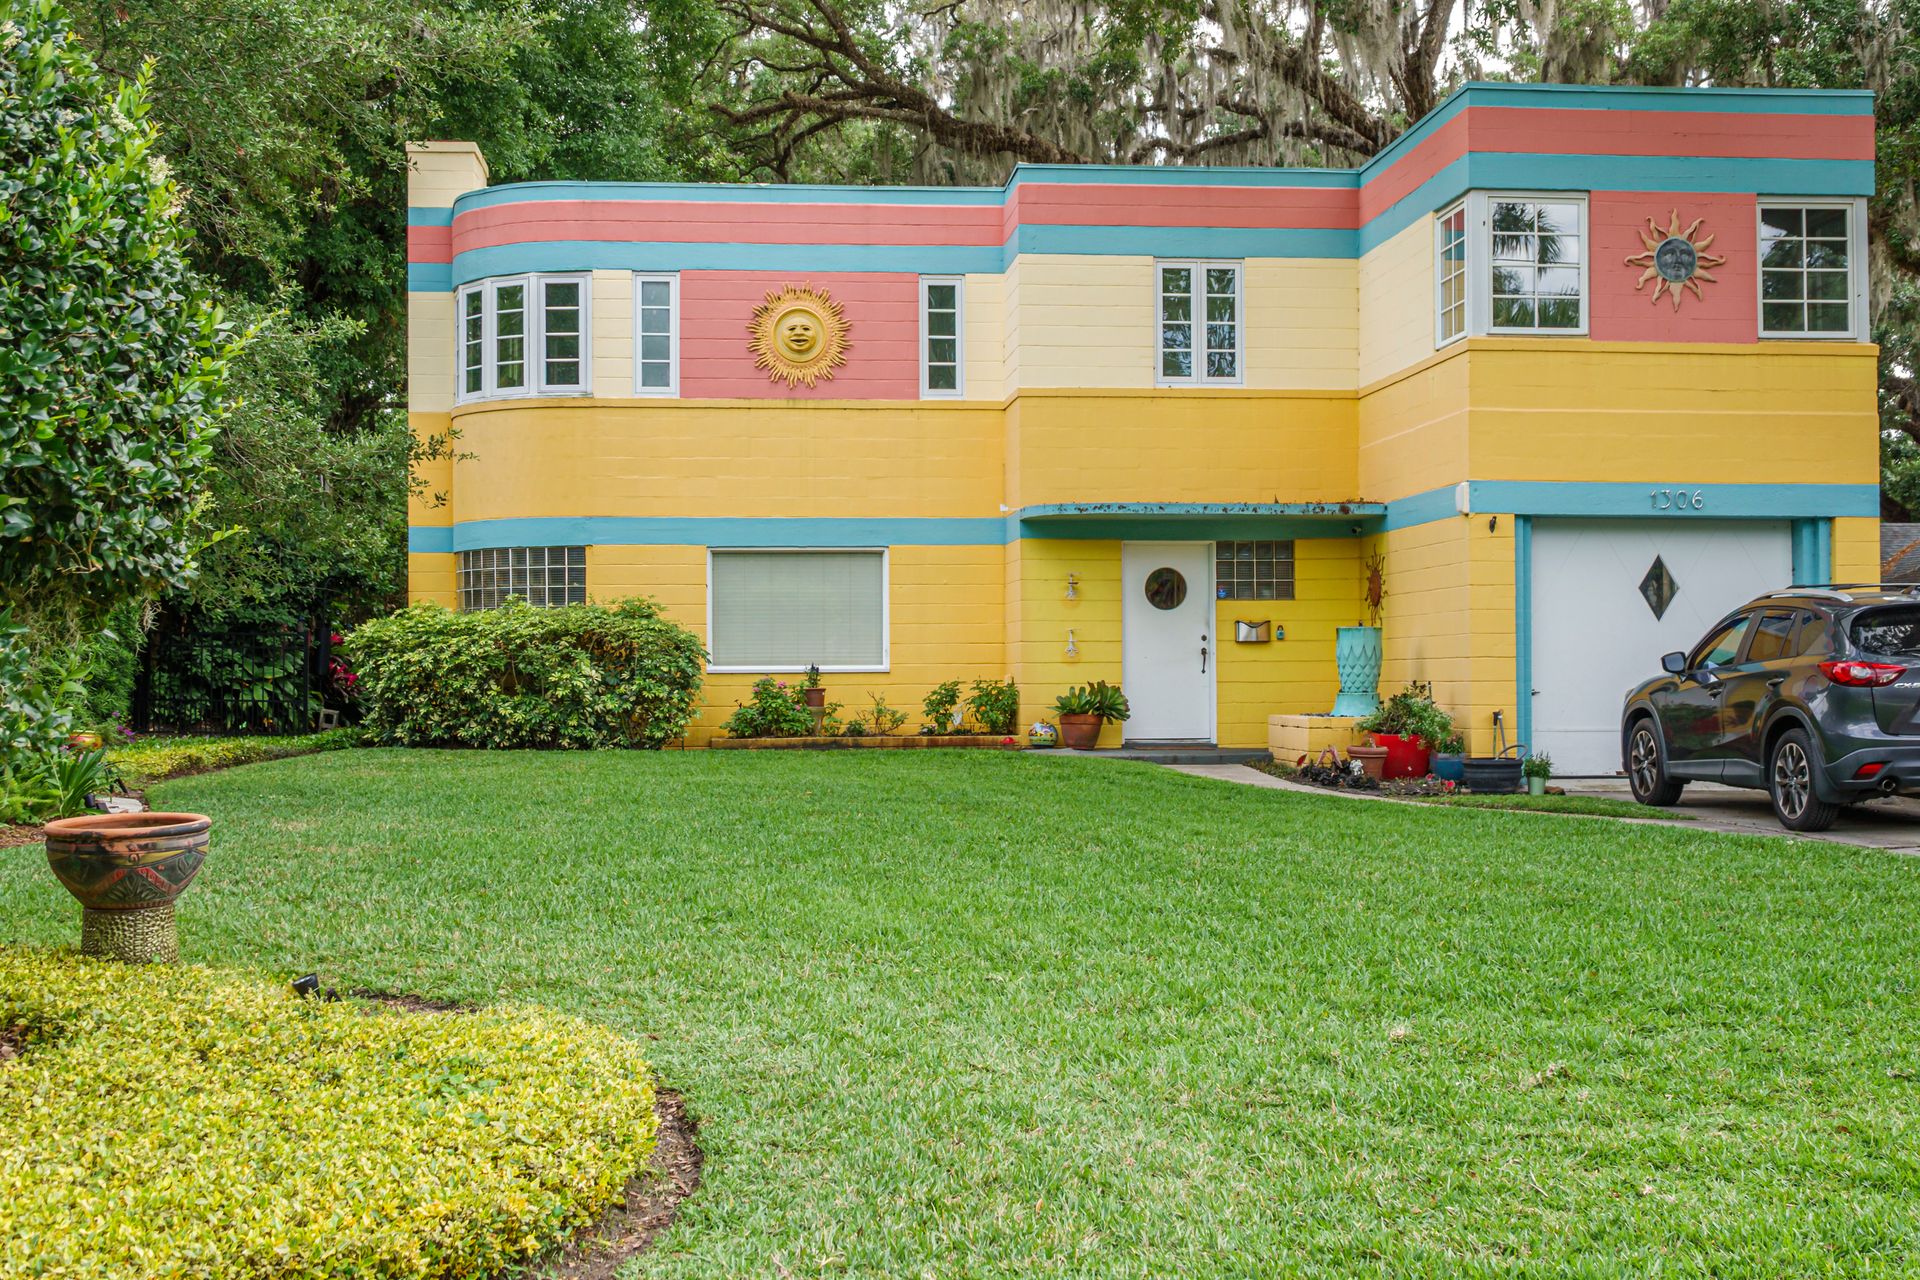
Orlando's estimated 81.4% more sellers than buyers — with 18,075 sellers and 9,965 buyers — places it among the five Florida metros in the top 10, underscoring how broadly the state's structural pressures have affected its major markets. Orlando attracted pandemic relocation buyers from colder northern states and from pricier Florida coastal markets, and that migration demand stabilized the city through 2022 and into 2023. As the relocation pipeline narrowed, supply accumulated from construction activity that had responded to earlier demand, producing the current imbalance of approximately 8,110 more sellers than buyers.
An employment base in hospitality, tourism, and services differs from the technology-heavy profile of markets such as Austin, but the buyer hesitation is comparable in effect. Workers in variable-income sectors face their own version of economic uncertainty, making commitment to a large mortgage more psychologically difficult during periods of broader labor market concern. That hesitation contributes to a buyer pool smaller than the inventory base requires to clear efficiently.
The Florida insurance environment applies across Orlando's market as well, though the city's inland location provides somewhat less hurricane and storm surge exposure than coastal metros such as Tampa or Miami. Even without that extreme vulnerability, insurance costs have risen materially across the state, and buyers factor them into total cost calculations. Properties with older roofs or outdated systems that increase insurance costs face additional discount pressure from buyers who model the full ownership expense before committing.
Sellers have responded to the market by extending listing periods and adjusting prices more frequently than they did during the competitive years. Buyers who approach Orlando with current comparable sales data and a clear understanding of seller motivation find consistent room to negotiate. The surplus of 8,110 more sellers than buyers means buyer leverage is not limited to distressed or difficult properties — it extends broadly across price ranges and property types throughout the metro, giving well-prepared buyers a structural advantage that persists across the entire market.
Charles Harker / Getty Images
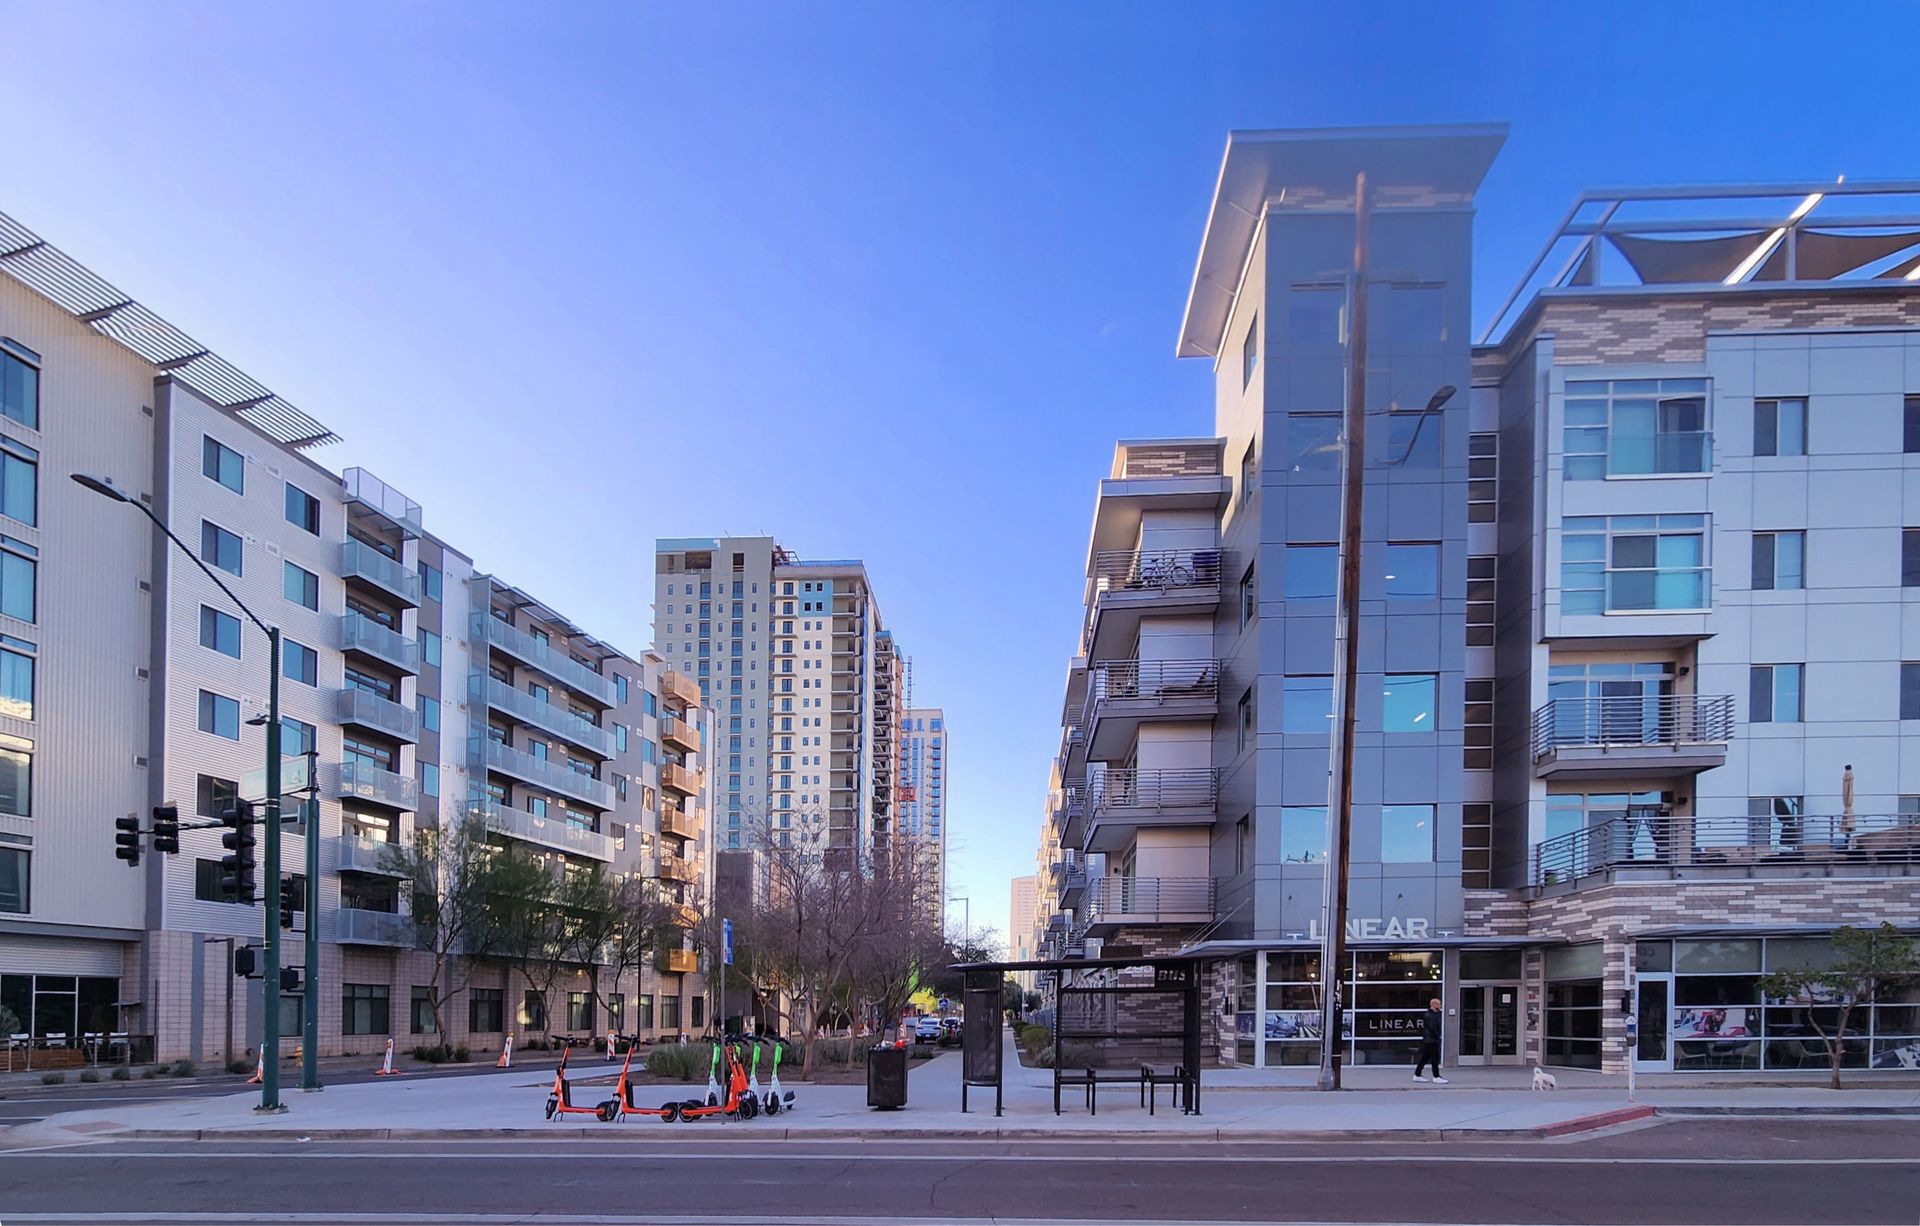
Phoenix's estimated 79.1% more sellers than buyers — with 32,979 sellers and 18,415 buyers — reflects the Sun Belt's fundamental pandemic-era miscalculation: builders scaled production to meet a demand surge that has not persisted at its peak intensity. The surplus of approximately 14,564 sellers over buyers is large in absolute terms, reflecting the scale of a metro that attracted substantial migration from California and the Pacific Northwest during 2020 and 2021. Arizona's homebuilding sector responded to that demand by accelerating permitting and construction well past what the market can currently absorb.
The state has fewer regulatory constraints than West Coast markets, and its labor and land costs allow new home production at a pace that Eastern and Midwestern metros rarely match. Those units have delivered into a market where buyer urgency has diminished considerably: the emergency conditions of pandemic-era migration have passed, mortgage rates remain elevated relative to the historical averages buyers experienced in 2020 and 2021, and buyers who moved to Phoenix in prior years have already settled their housing needs.
California migration has cooled, reinforcing the buyer-side weakness in Phoenix's market. When California buyers relocated to Arizona during the pandemic, they often arrived with substantial equity from high-priced California homes that allowed them to pay above list price and waive contingencies. That buyer profile has thinned significantly. Active buyers in Phoenix today are more likely to be local residents, employment transferees, or first-time buyers working within standard mortgage constraints — a pool that cannot absorb supply at the pace California-equity buyers sustained during the boom years.
Sellers face a more deliberate, cost-conscious buyer and must price and negotiate accordingly. Homes that sit at or above market value without differentiation accumulate days on market and eventually require price reductions to attract offers. Buyers who approach Phoenix with financing in hand and current knowledge of comparable sales find the market consistently responsive to below-list offers and contingency requests. The depth of the surplus — more than 14,500 more sellers than buyers — means that buyer leverage extends across segments, from entry-level homes to move-up properties, giving prepared buyers a durable advantage throughout the metro.