Some owners owe more than their property is worth. ATTOM tracked equity-rich and underwater rates in 50 states to find which rank at each extreme
travelview / Getty Images
Owning a home is one of the most reliable ways Americans build financial security, but that wealth accumulates at very different rates depending on where the home sits. One owner may have paid off more than half of what their property is worth while a neighbor in another state carries far more debt than the home could fetch if sold today. Those two conditions — equity-rich and seriously underwater — sit at opposite ends of the spectrum that defines what homeownership actually delivers to a family's balance sheet, and the distance between the country's best and worst performers is far wider than most buyers consider before signing a mortgage.
Markets where equity accumulates fastest are not always those with the priciest homes. Long ownership, stable appreciation, and low leverage all play a role, as do markets that attract buyers who stay for decades. Conversely, the states with the worst conditions share structural weaknesses — flood exposure, stagnant home values, industries whose wage growth has failed to keep pace with inflation — that suppress demand, cap price gains, and leave existing owners holding mortgages worth more than the properties securing them. Those vulnerabilities develop over years and rarely resolve quickly, which is why the same states tend to appear at the bottom of these rankings across multiple reporting periods.
ATTOM is a property data and analytics company that analyzed more than 155 million U.S. residential properties for its Q1 2026 Home Equity and Underwater Report. The report calculated loan-to-value ratios across all 50 states to determine the share of mortgaged homes that are equity-rich, meaning the homeowner owes no more than half the property's estimated value, and the share that are seriously underwater, meaning the owner's outstanding debt exceeds the home's market value by at least 25 percent. The six states below represent the three strongest and three weakest performers on those measures.
Assembly / Getty Images
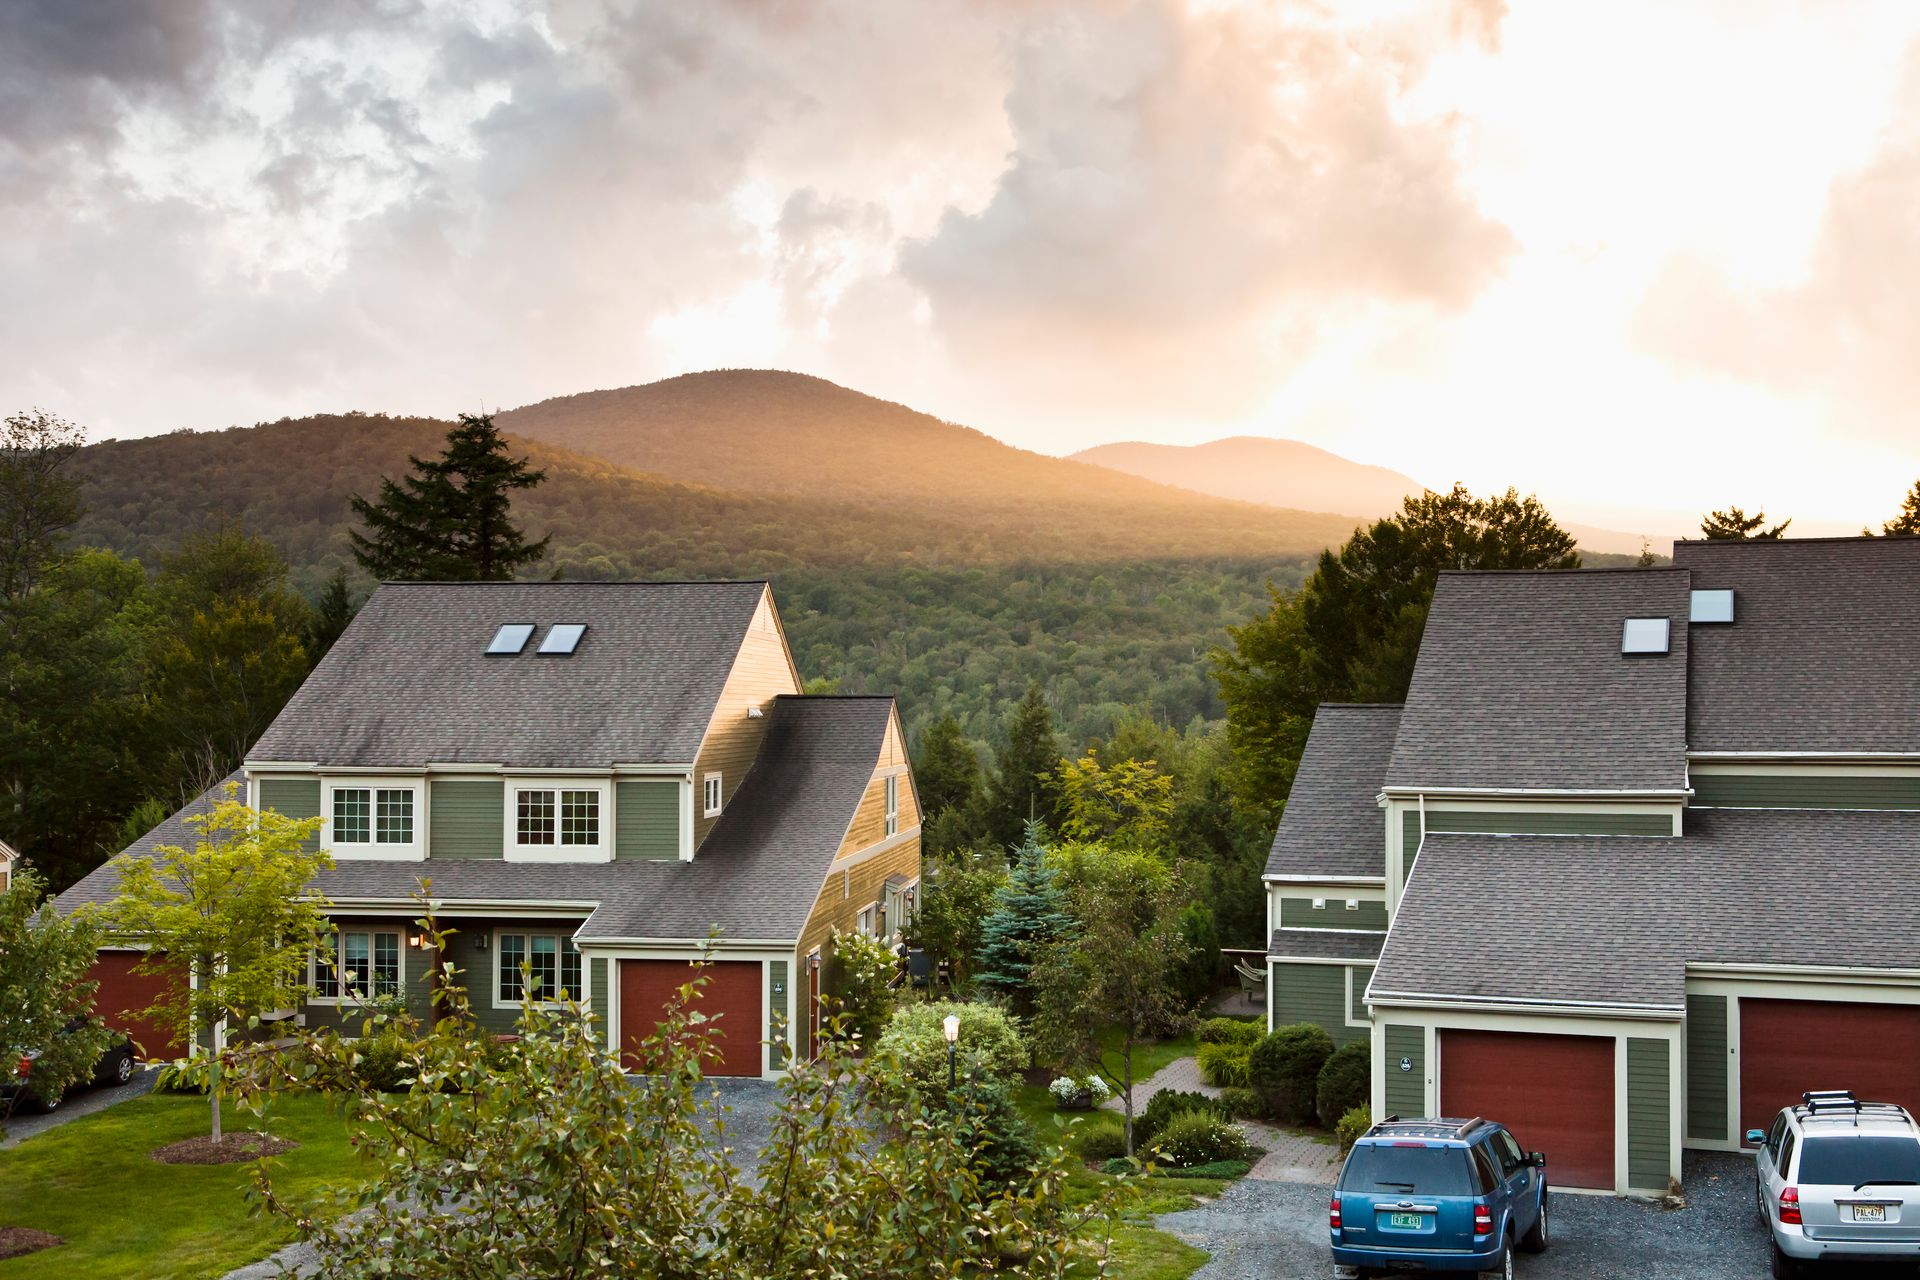
Vermont homeowners have more equity in their properties than those in any other state, with 85.7 percent of mortgaged properties classified as equity-rich in the first quarter of 2026, more than double the national rate of 43.3 percent. No other state comes close. The margin separating Vermont from the second-highest performer is wider than the distance between second place and most of the country, pointing to conditions that set Vermont entirely apart from every other market.
Supply in the state is constrained and demand is consistent. The state's small population, restricted developable land, and stringent environmental regulations have kept inventory tight for decades. Homeowners who buy tend to stay, and long ownership translates directly into paid-down balances. A loan held for 15 or 20 years in a low-turnover market is one where equity accumulates almost by default, particularly when values have moved upward steadily without the sharp reversals that characterize markets defined by overbuilding and speculative demand.
The national backdrop in 2026 reinforces how anomalous Vermont's position is. The equity-rich rate nationwide fell from 44.6 percent in the fourth quarter of 2025 to 43.3 percent — its lowest point since the fourth quarter of 2021 — while the seriously underwater share rose from 3.0 percent to 3.2 percent. Vermont stayed outside that downward current entirely. Its buyer profile favors permanence over mobility, ownership tenure is long by any national comparison, and the relationship between average loan balances and average home values across the state produces equity-rich figures that no other market approaches. For buyers whose priority is building wealth through real estate, Vermont's consistent placement at the top of this metric is a structural advantage that income alone cannot explain. Nationally, the equity-rich share fell in the majority of states quarter-over-quarter and year-over-year, which places Vermont's position — holding steady well above 80 percent — in sharper relief against the broad deterioration affecting most U.S. housing markets.
Reed Kaestner / Getty Images
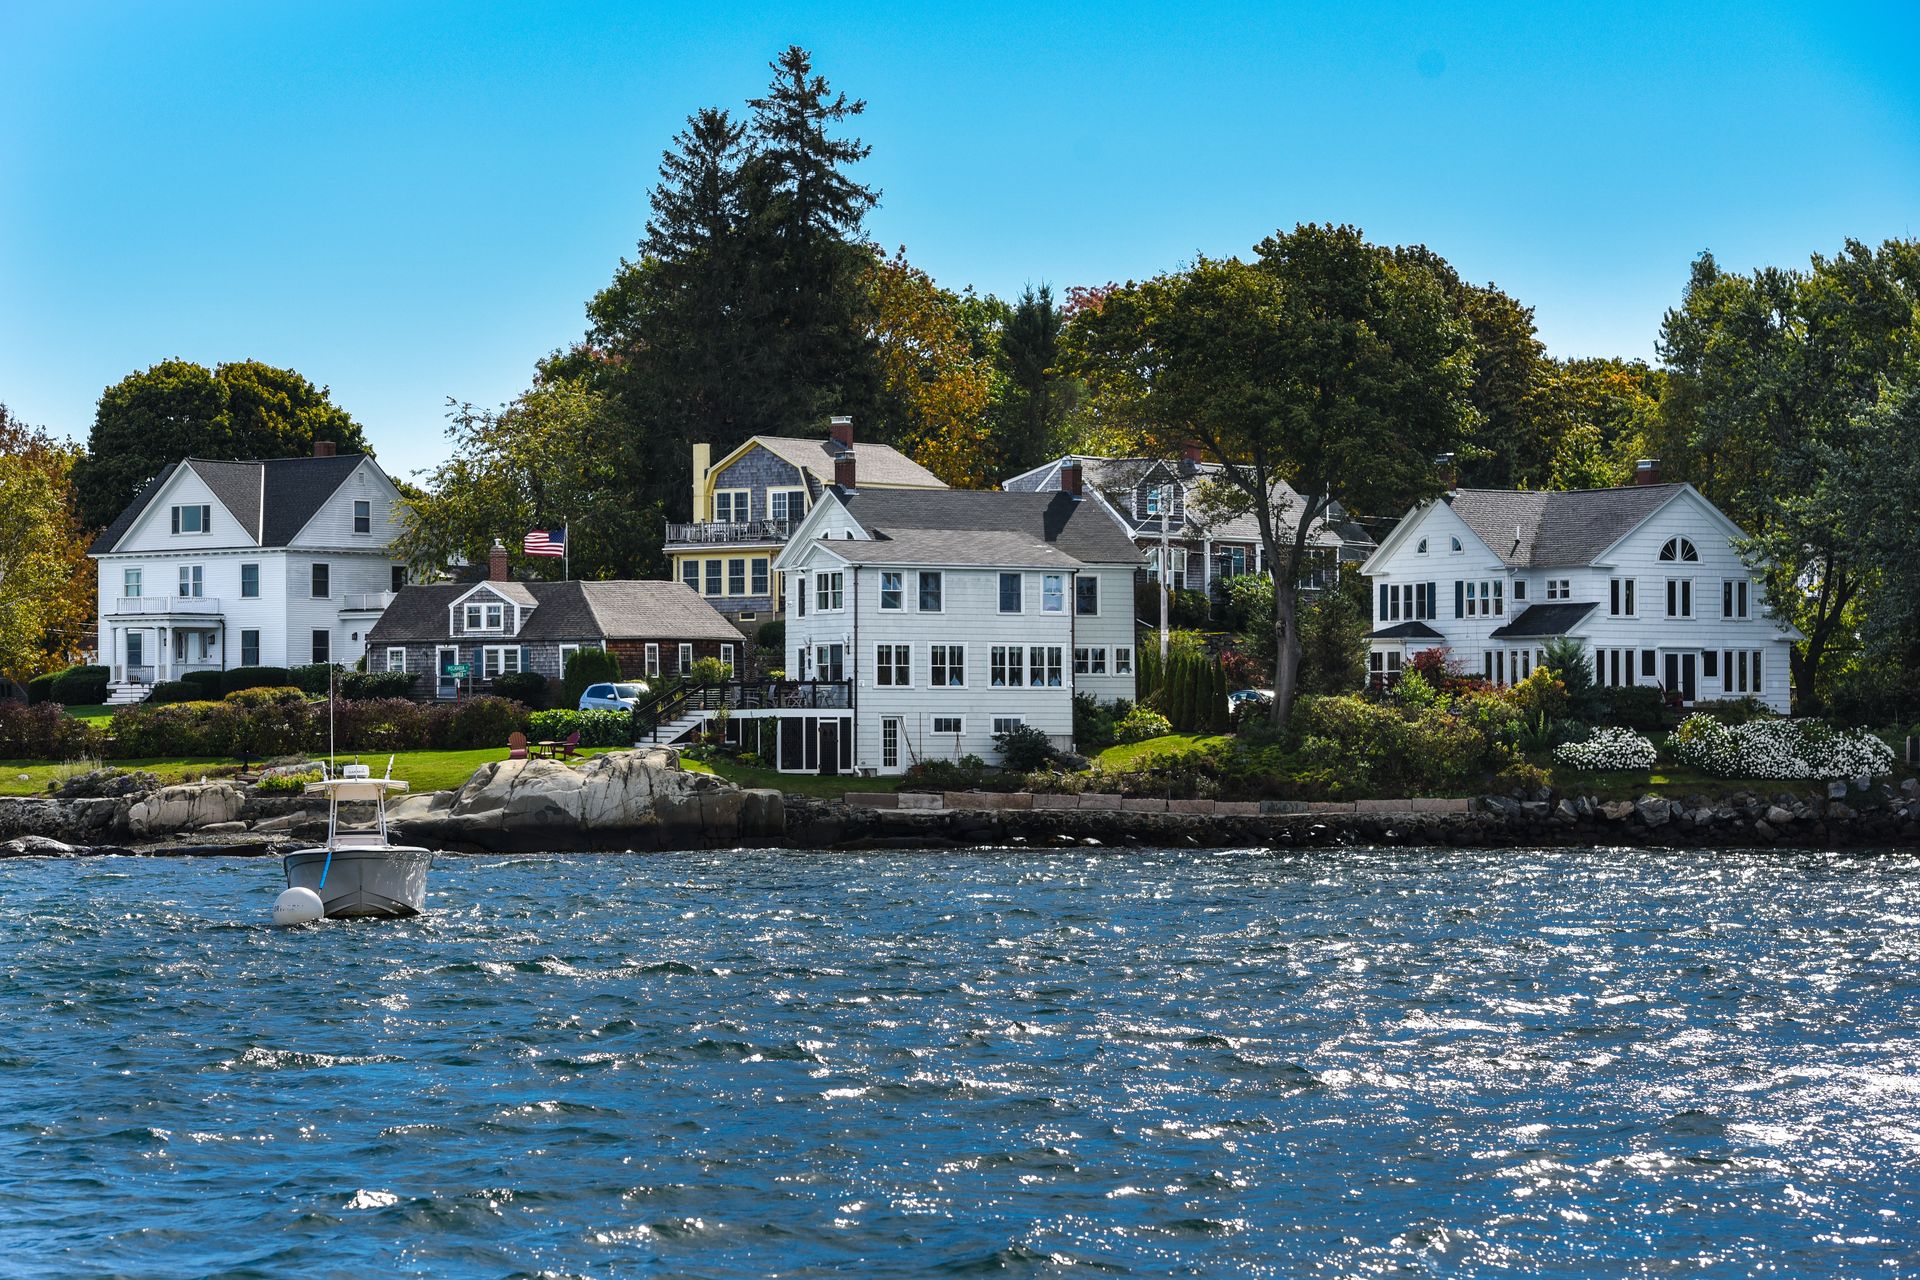
New Hampshire homeowners pay down their mortgages faster than those in almost any other state, with 58.1 percent of mortgaged homes classified as equity-rich in the first quarter of 2026, well above the national rate of 43.3 percent. Its position is particularly notable because New Hampshire was one of only six states where the equity-rich share actually increased year-over-year. The share rose from 54.1 percent in the first quarter of 2025. New Hampshire's year-over-year gain came as the national rate declined from 44.6 percent.
The conditions behind New Hampshire's equity performance mirror the dynamics across northern New England. Housing stock is older and built on decades of stable ownership, not speculative construction. Turnover is low, and buyers who enter the market tend to hold their properties long enough to pay down substantial portions of their mortgages before selling. That pattern keeps loan balances well below market values across a broad range of property types and price points, not just at the high end.
New Hampshire's proximity to Massachusetts and the greater Boston labor market adds a specific driver to the state's equity performance. Workers who commute south or work remotely for Boston-area employers carry household incomes that significantly exceed what local wages alone would support, allowing them to service mortgages aggressively and build equity faster than the state's own wage base would suggest. That income advantage reinforces appreciation at the same time it supports faster balance paydown, producing a rate that climbed year-over-year from 54.1 percent while most of the country moved in the other direction. New Hampshire's market proves that proximity to economic strength can lift equity conditions even in states with modest home prices, because the force behind equity accumulation is not price level alone but the sustained margin between what owners owe and what their properties are actually worth over time.
DenisTangneyJr / Getty Images
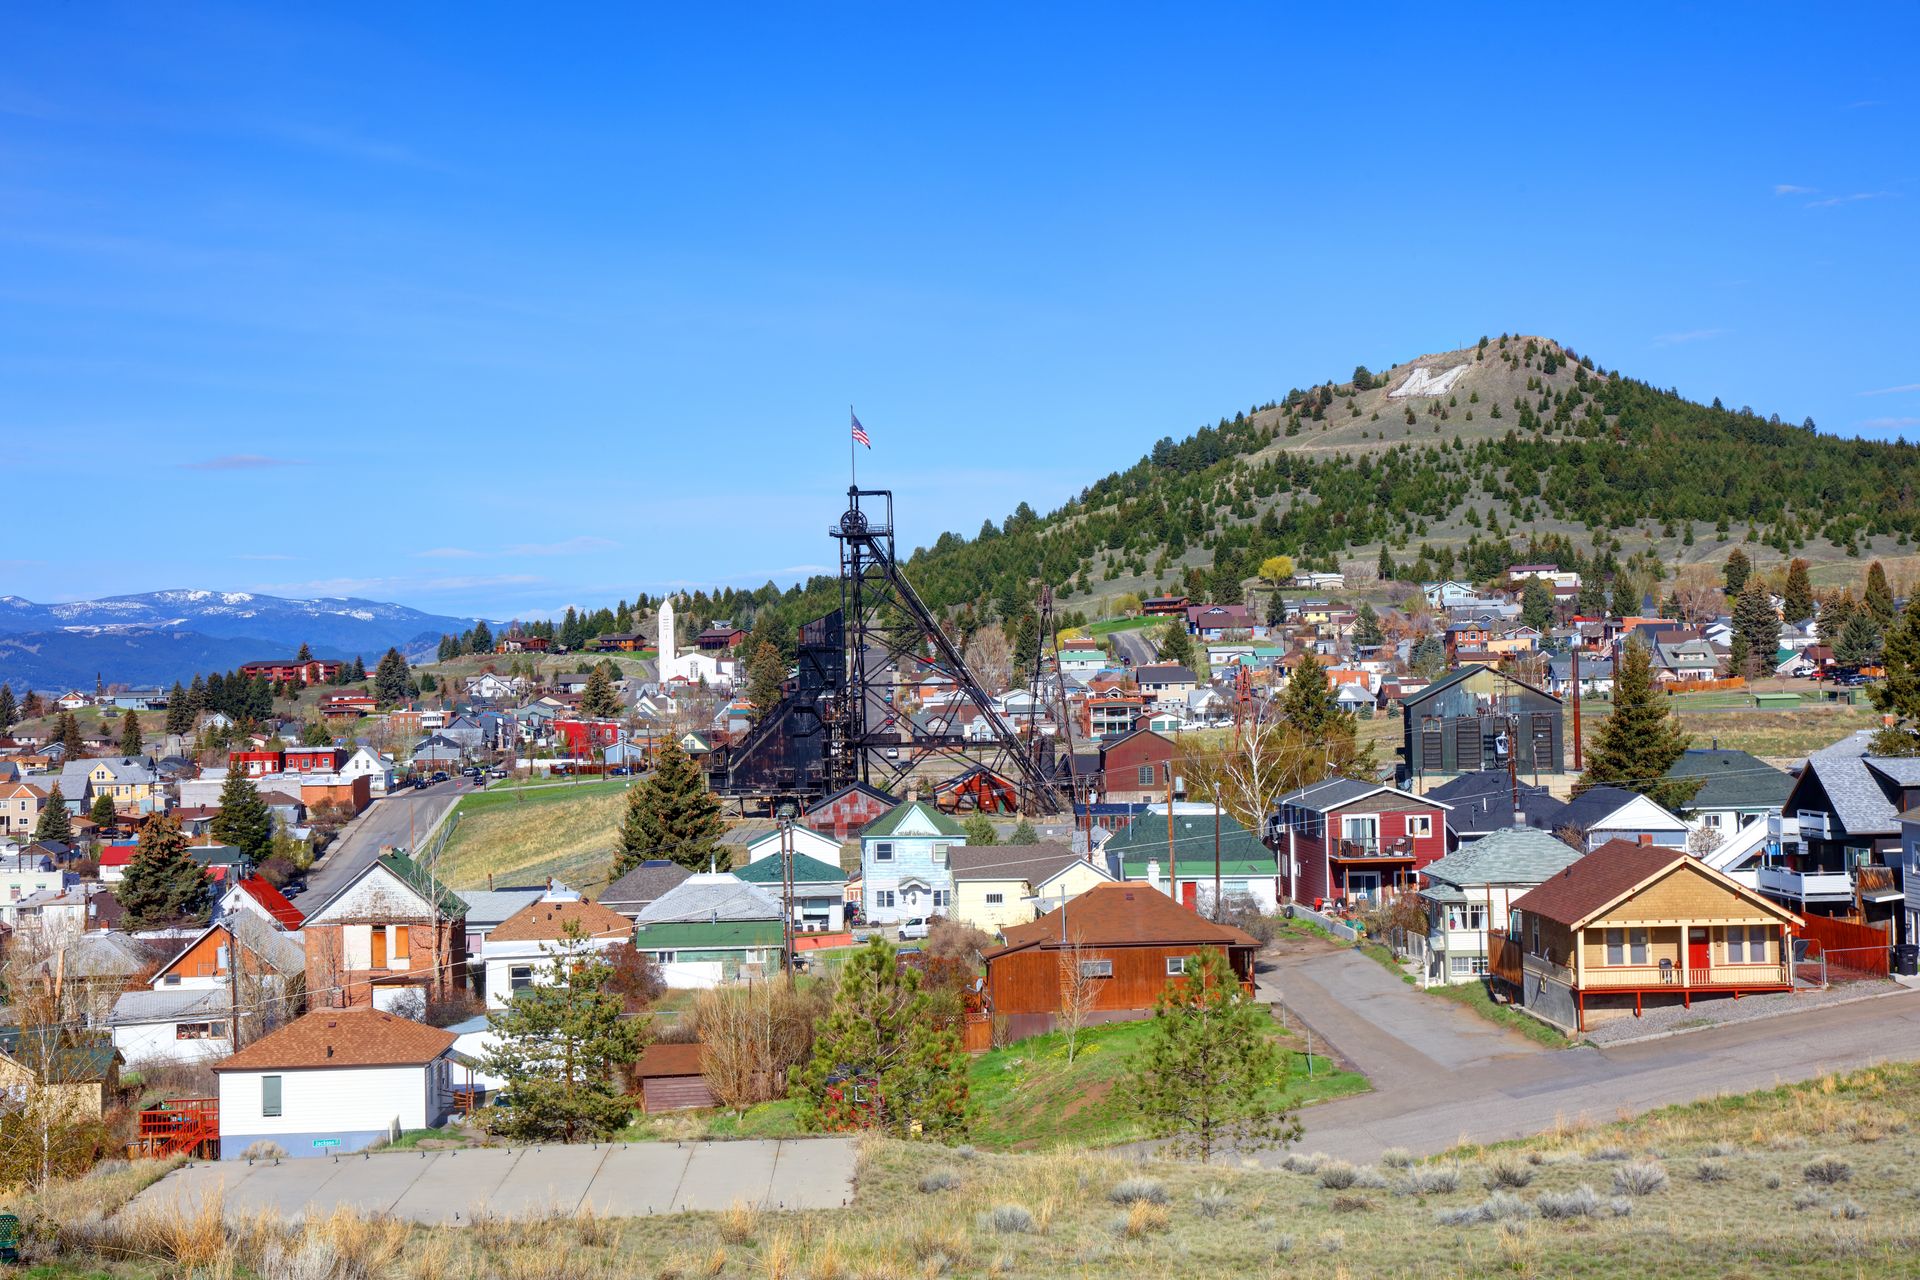
Montana keeps nearly six in 10 mortgaged homes in equity-rich territory, with 57.7 percent of properties reaching that threshold in the first quarter of 2026, placing it third in the country. Montana sits within a cluster of strong performers — Rhode Island at 57.2 percent and Hawaii at 55.8 percent — all of which have stayed well above the national rate of 43.3 percent even as most U.S. markets have softened.
Equity there traces directly to the relocation surge that began in 2020 and drove prices to levels the state had not seen in a full generation. Remote workers and retirees from higher-cost coastal markets bought heavily into Montana, driving appreciation that established equity-rich status for purchasers who funded their acquisitions with proceeds from sales in California and other expensive markets. Those buyers arrived with large down payments, establishing loan-to-value ratios well below 50 percent from the very day they closed.
The state has not been immune to the national moderation that accompanied rising mortgage rates and slower migration volumes. Markets such as Bozeman, Mont., and Missoula have seen the pace of appreciation ease from the peaks of 2021 and 2022. But the equity foundation built during those peak years remains intact across most of the housing stock. Loans established at conservative leverage levels four or five years ago have continued paying down through subsequent years of normal amortization, and the absence of large-scale speculative development means inventory has not grown fast enough to compress values significantly. Montana's first-quarter 2026 equity rate establishes that a stock of mortgaged properties tied to the appreciation cycle of 2020 through 2022 has held its ground against two or three years of moderate softening. Those gains were real and durable, not a statistical artifact of a momentary price spike, and Montana's continued placement in the top five nationally confirms the durability of conditions that formed during that period.

John Coletti / Getty Images
More Louisiana homeowners owe more than their properties are worth than in any other state, with 11.8 percent of mortgaged properties seriously underwater in the first quarter of 2026, up from 10.5 percent a year earlier. The state's rate is nearly four times the national average of 3.2 percent, and the trajectory is worsening. The annual increase of 1.3 percentage points is among the largest recorded for any state.
The structural causes of Louisiana's underwater problem are persistent and well-documented. Hurricane exposure and inundation risk impose ongoing costs — insurance, maintenance, storm damage — that suppress willingness to pay full market value even for well-maintained properties. Suppressed demand caps appreciation, which prevents owners from building equity at a pace that would bring loan-to-value ratios down over time. Repeat storms damage values in ways that standard price indices undercount, because the most distressed properties often stop transacting at arm's length. Premiums in flood-prone parishes have risen sharply in recent years as carriers have exited the market or raised rates dramatically, creating carrying burdens that further erode the financial case for buyers considering entry-level Louisiana properties.
Metro-level data shows how concentrated the problem has become. Baton Rouge, La., carries the lowest equity-rich rate of any large metro in the ATTOM analysis at 17.4 percent and a seriously underwater rate of 11.9 percent. New Orleans sits close behind with 19.1 percent equity-rich and 10.2 percent seriously underwater. At the county level, Vernon Parish has the lowest equity-rich proportion in the entire ATTOM dataset at 6.2 percent, followed by Ascension Parish and Saint Bernard Parish both at 7.2 percent and Iberville Parish at 8.7 percent. The geographic concentration of Louisiana's worst data reveals a market structure built on conditions that consistently block equity from forming, not a temporary disruption that falling mortgage rates alone could reverse.
Robin Zeigler / Getty Images
Kentucky homeowners carry debt that exceeds what their properties are worth at the second-highest rate in the country, with 8.5 percent of mortgaged properties seriously underwater in the first quarter of 2026, up from 7.3 percent a year earlier. The 1.2-percentage-point annual increase has pushed the state well above the national average of 3.2 percent. Equity conditions across a wide portion of Kentucky's housing market have deteriorated measurably.
A specific vulnerability explains why the state's underwater rate keeps climbing. Home values in Kentucky sit well below the national midpoint, which means even modest absolute price drops produce outsized shifts in loan-to-value ratios. When a property worth $150,000 loses $20,000, the owner's equity position changes dramatically in a way that the same dollar reduction would not produce in a market where median prices exceed $400,000. That mathematical relationship makes low-value markets inherently more susceptible to underwater conditions when prices flatten or reverse, because the percentage-point shift in loan-to-value is larger relative to the total asset value.
Greenup County registers only 10.6 percent equity-rich among its mortgaged properties — the fifth-lowest figure in the ATTOM dataset — illustrating that Kentucky's seriously underwater problem is not confined to any single metro but distributed across markets of different sizes and economic profiles. The same South-Central corridor that produces Louisiana's worst outcomes extends into the state. Shared labor conditions, rising insurance costs, and low-value homebuilding generate underwater rates well above what the national average logs as typical for a functioning U.S. housing market. The state's trajectory in 2026 points toward continued pressure as long as mortgage rates remain elevated and low-value segments continue offering minimal cushion against further price softening. The year-over-year increase in seriously underwater properties was the fourth-largest recorded among all states, behind only the District of Columbia, Mississippi, and Louisiana. The concentration of deterioration within the South-Central region is clear from those four states occupying the top positions together.
ParkerDeen / Getty Images
Mississippi homeowners fell further underwater in 2026 at the third-highest rate in the country, with 8.0 percent of mortgaged properties seriously underwater in the first quarter, up from 6.6 percent a year earlier. The 1.4-percentage-point annual increase is the second-largest jump recorded among high-underwater states, behind only the District of Columbia's increase from 3.8 percent to 5.3 percent.
Low incomes, low home values, and limited economic diversification produce the same dynamic visible in Kentucky and Louisiana: small absolute price declines translate into large loan-to-value shifts. The state's seriously underwater rate has been climbing for at least two consecutive years, and nothing in Mississippi's structural profile points toward a reversal without meaningful job growth, population gains, or a sustained decline in carrying costs.
Jackson, Miss., anchors the state's worst outcomes at the metro level. The city carries a seriously underwater rate of 10.4 percent and an equity-rich rate of only 25.6 percent among the large metros in ATTOM's analysis. Both figures place it among the five worst large U.S. metros on each measure simultaneously. Those numbers document both the structural weakness of Jackson's real estate market and the broader pattern in which Mississippi's most distressed cities pull the state's already-poor data further in the wrong direction. Chronic disinvestment, population loss, and infrastructure deficits have suppressed buyer demand in the city for decades, producing a housing market where equity formation is not merely slow but structurally constrained in ways that quarterly data reports can measure but not resolve. The seriously underwater rate in Mississippi rose by 1.4 percentage points year-over-year, one of the largest annual deteriorations in the ATTOM dataset. Without a meaningful shift in the economic fundamentals governing demand in the state's housing market, that trajectory is unlikely to change direction in the near term.
