Green living depends on infrastructure, not just intentions. WalletHub scored all 50 U.S. states to find the top five
Chun Chen / 500px via Getty Images
Every major weather disaster leaves a price tag. Last year, the U.S. absorbed 27 weather and climate events that each caused at least $1 billion in damage. The combined toll reached $182.7 billion. Behind those numbers sits a quieter story about governance, infrastructure, and the daily choices a state makes — or fails to make — on behalf of its residents. Some states have built systems that protect both their people and their land. Others have not. The difference between the two groups is not accidental. It accumulates over years of policy decisions, infrastructure investment, and the public norms a state cultivates around energy, transportation, and land use.
The gap between high- and low-performing states shows up in measurable ways. States with strong renewable energy infrastructure reduce their dependence on fossil fuels and lower the greenhouse gas emissions that accelerate warming. States that invest in public transit cut per-capita gasoline consumption and shrink the carbon footprint of their commuting populations. States that protect water sources and soil quality safeguard the resources their residents rely on most directly.
These advantages compound. A state that performs well across multiple environmental dimensions creates conditions where green living is not an aspiration but a practical reality for ordinary people. Where infrastructure is absent, even motivated residents face structural barriers to reducing their environmental impact.
Earth Day offers a timely reminder of this impact. To identify which states deliver on that standard, WalletHub compared all 50 states across 28 metrics grouped into three dimensions — Environmental Quality, Eco-Friendly Behaviors, and Climate-Change Contributions — and weighted each to produce an overall score out of 100. The analysis pulls from sources including the Environmental Protection Agency, the U.S. Department of Energy, the U.S. Department of Agriculture, and the Green Building Council.
The five states at the top of that ranking share a common thread: sustained, concrete investment in the systems that make environmental performance possible.
jimfeng / Getty Images
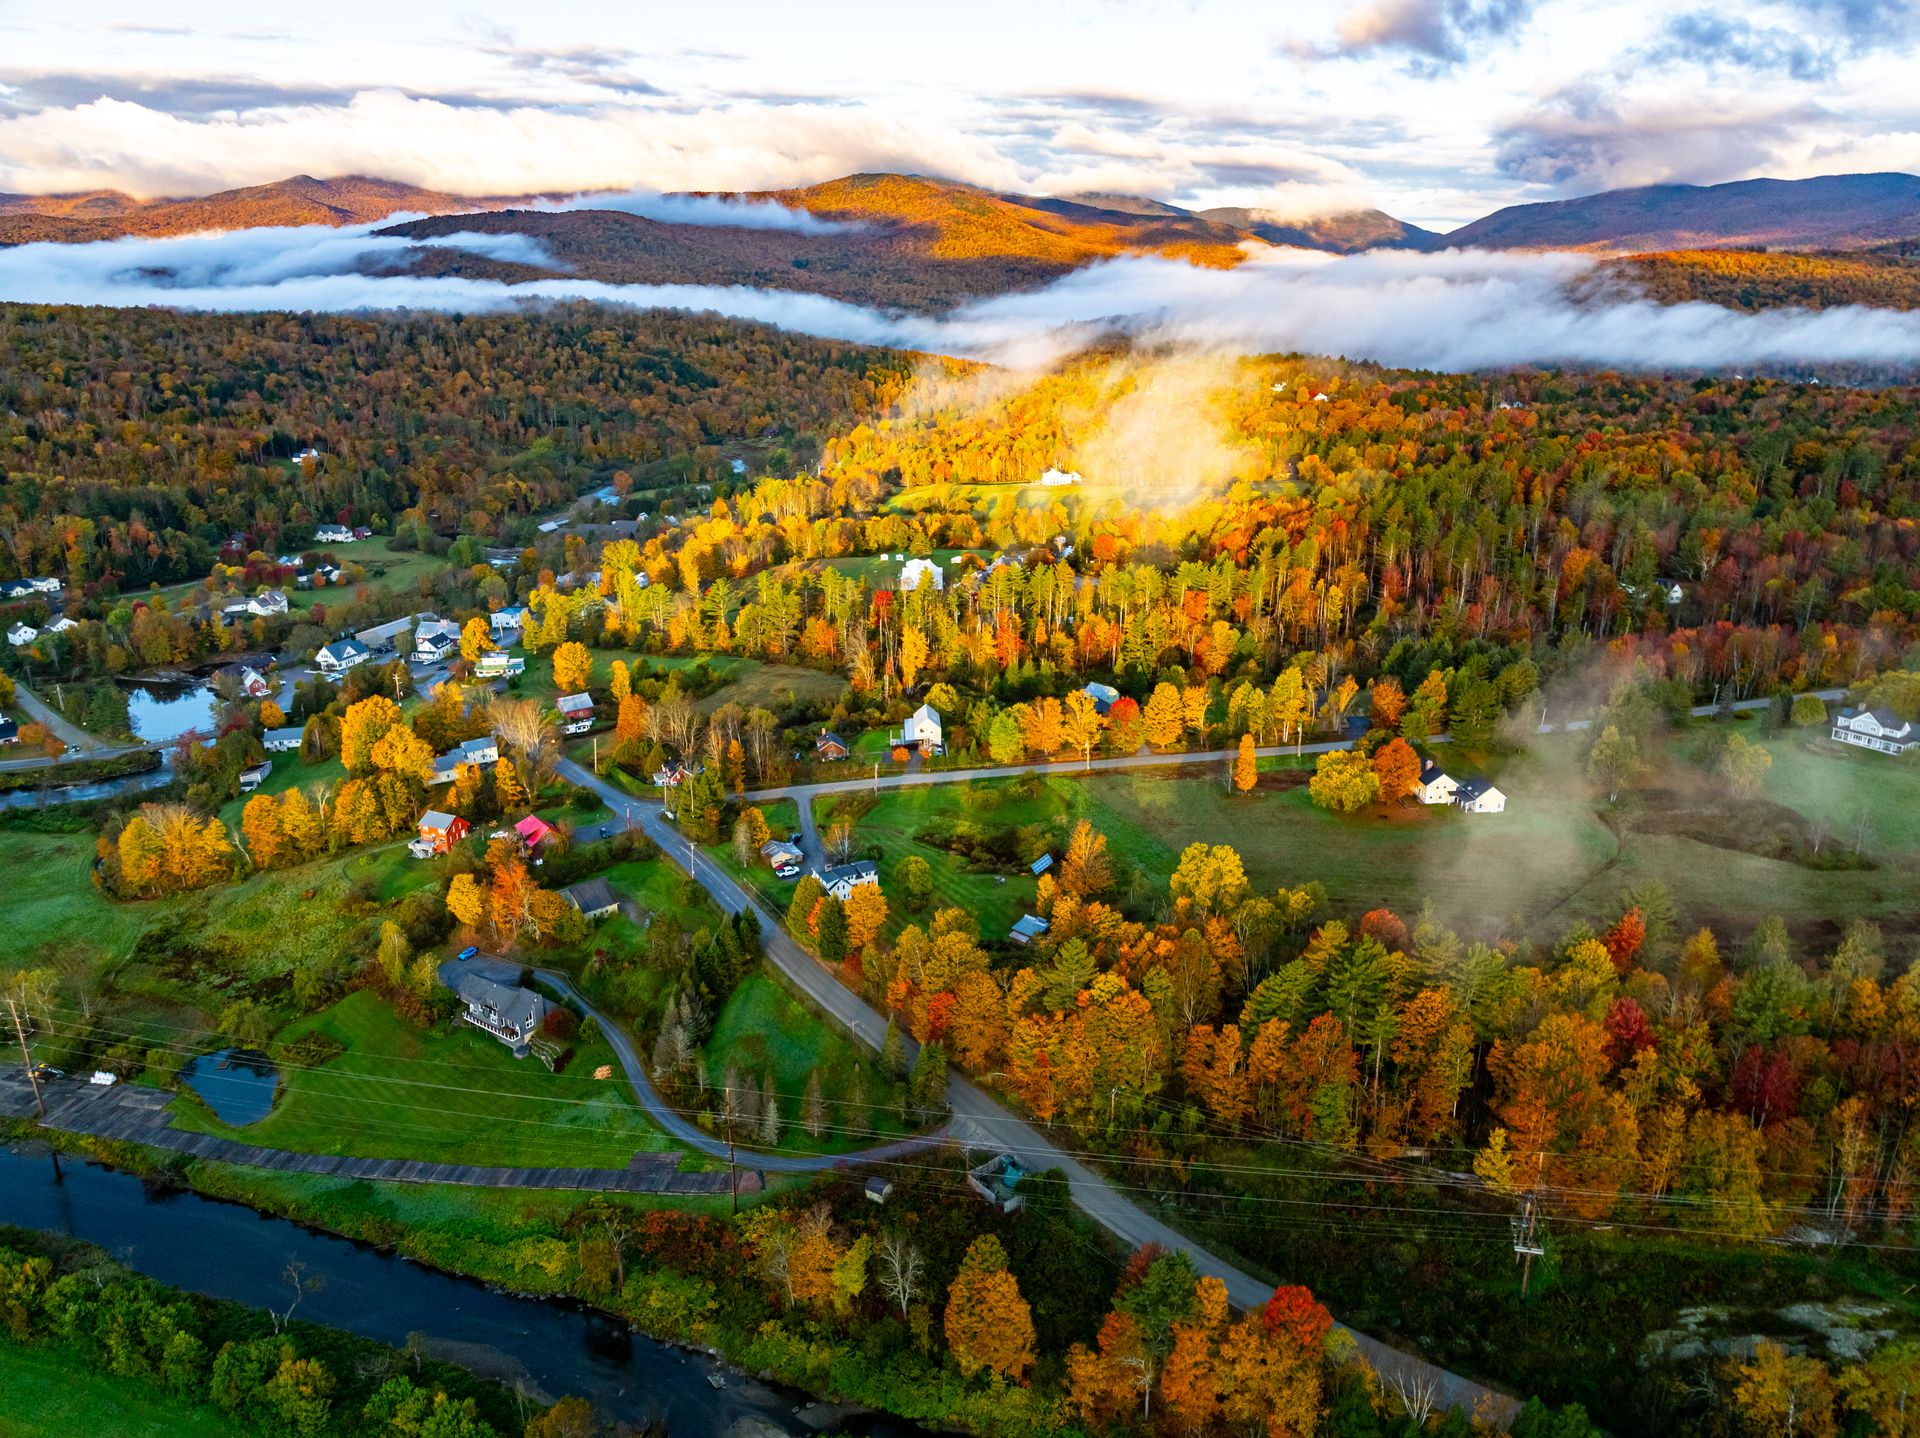
Vermont earned the top overall score of 75.00, with a Climate-Change Contributions rank of second in the country powering that result. The state produces the lowest carbon dioxide emissions per capita of any state, and its methane emissions per capita are third-lowest nationally, a dual achievement that reflects decades of land use policy, agricultural regulation, and clean energy investment working in the same direction.
Vermont holds more certified organic farmland per capita than any other state in the country. That distinction shapes its environmental standing. Organic farms avoid petroleum-based fertilizers, synthetic pesticides, herbicides, and growth hormones, reducing the chemical load on soil and waterways. The result is a farming landscape that produces good food while protecting the environmental systems surrounding it.
Vermont also leads the country in alternative fuel stations per capita, building the infrastructure that makes clean transportation a viable daily option for residents. The state ranks 14th nationally for actual alternative fuel vehicle adoption, a meaningful figure given how heavily rural areas depend on personal vehicles. An Eco-Friendly Behaviors position of 36th suggests room for improvement in areas such as energy consumption and recycling, but its exceptional performance on emissions and organic agriculture pushes its total score above every other state.

Jesse Warren / Getty Images
Hawaii finished second overall with a score of 74.77, anchored by its first-place Environmental Quality ranking. The state records the lowest rate of drinking water violations in the country, reflecting both its geographic isolation and sustained investment in water protection. Clean water access ties directly to public health outcomes, and Hawaii's performance on this metric gives its residents a foundational environmental advantage.
Hawaii is second-lowest in gasoline consumption per capita thanks to its robust public transit system, which reduces pressure on personal vehicle use across its urban corridors. Residential solar power installations have the highest per-capita capacity of any state, channeling the islands' abundant sunlight into household energy generation. Combined with an eighth-lowest overall energy consumption per capita, these figures show a state that has restructured how its residents use and produce power.
Hawaii also has the highest recycling participation rate among U.S. households with recycling access. This behavior reflects both cultural investment and the practical infrastructure the state has built to support it. Its second-lowest air pollution ranking further cements Hawaii's position as the country's strongest performer on direct environmental quality. The state's overall score sits just 0.23 points below Vermont's, making it the closest margin in the entire ranking.

Jon Lovette / Getty Images
California placed third with a score of 72.67. The state holds the country's highest energy efficiency score, a composite measure of how effectively it converts energy inputs into economic output. Strong efficiency performance pulls per-capita energy consumption into the lowest tier nationally, cutting the greenhouse gas footprint.
California sits fifth-lowest in per-capita gasoline use thanks in part to the state's green transportation choices. Approximately 33% of residents rely on public transit, carpooling, biking, or walking to commute. These options help relieve an otherwise enormous emissions burden in the most populous state in the country.
Carbon dioxide, methane, and nitrous oxide emissions per capita push California into the lowest tier, and its Climate-Change Contributions rank of fourth nationally reflects its breadth of coverage. California is only 20th in Environmental Quality — the weakest among the top five states — because it is among the country's worst in air quality. Energy efficiency gains have not yet fully offset its legacy of industrial density and vehicle miles traveled. The overall score of 72.67 places it 1.78 points below Hawaii, a gap that energy and transportation policy could close.

xavierarnau / Getty Images
New York ranked fourth with a score of 72.45, recording the lowest gasoline consumption per capita thanks to its extensive urban transit infrastructure. The state is third in Environmental Quality, behind Hawaii and New Hampshire, reflecting strong performance across air, water, and soil conditions.
New York is the third-lowest in per-capita energy consumption nationwide, a figure that dense population centers pull down. Shared infrastructure in urban environments demands far less energy per person to heat, cool, and power than sprawling suburban or rural geographies. The state's Climate-Change Contributions rank of eighth demonstrates how low energy and fuel use translates into tangible reductions across greenhouse gas categories.
New York's Eco-Friendly Behaviors rank of ninth rounds out a profile with few weak points. Across the three dimensions WalletHub measured — environmental quality, behavioral metrics, and emissions contributions — New York sits in the top 10 in two of three categories. Its total score of 72.45 falls just 0.22 points behind California, and the gap between New York and Washington at fifth place narrows to 0.19 points. The state's performance reflects the environmental dividend of density. Millions of people sharing infrastructure drive the per-capita burden on land, energy, and fuel down in ways that individual households in low-density states cannot replicate.

Alan Majchrowicz / Getty Images
Washington finished fifth with a score of 72.26, tied for the top national rank on renewable energy consumption share. The state shares that distinction with South Dakota, Iowa, Maine, and Oregon, but Washington's fourth-place position in Eco-Friendly Behaviors reflects strength across a wider range of green practices, not just energy sourcing.
Washington's electricity grid draws a substantial portion of its supply from renewable sources, keeping emissions per unit of energy produced low. Washington also ranks fifth nationally for LEED-certified buildings per capita, indicating its commitment to environmental standards extends into commercial development.
Washington's Environmental Quality rank of 12th is the lowest among the top five states, suggesting that air, water, and soil conditions — while solid — do not match the environmental quality leaders at the top of the table. Its Eco-Friendly Behaviors score, however, places it ahead of every state in the top five except New York in that dimension. A total score of 72.26 keeps Washington in the top tier, less than 0.8 points behind New York and less than a single point behind California. The margin underscores how tightly grouped the leading states are across the full range of metrics.
