Nine charts unearthed from the depths of the jobs report
The data on the US job market in September, delayed by this month’s government shutdown, sizzled across the wires this morning. You can read plenty about it here, here and here. Or you can just look at these pretty pictures. It’s up to you.


The data on the US job market in September, delayed by this month’s government shutdown, sizzled across the wires this morning. You can read plenty about it here, here and here. Or you can just look at these pretty pictures. It’s up to you.
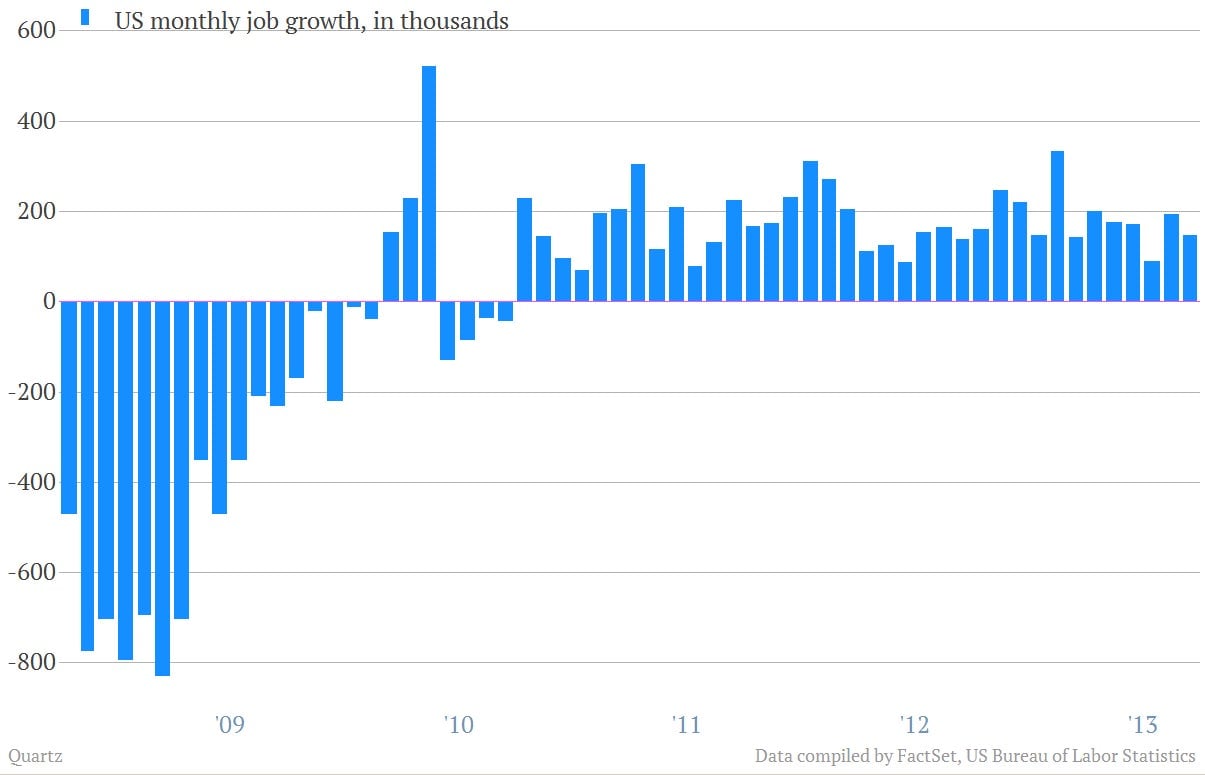
The US economy churned out 148,000 new jobs in September
That was under expectations for about 180,000 new jobs. But the government also revised its numbers for July and August, delivering a cumulative increase of 9,000. Still over the last three months, job growth has averaged a less than stellar 143,000 new jobs per month. That’s down from an average of 195,000 for the first six months of 2013, according to JP Morgan economists.
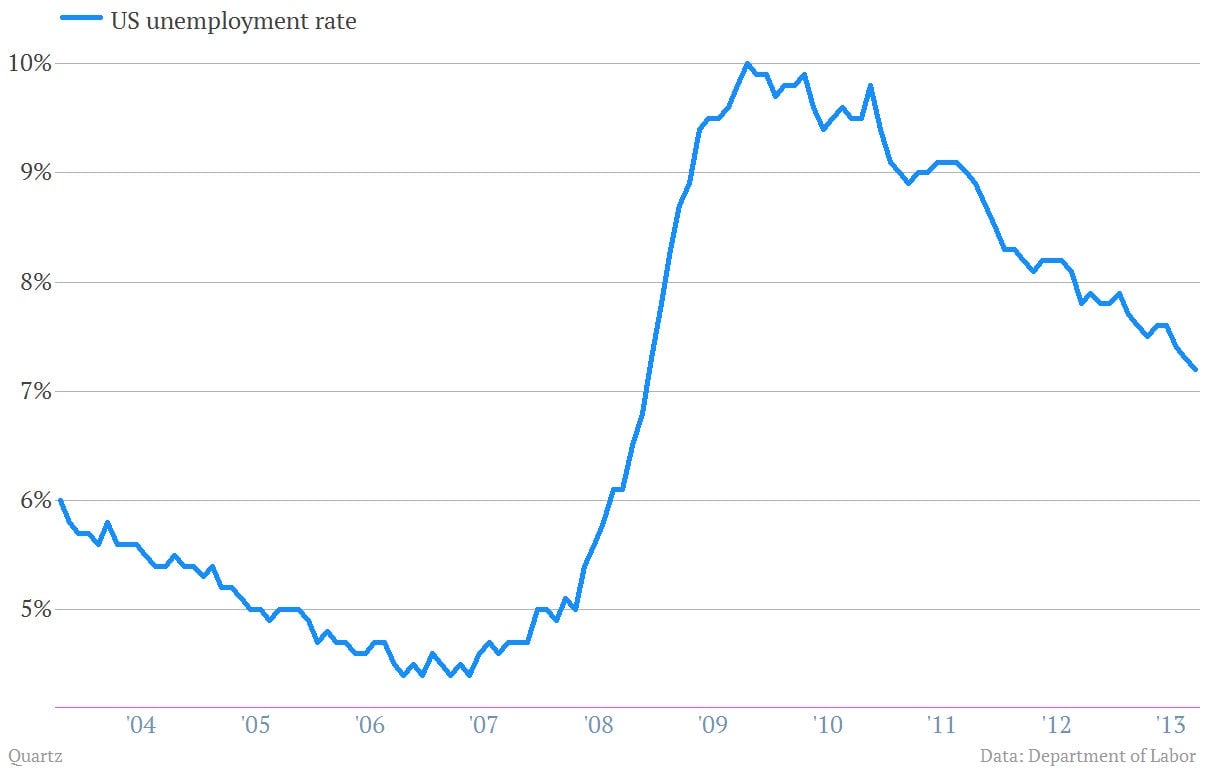
The unemployment rate continues to come down slowly
It fell to 7.2% in September, from 7.3% in August. But on an unrounded basis, the improvement is even less impressive, as the full September number was 7.235%.
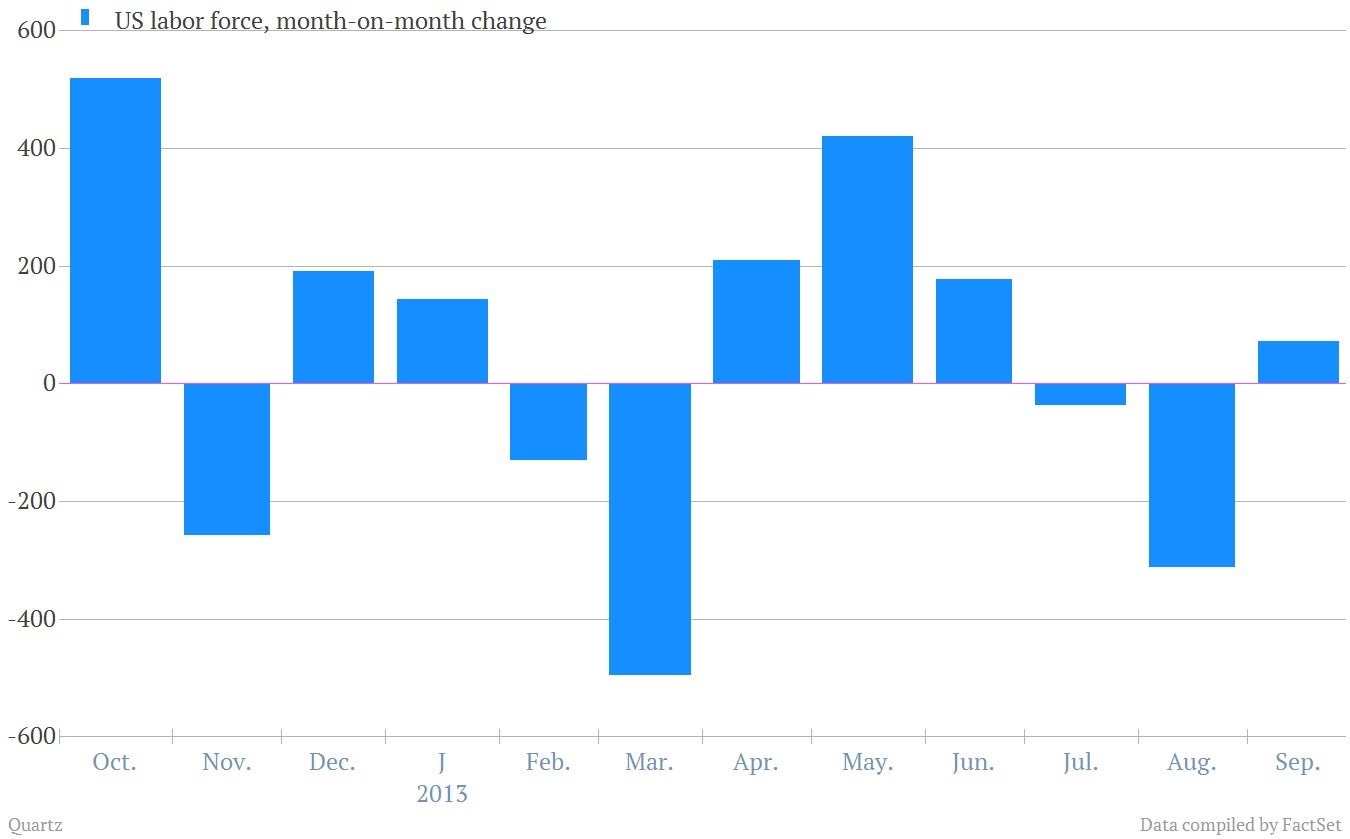
And the unemployment rate fell for the right reasons
The labor market actually grew a bit in September, increasing by 73,000. The increase of 133,000 in employment outpaced the growth in the labor market, hence the decline in the jobless rate.
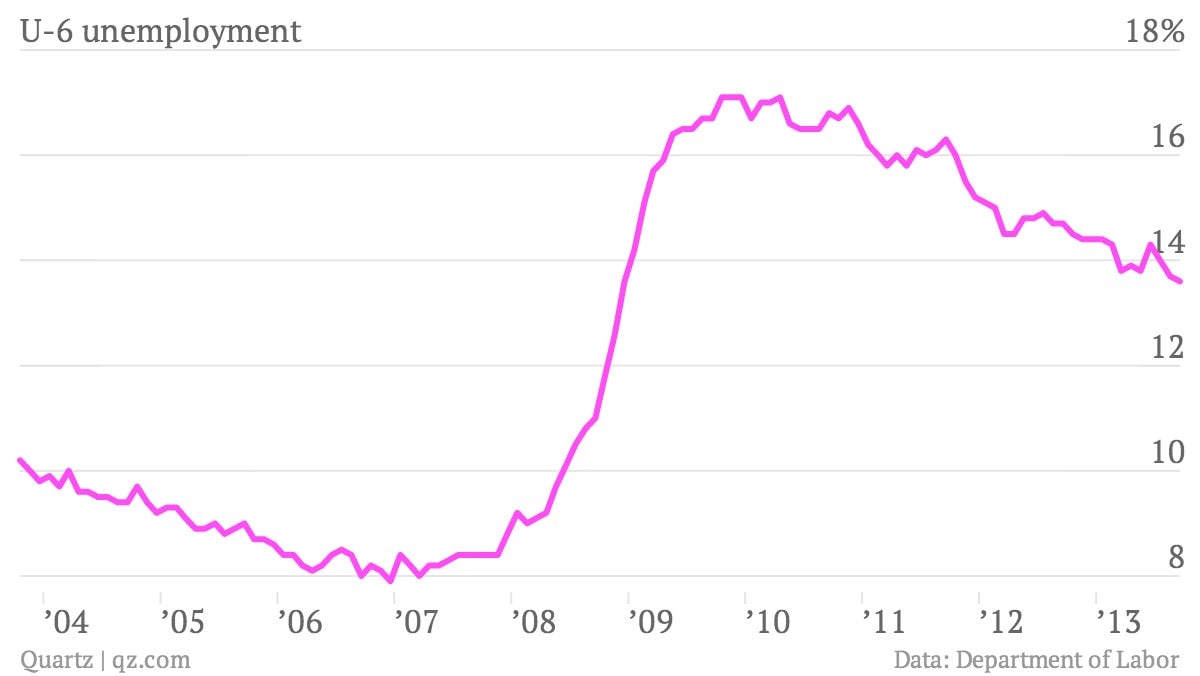
The broadest measure of unemployment, the so-called U-6, also declined slightly
It dropped from 13.7% to 13.6%. The U-6 includes workers who can only find part-time work and those who have given up looking for work altogether. So it’s good to see it falling, but obviously it remains quite elevated.
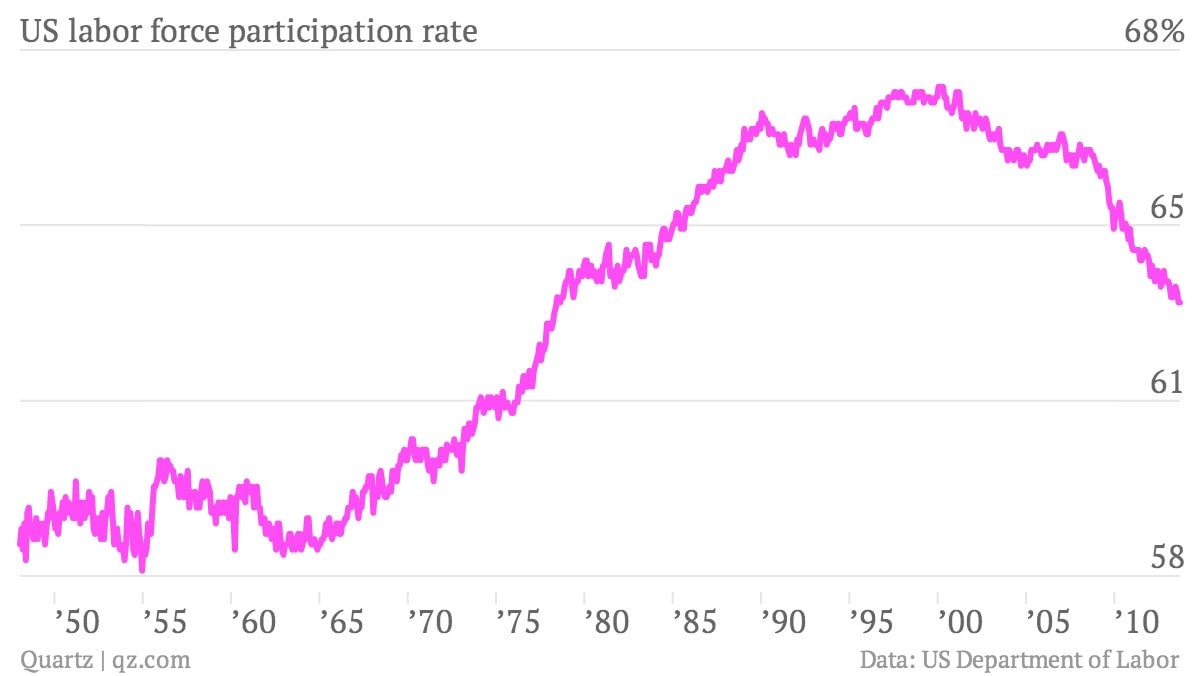
Labor-force participation held steady at a generational low of 63.2%
The decline in workforce participation has been a source of debate. In part it’s just due to demographics—the baby-boom generation is aging out of the workforce. But it also has to do with the lame US recovery.
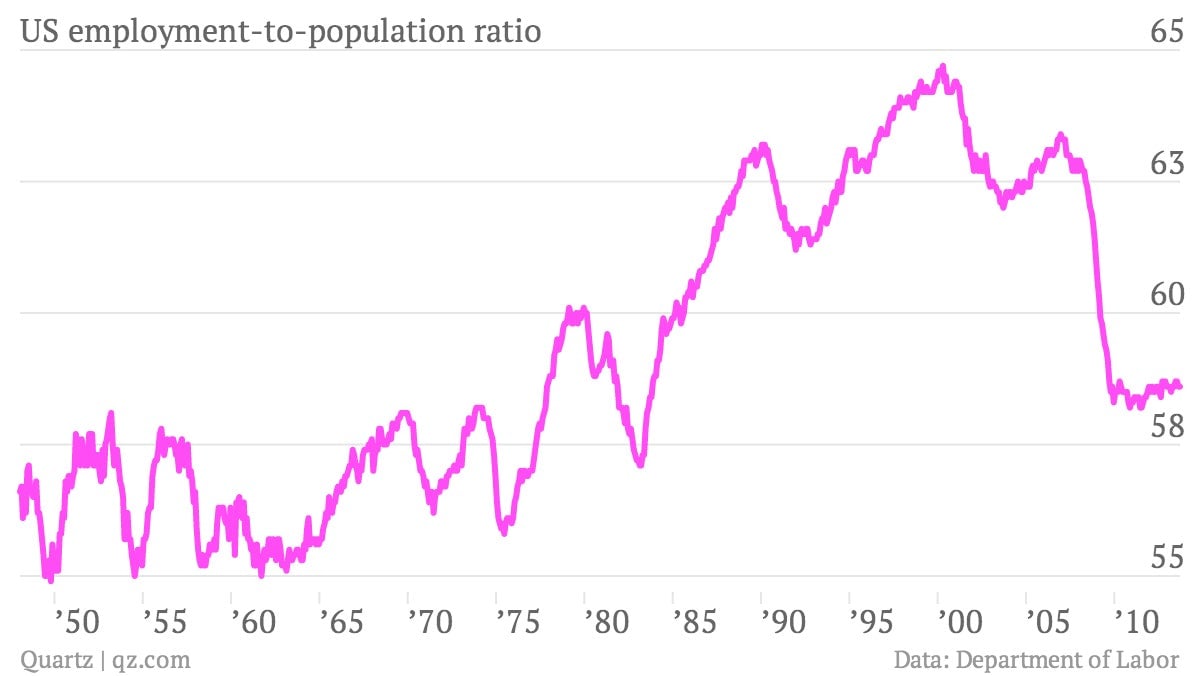
The employment-to-population ratio remains remarkably low
This number tells you plain-and-simple the percentage of US adults that have jobs. (It avoids any of the quibbling over whether you’re actively looking for a job, and hence part of the labor force.) The overall employment-population ratio remains really low at 58.6%. Again, this is partly a matter of demographics, but it tumbled sharply in the wake of the crisis and hasn’t gained back much ground. Here’s a look at the number going back to 1948.
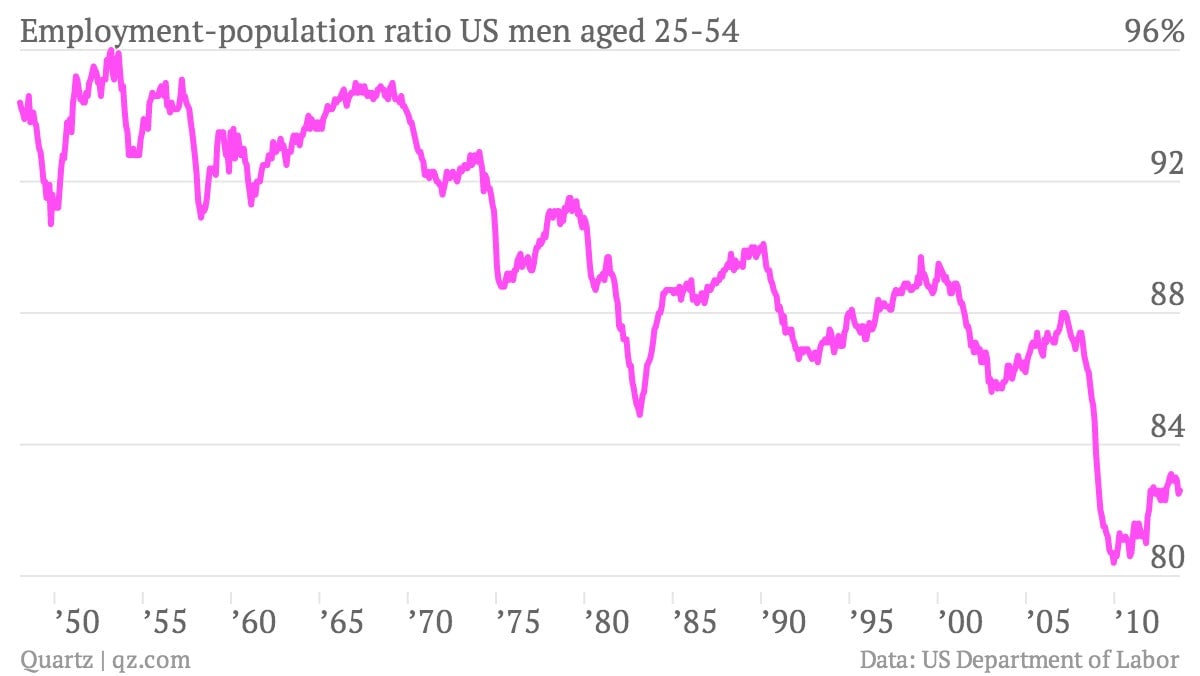
How to filter out the demographic factors
So how can you tell what’s an economic effect on the jobs numbers, and what’s a demographic effect? One way to try to sidestep the wave of retiring baby-boomers who can skew the data is to look at the employment-to-population ratio for just for working-age men, specifically those aged 25-54. And you can see it suffered a similar collapse during the recession, and seems to be clawing its way back, albeit slowly.
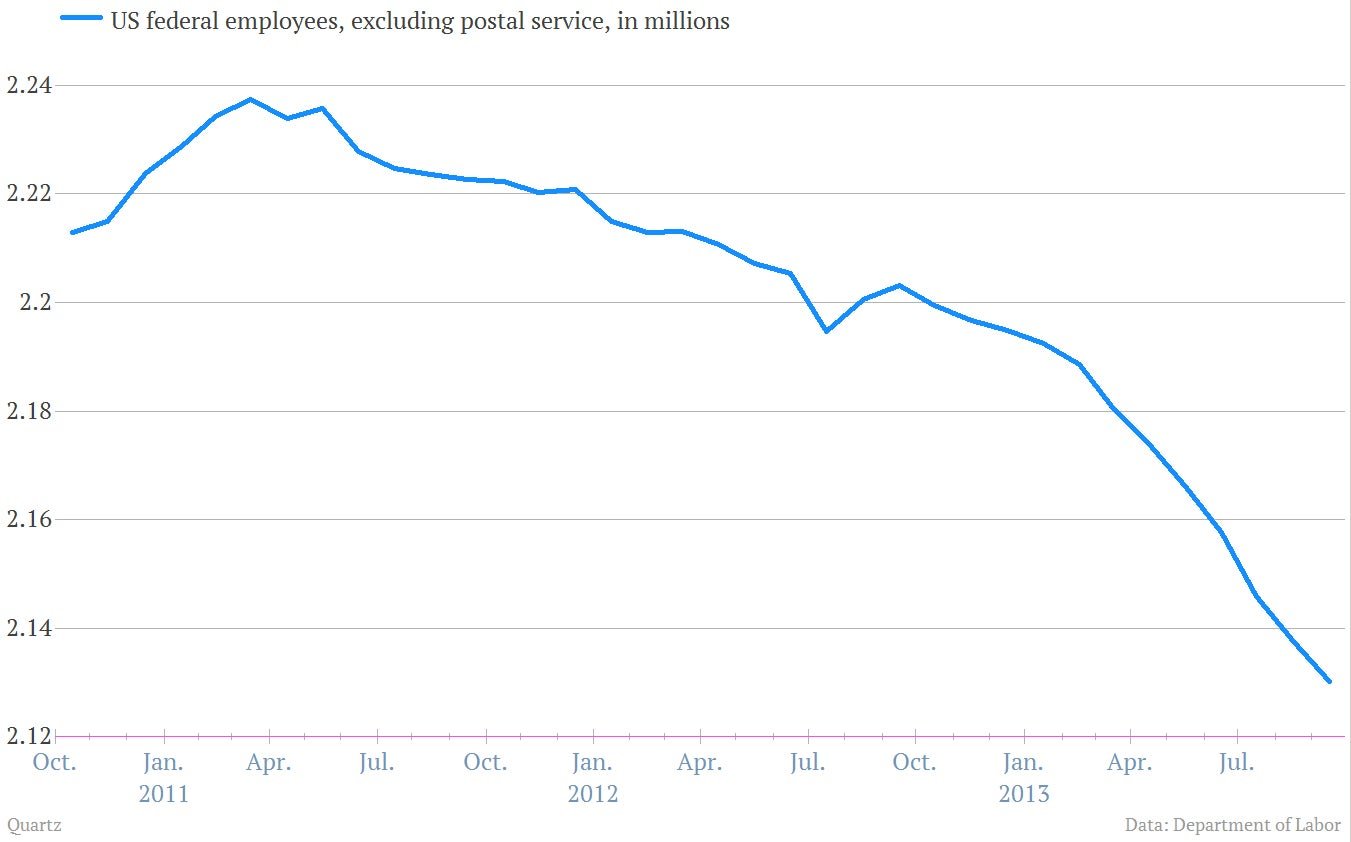
Falling federal employment continues to be a drag on overall job growth
Federal employment, excluding the post office, fell 7,300 in September. But back-to-school dynamics boosted state and local employment by 28,000 during the month.
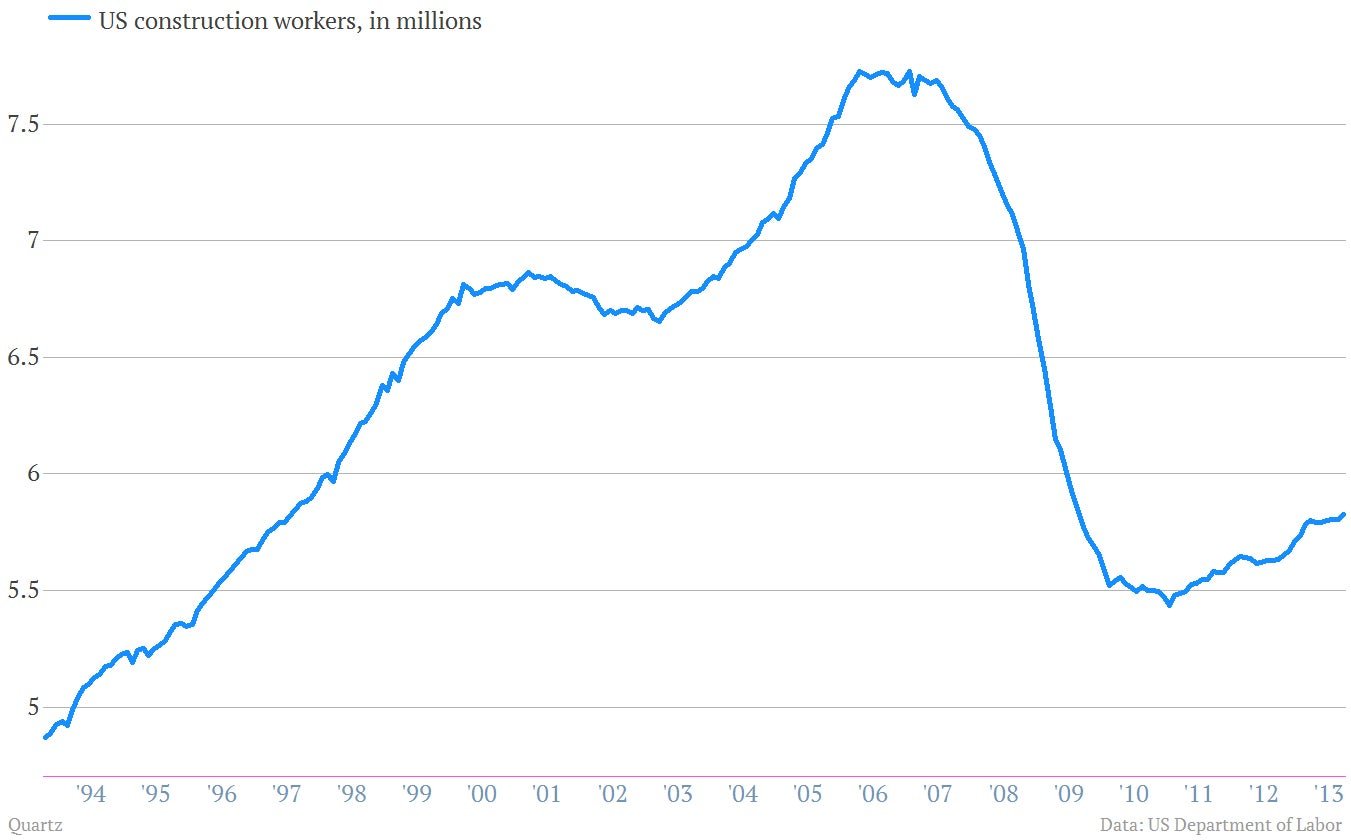
Construction saw a bump
There was a nice 20,000-job increase in construction employment in September. That’s good to hear. But let’s put it in perspective. With 5.83 million employees, the US construction industry—which was at the heart of the the Great Recession—is now only back to 1997 employment levels.
For more on other industries that had a decent September, you should check out some of Quartz’s other graphical looks today’s numbers, here.