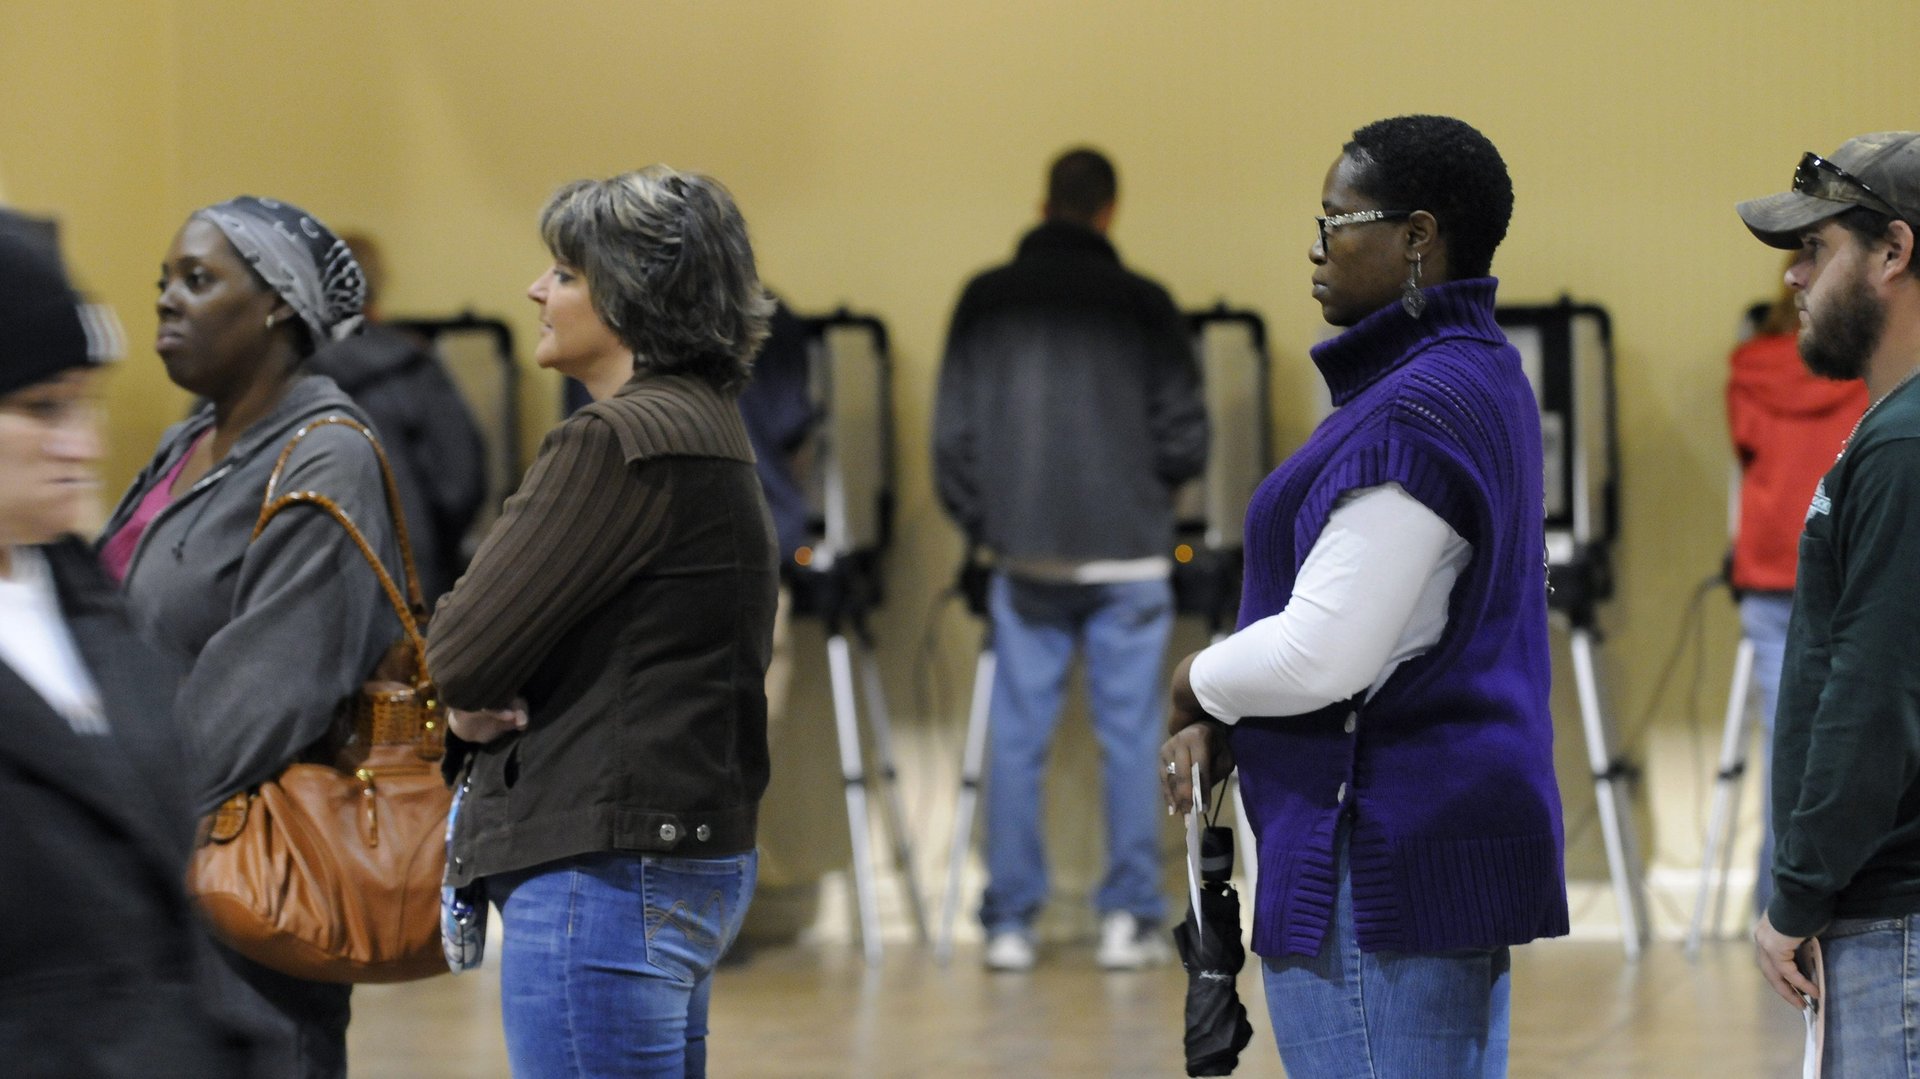
Smartphone data shows black Americans wait longer to vote
During the 2016 US presidential election, the average voter spent 19 minutes at their polling station. According to to recently released study, black Americans tended to wait quite a bit longer. The study’s authors find that neighborhoods that are almost entirely made up of black citizens have wait times that are, on average, five minutes greater than entirely white ones. There is also more than a 70% increase in the chance that people in these black neighborhoods would have to wait more than 30 minutes to vote.


During the 2016 US presidential election, the average voter spent 19 minutes at their polling station. According to to recently released study, black Americans tended to wait quite a bit longer. The study’s authors find that neighborhoods that are almost entirely made up of black citizens have wait times that are, on average, five minutes greater than entirely white ones. There is also more than a 70% increase in the chance that people in these black neighborhoods would have to wait more than 30 minutes to vote.
Although previous studies have also found racial disparities in wait times, this study is notable for its use of cell phone data. Earlier research relied on responses to surveys in which people are asked how long they waited to vote. These data were suspect because a much larger share of respondents say they vote, 80% of them, than the 50% who actually do.
This study, conducted by researchers at the University of California Los Angeles, Carnegie Mellon University, and the University of Chicago, avoids this issue by examining anonymized cellphone location data provided by the firm SafeGraph. SafeGraph aggregates data from various apps to which users share their location, giving the researchers granular, time-based location data for 10 million US smartphones. Cellphone data offer a new, and more precise way of tracking wait times that is relatively simple to collect. The researchers made sure people were actually waiting to vote by excluding people who were near the polling station in the month before and after election day, and by checking that it strongly correlated to survey data.
Along with the cellphone data, the researchers collected data on the racial and economic characteristics for 80% of the polling stations in the US. Using this information, they not only established that black neighborhoods faced longer wait times across the US, but that this was also true inside states and counties. So it’s not just that Georgia, a state with a large black population, has longer wait times than Minnesota, a state with a small black population, but that even within states like Georgia, black neighborhoods are face longer wait times. Voters in Hispanic neighborhoods also had longer wait times, but the difference is not as large. The researchers found no difference for Asian neighborhoods. Although the number of all Native American voting places was relatively small, the authors note that polling places on Native American reservations had among the longest wait times.
The researchers also examined possible explanations for this disparity. Perhaps, they thought, the differing waiting times were caused by black areas being lower income, more Democratic, or because black voters were more likely to show up at different times because of their work schedules. None of these factors explained the difference.
The analysis does show that the difference between black and white waiting times is greatest at polling places with the most voters. So for example, polling stations with nearly all-black or all-white populations and only 1,000 registered voters have more similar wait times than polling places with 10,000 voters. Keith Chen, an economist and one of the authors of the study, told Quartz that this may indicate that as white polling places get more congested they are given more resources, while the same does not happen at black polling places.
Long lines almost certainly discourage future voting. The political scientist Stephen Pettigrew found that 200,000 fewer people voted in 2014 because of the long waiting times they experienced in 2012. Assuming this impacts black voters similarly to others, wait times would have the effect of disproportionately decreasing the black vote.