Rt: The number that can guide how societies ease coronavirus lockdowns
Anyone who has followed the coronavirus pandemic over the past several months will probably be familiar with “R0.”


Anyone who has followed the coronavirus pandemic over the past several months will probably be familiar with “R0.”
Pronounced R-naught and known also as the basic reproductive number, it refers to how many other people will catch the disease from a single infected person, in a population that hasn’t been exposed to the disease before. If R0 is below one, the epidemic eventually peters out. Above one, it will grow, possibly exponentially.
Early on in the Covid-19 outbreak, different teams of researchers came up with varying estimates of R0, with most ranging between two and three. Some put the number lower, like the World Health Organization’s estimates of 1.4 to 2.5. But R0 is not set in stone. It is an average, and can also vary from place to place. As science journalist Ed Yong put it in the Atlantic, R0 “is a measure of a disease’s potential,” and once response measures are put in place—screening and quarantines, for example—the actual transmission rate can be lowered. The actual or “effective” version of the reproductive number, as opposed to the basic version, is known as Rt—that is, the virus’s actual transmission rate at a given time, t.
“In Wuhan, Rt was probably two-point-x in December, two-point-x in January, until about January 23,” when the city of 11 million residents was put under lockdown, said Ben Cowling, division head of epidemiology and biostatistics at the University of Hong Kong (HKU). “And at that point, most likely the effective R dropped pretty substantially to 0.3, and then stayed at a low level almost until now.” As Wuhan’s lockdown was lifted today, the question will be whether China can avoid a second wave of infections.

Around the world, some countries are now cautiously broaching the question of how to slowly ease the lockdowns and begin re-opening their societies. Austria and Denmark will begin lifting restrictions in stages, starting with opening small shops and nurseries and primary schools next week, even while the European Commission was forced to drop its plan to present a roadmap today for ending lockdowns over fears that it would send a dangerous signal.
Meanwhile, places like Singapore and Hong Kong—which earlier did not institute restrictive measures because infections were successfully kept under control—have had to step up social distancing measures in recent days due to a rise in both imported and locally transmitted cases. This delicate dance—easing measures bit by bit, but not too much or too early—will be a major challenge in the months to come.
This is where the Rt can help. By showing how SARS-CoV-2, the virus that causes Covid-19, is spreading in a particularly population in real time, Rt gives policy makers an up-do-date snapshot of the current epidemic situation. As Gabriel Leung, an epidemiologist and dean of medicine at HKU, noted in a recent op-ed in the New York Times, the Rt helps decision makers “more precisely adjust their interventions to keep that number at what is, for them and their constituencies, an acceptable level.”
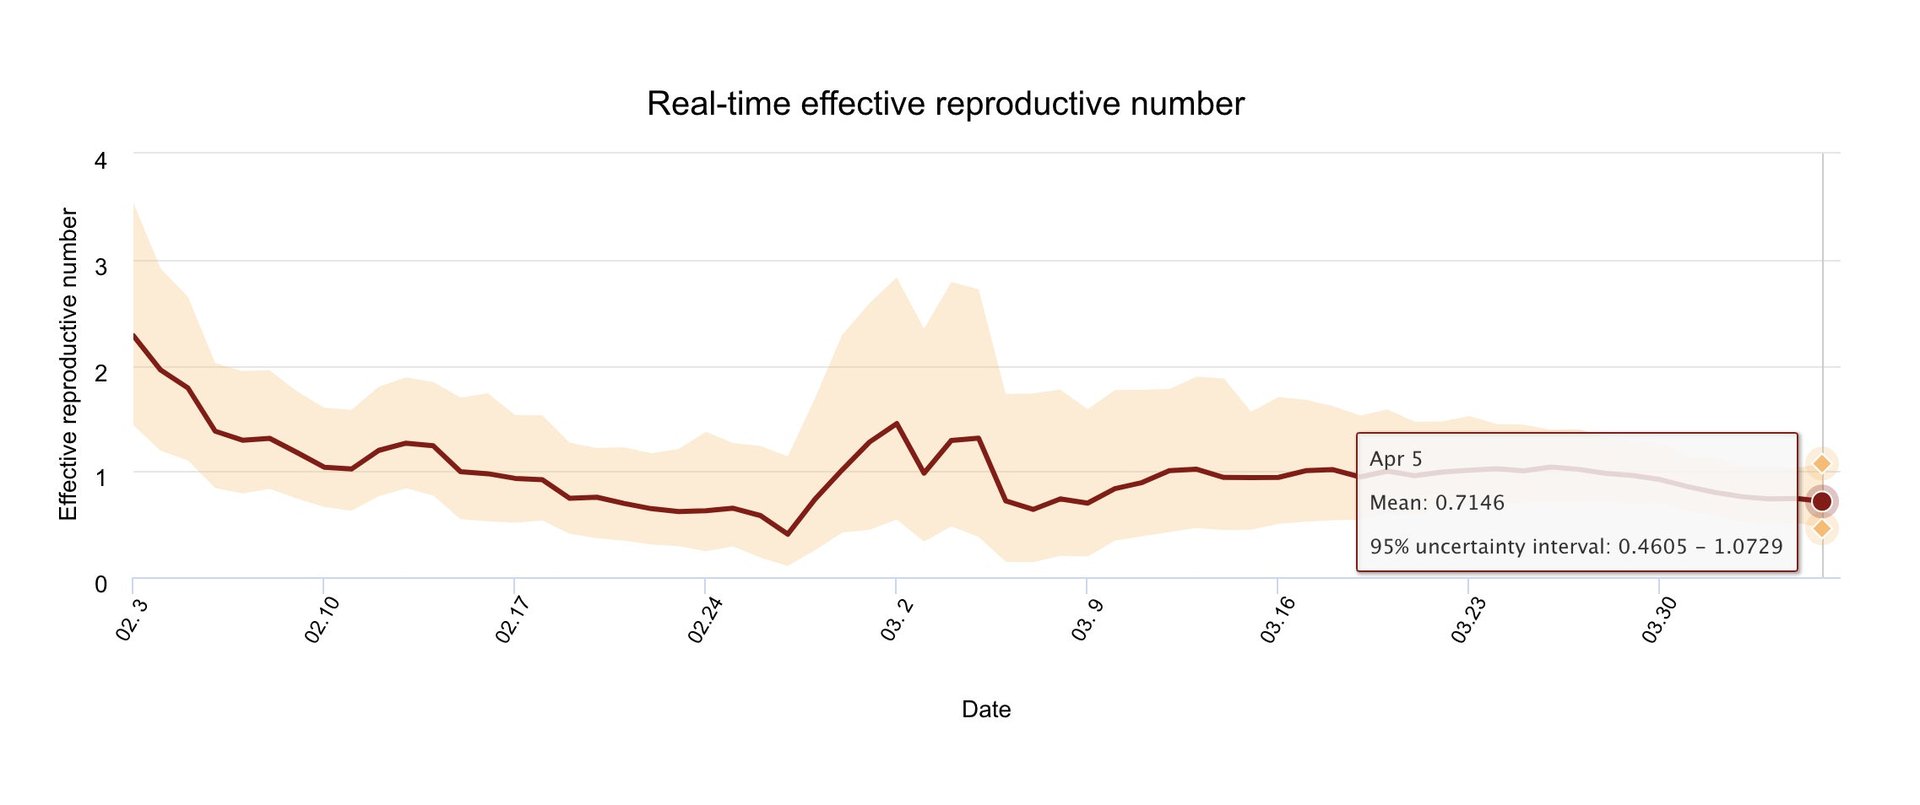
HKU’s school of public health has been estimating the real-time Rt in Hong Kong since early February and publishing it in an interactive chart. It shows an estimated Rt of nearly 2.3 on Feb. 3, falling steadily to 0.4 by Feb. 27 as Hong Kongers launched into a hygiene hyperdrive—so much so that the city saw a sharp corresponding drop in flu cases—before creeping back up above one in March as people appeared to let down their guards, and as a flood of imported cases portended a second wave of infections. The latest available Rt, on Apr. 5, is a smudge above 0.7.
Keeping Hong Kong’s Rt below one will depend on a number of factors, including what social distancing measures are put in place. “And the measures can be tuned, so if R goes a long way below one we can actually relax some of the measures,” said Cowling. But “if there’s too much relaxation the R number will go above one and we’ll see a slow spread of infections and that’s not ideal, so we’ll have to tighten the measures again.” This approach of relaxing and tightening measures based on the real-time Rt is similar to the “adaptive triggering” (pdf) strategy proposed by researchers at Imperial College London, with suppression measures switched on and off depending on whether cases rise or fall.
Still, even the real-time Rt will inevitably lag behind the actual spread of the virus, in large part because of limited testing capacity and also Covid-19’s average incubation period of about six days, when someone is infected but still asymptomatic. To enhance the estimates and minimize the lag as much as possible, researchers can draw on digital tools like phone location services and online payment data. Researchers at HKU, for example, are working with location-based data from Octopus cards, a re-chargeable payment card that is widely used for public transport and shopping in the city.
Until a vaccine is developed for Covid-19, and absent an indefinite lockdown at high socioeconomic cost, it may be very difficult for any society to get Rt down to 0. But that might not be necessary. “There’s no need to get the infections to get down to zero, because even if you get down to zero” there will invariably be new imported cases, said Cowling. What’s needed is a careful calibration of measures, and the Rt provides the roadmap for just that.