The most important charts from May’s really good jobs report
The US jobs engine really seems to be running pretty well at the moment. The just-released update on employment showed the US economy produced 217,000 new jobs in May, with unemployment standing pat at 6.3%. May’s report makes it four straight months in which the US economy produced 200,000 jobs or more. That hasn’t happened since the economic boom of the late 1990s, when the country strung together five straight 200,000-plus months between September 1999 and January 2000.
ByMatt Phillips and Matt Phillips

The US jobs engine really seems to be running pretty well at the moment. The just-released update on employment showed the US economy produced 217,000 new jobs in May, with unemployment standing pat at 6.3%. May’s report makes it four straight months in which the US economy produced 200,000 jobs or more. That hasn’t happened since the economic boom of the late 1990s, when the country strung together five straight 200,000-plus months between September 1999 and January 2000.
Here are some of the most telling charts from the May update.
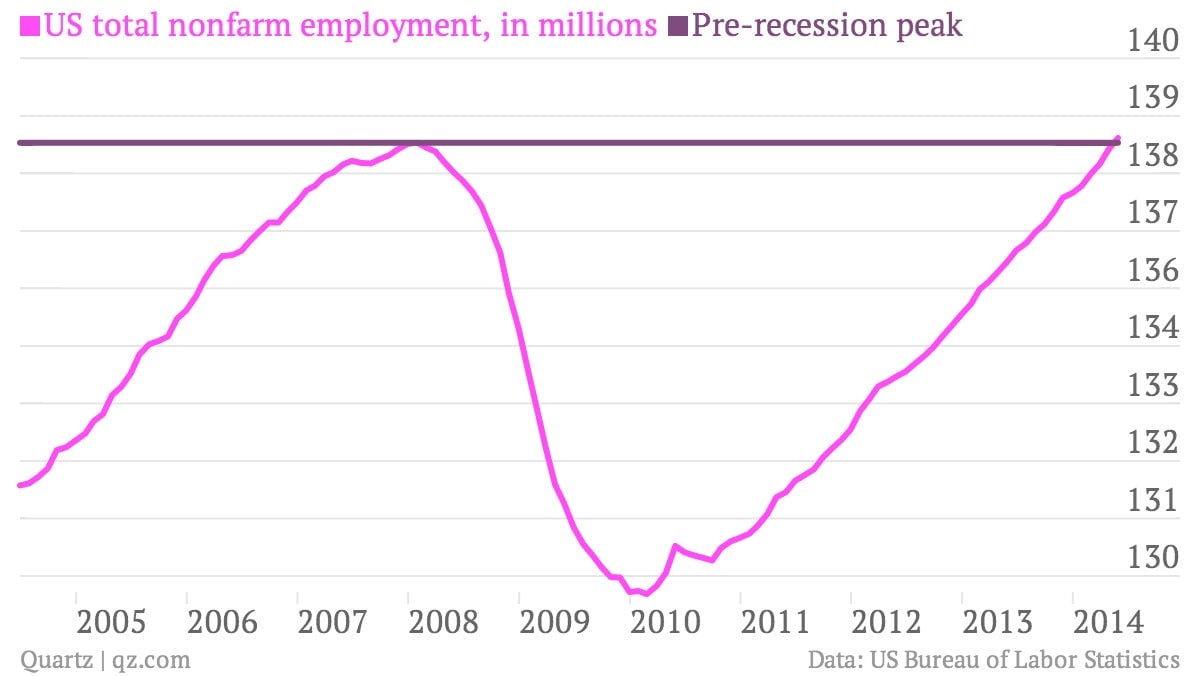
A long road back
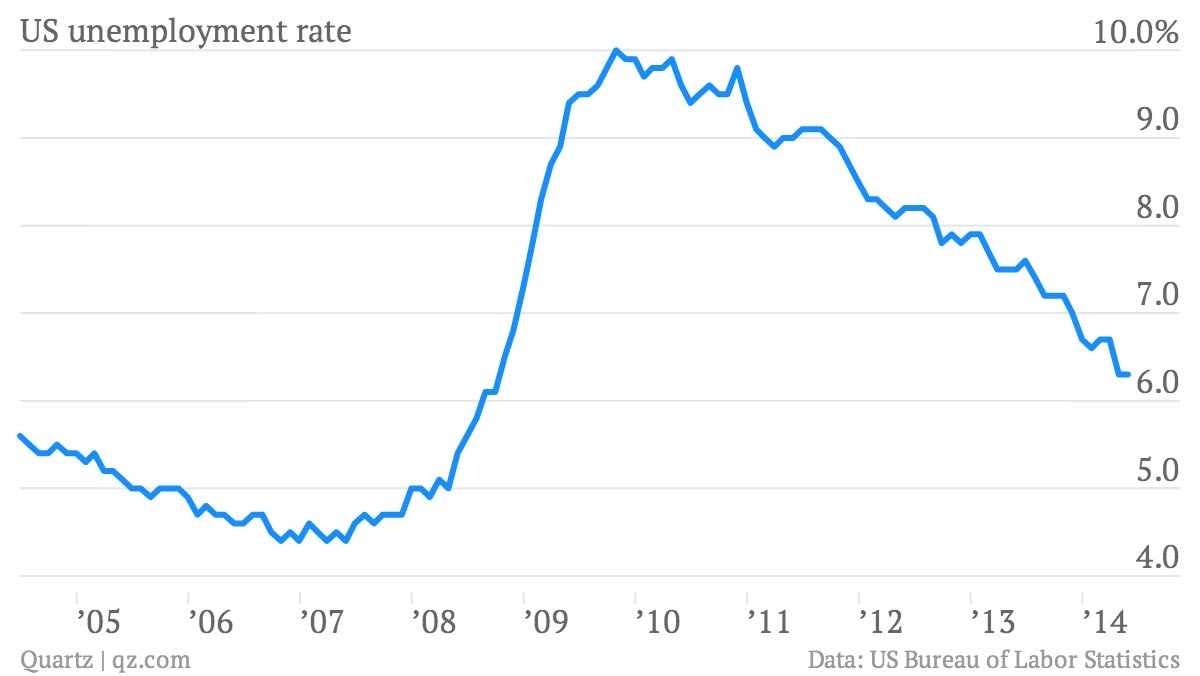
The unemployment rate held steady at 6.3%.
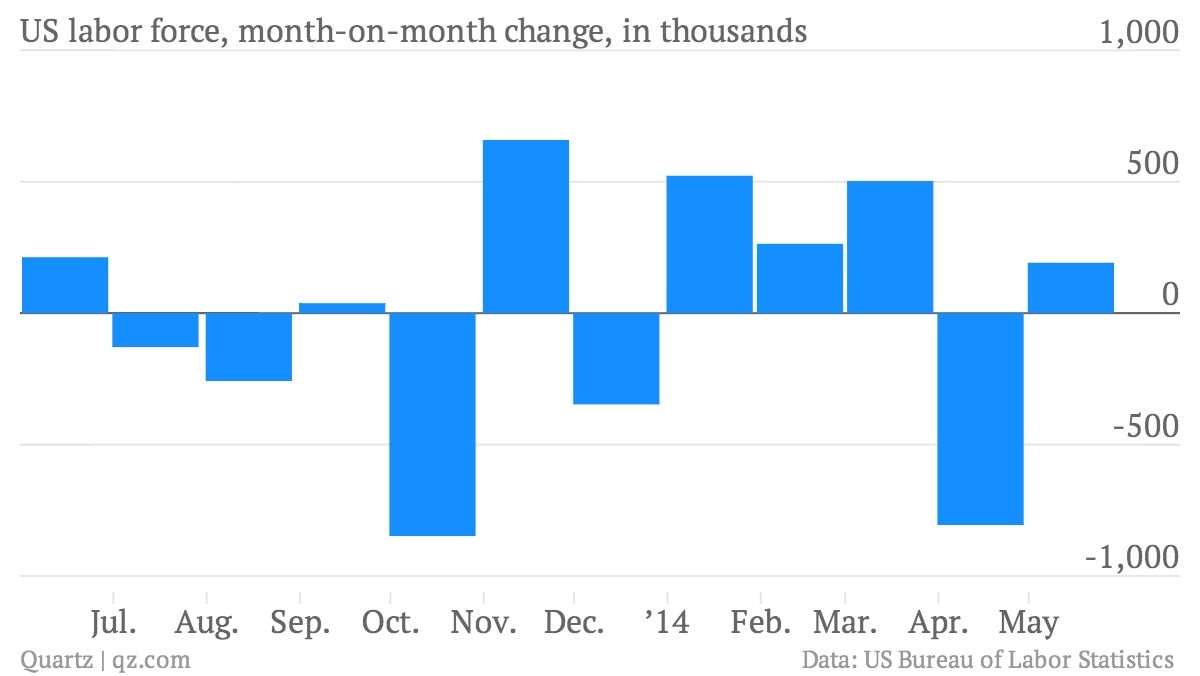
…Even as the labor force grew by 192,000
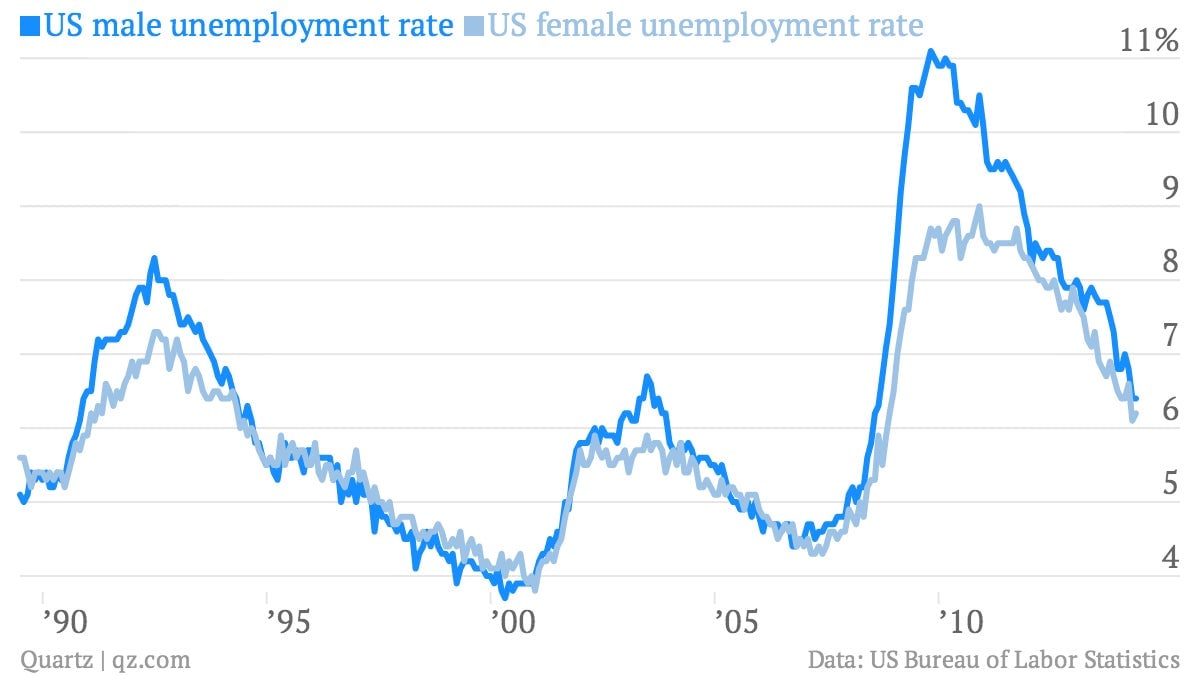
And unemployment rate for men, which has lagged, is improving faster too
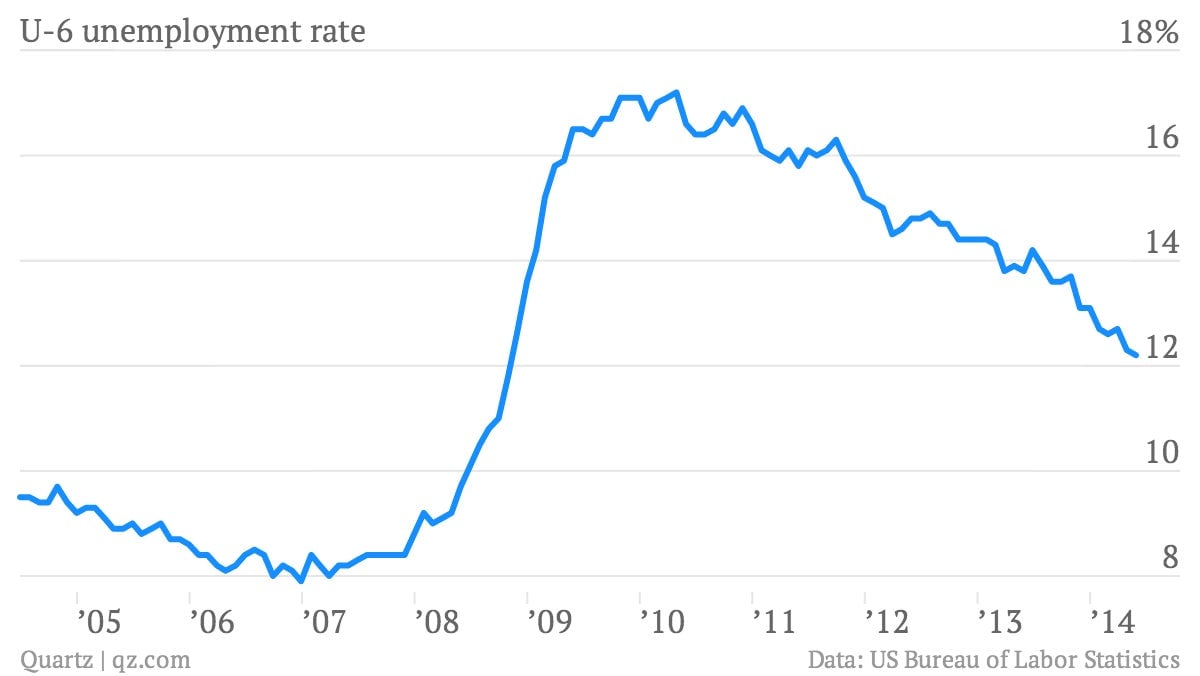
The broader U-6 gauge of unemployment was down to 12.2%, lowest since October 2008
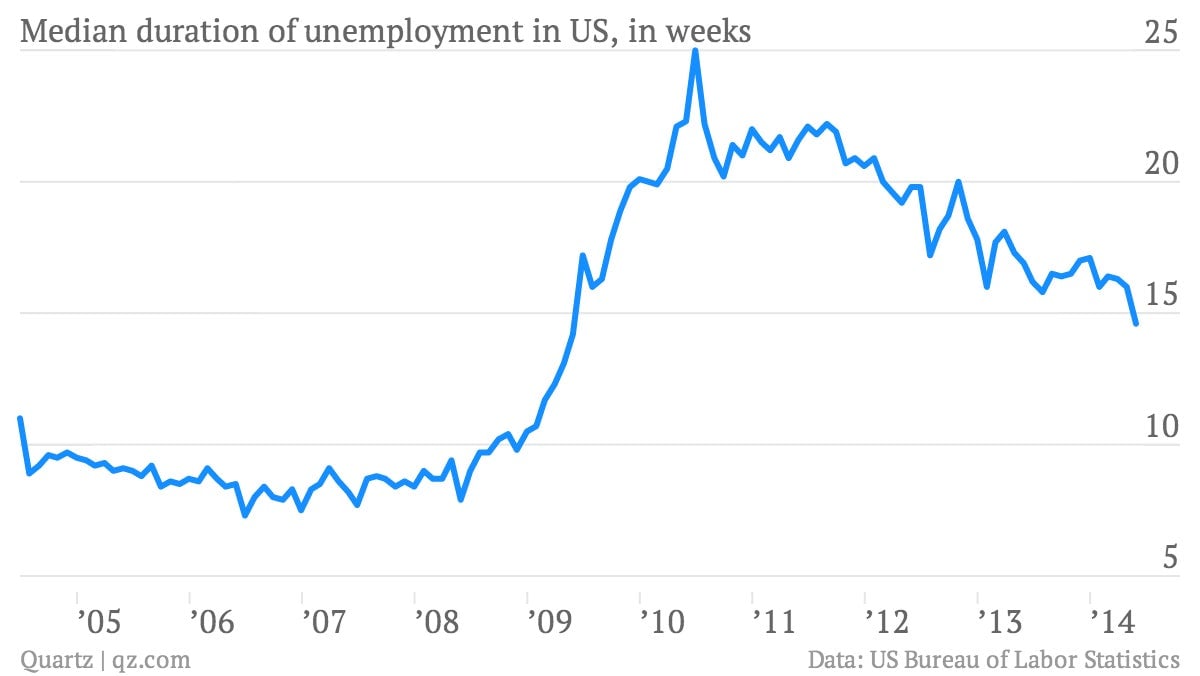
Unemployment spells are getting shorter
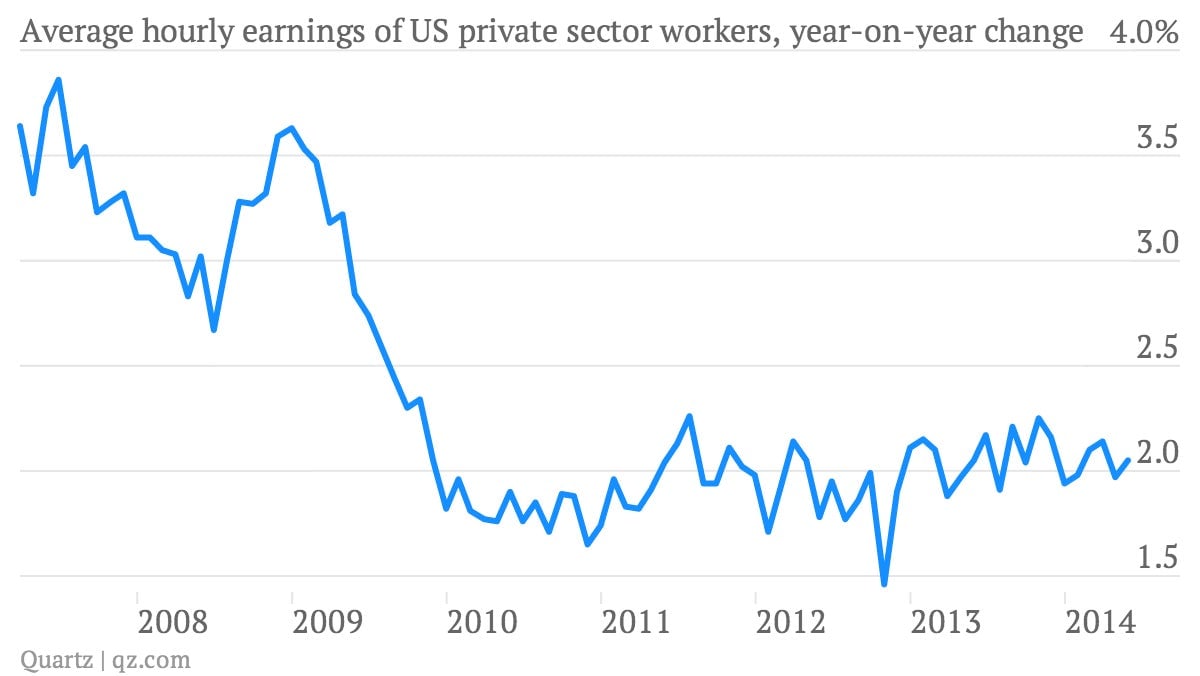
Wage growth isn’t great
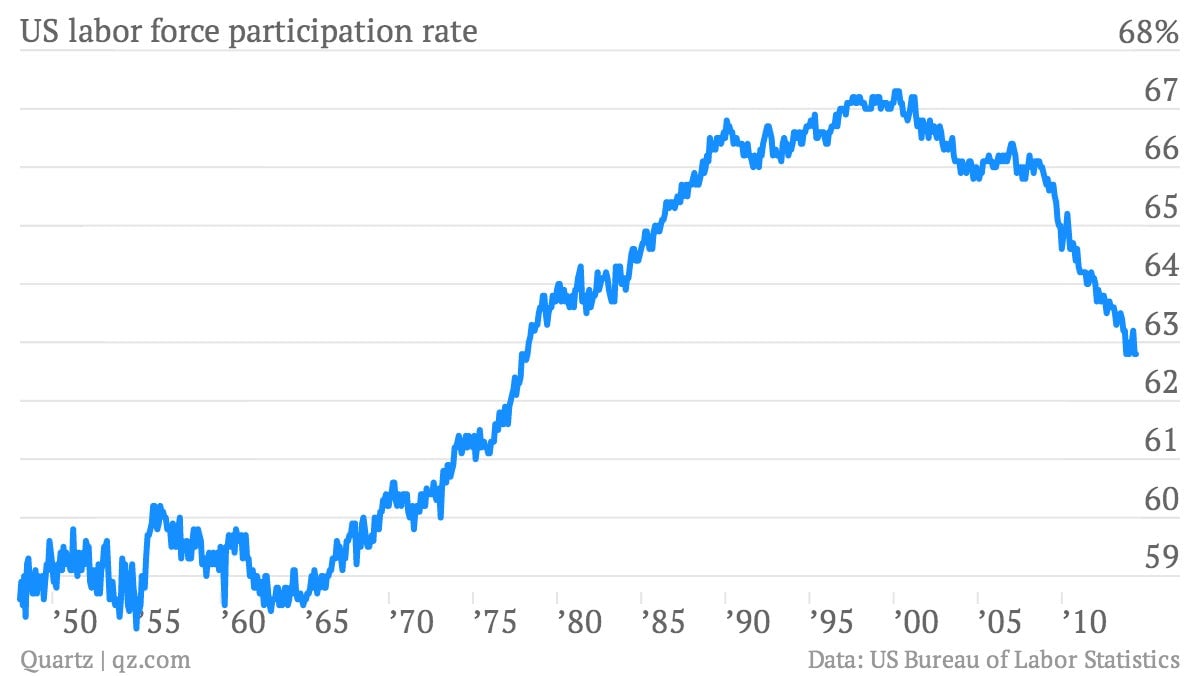
Labor force participation remains low, reflecting the tough job market and an aging population
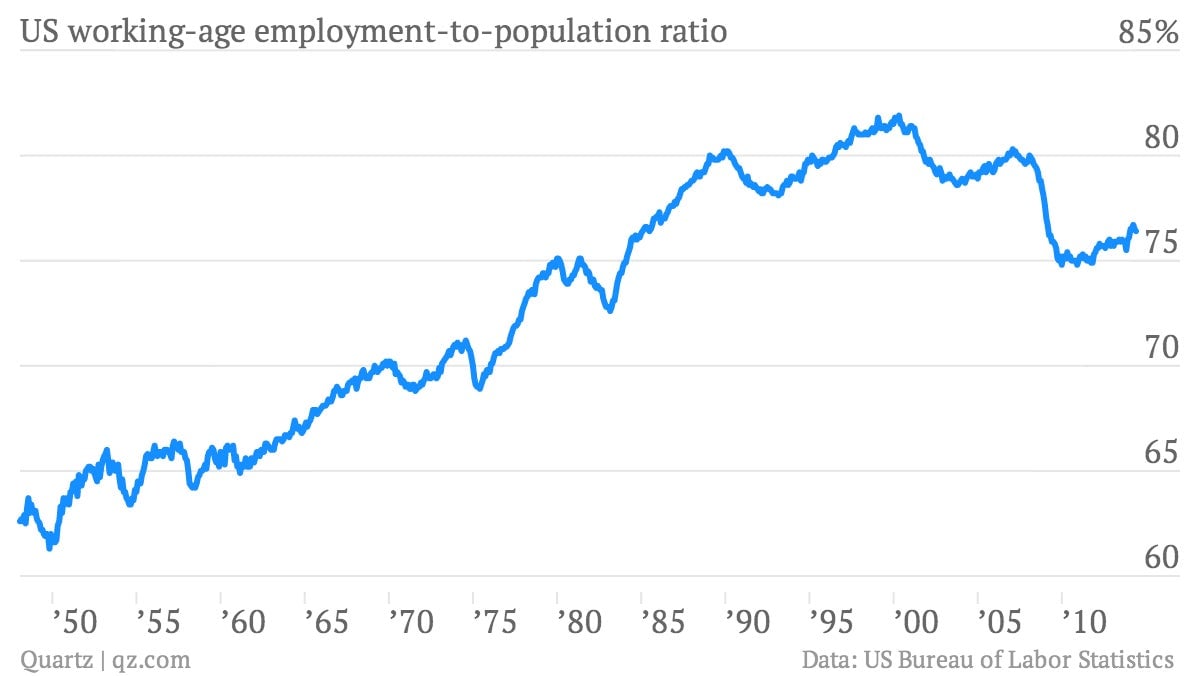
But even in the working-age population, the share of those with jobs is low, by recent historical standards
