Painfully, American families are learning the difference between median and mean
Warren Buffett walks into a skid row bar. Inside, nine men silently slump on their stools.

Warren Buffett walks into a skid row bar. Inside, nine men silently slump on their stools.
None of them has a job. Individually, they own almost nothing. No house. No stocks. No bonds.
But miraculously, when Buffett steps into the saloon—he orders only a Cherry Coke, mind you—the mean net worth of everyone in that bar surges to roughly $6.8 billion. (Buffett is worth roughly $68 billion.)
Such is the power of large outliers to skew averages.
As American inequality grows more pronounced—with greater shares of income and wealth accruing to those at the top of the income distribution—the difference between mean and median is becoming more and more important for Americans to understand.
Thursday’s release of the Federal Reserve’s triennial survey of consumer finances makes that point pretty clear. The report, one of the most in-depth efforts to understand the financial dynamics of American households, brings us up to speed on how households have fared since 2010, the last time the data was assembled.
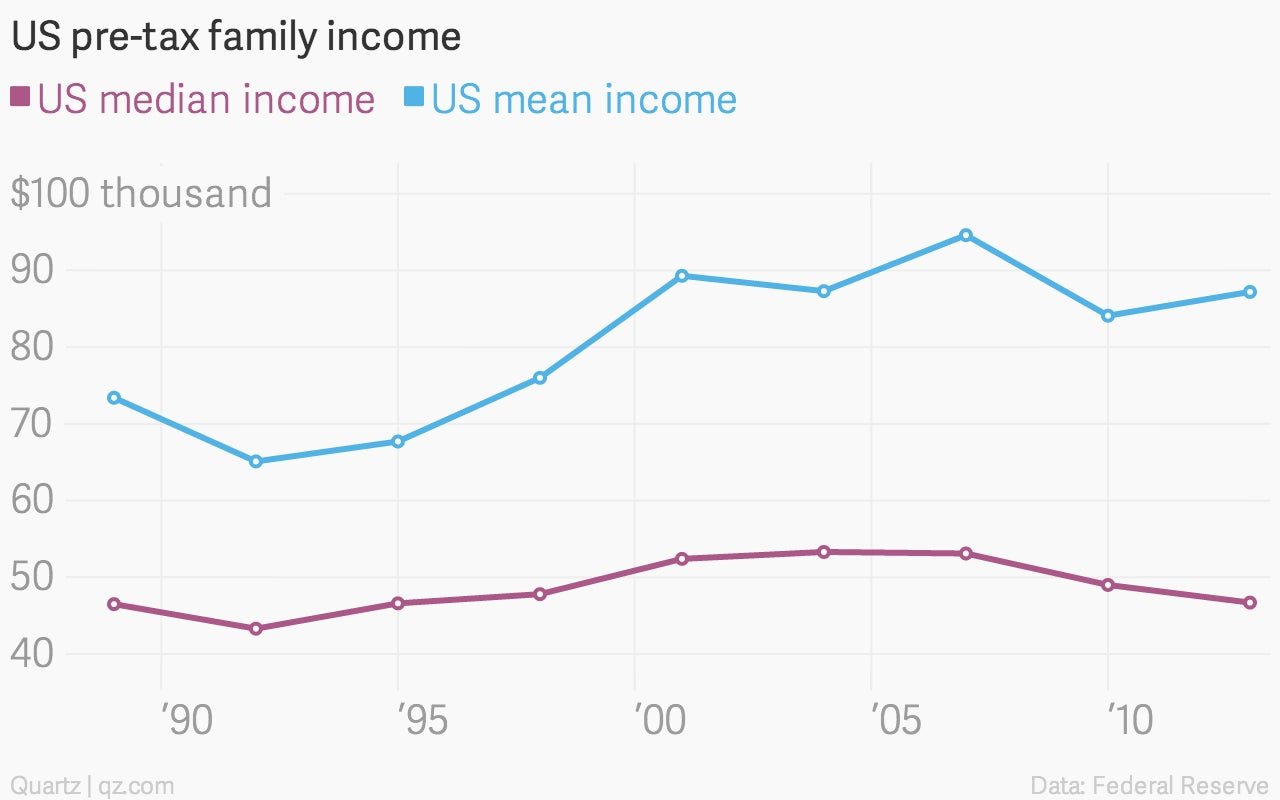
On average, it looks like American households are recovering pretty well since the worst of the Great Recession. Overall average family income rose 4% between 2010 and 2013, the Fed reported. But that average masks a tougher truth: Much of the improvement over the last few years has been driven by surging incomes at the very top of the distribution structure. People of more modest means generally saw their paychecks stagnate. The poorest continued to fall behind.
That’s why, despite the fact that mean income rose 4% to $87,200 per family, median income actually fell by 5% to $46,700 between 2010 and 2013. The mean was driven by the fact that the highest percentile of the income distribution saw their income surge by 10% to $397,500 between 2010 and 2013.

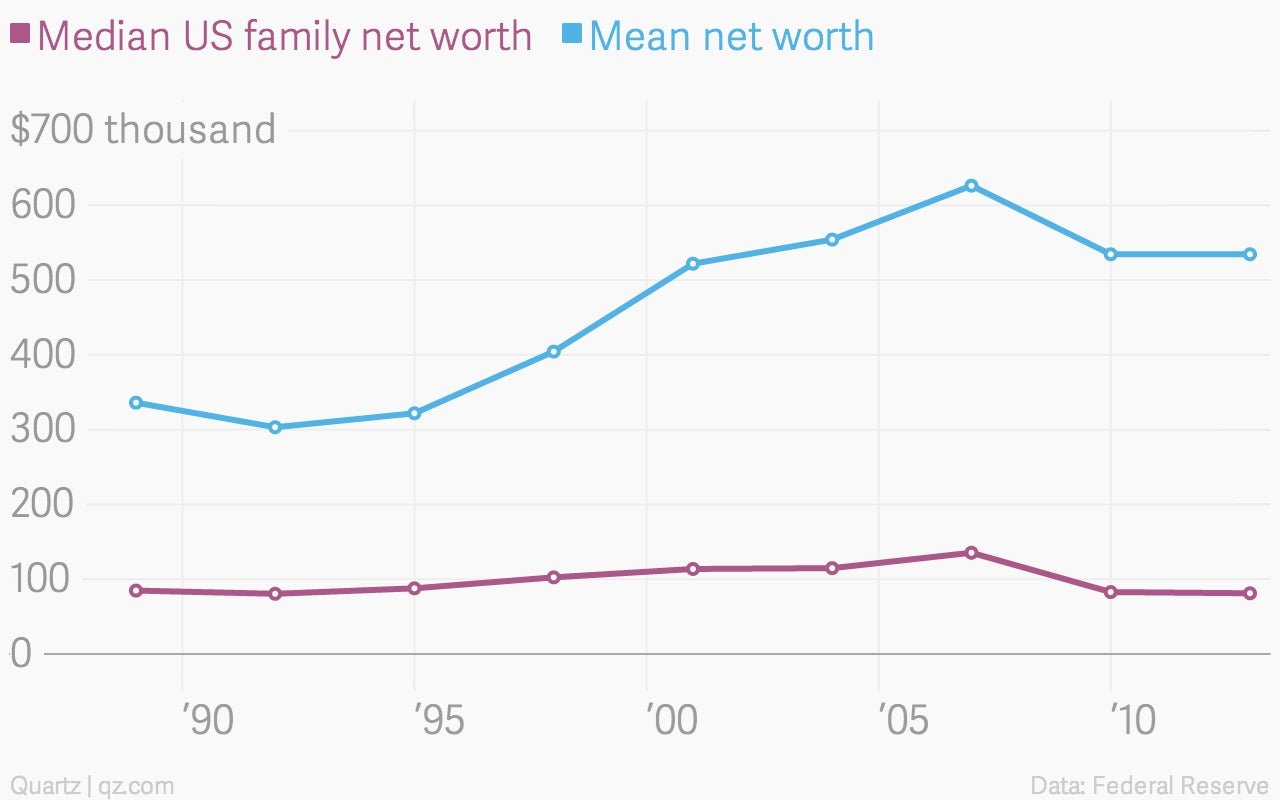
A similar dynamic is at play in the Fed’s analysis of the net worth of American families. On average, this calculation of wealth stayed flat at $535,000. But that was only because the average net worth among those in the top 10% of the wealth distribution saw their net worth rise 2% to more than $3.3 million. The other 90% of the wealth distribution saw their average net worth decline between 2010 and 2013. For a better sense of how a typical family did between 2010 and 2013, look at the median family net worth numbers, which show that net worth fell 2% to $81,200.

None of this is news, of course. But it does reinforce the fact that the dire state of lower-income America is becoming a real issue, both political and economic. (Just check out the sad saga of America’s dollar stores—these discount retailers are unable to generate any durable profit growth from their primarily less-affluent customer base.)
In the recent past, America got around this issue simply by loosening up credit and allowing people to borrow. That didn’t end well.
Low-income America doesn’t need credit. It needs wage growth. A truly healthy economy depends on it.