The week’s 17 most important economic charts
Search
Newsletters
Editions
Home
Latest
Business News
Money & Markets
Tech & Innovation
A.I.
Lifestyle
Leadership
✉️ Emails
🎧 Podcasts
Markets
The week’s 17 most important economic charts
By
Matt Phillips
and
Matt Phillips
Share to X
Share to Facebook
Share to Reddit
Share to Email
Share to Link
Add Quartz on Google
Share to X
Share to Facebook
Share to Reddit
Share to Email
Share to Link
US median incomes remain stuck where they were
nearly 25 years ago
…
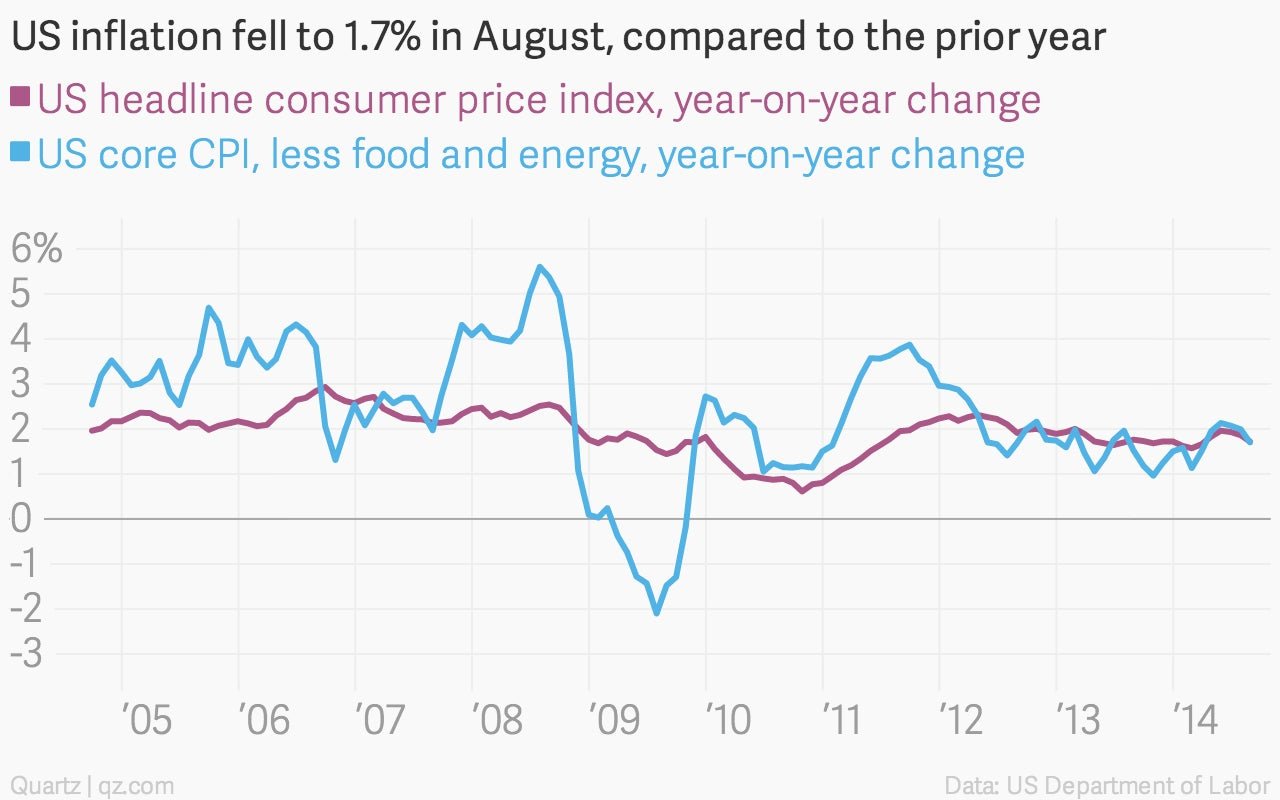
…and US
inflation remains quite muted
The outlook among
US homebuilders is brightening
…
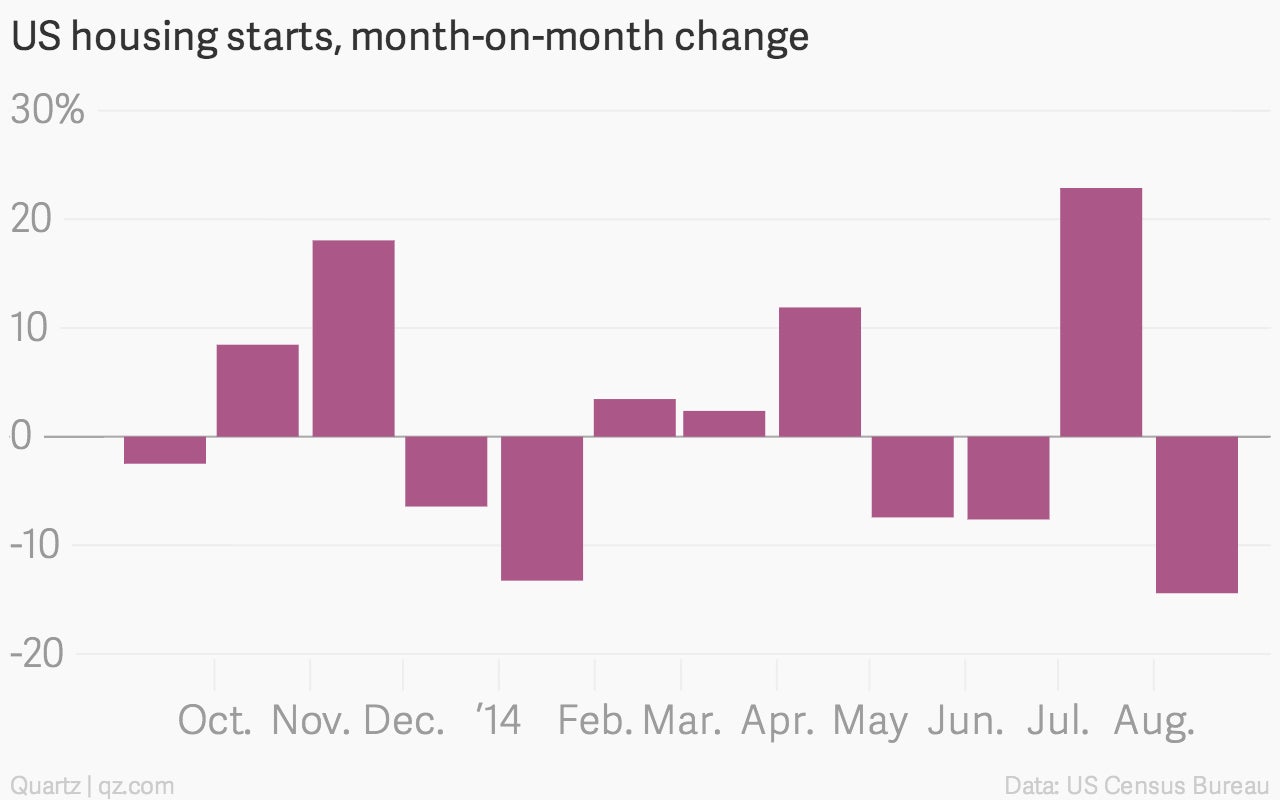
…even though housing starts disappointed in August,
due to weak multifamily housing starts
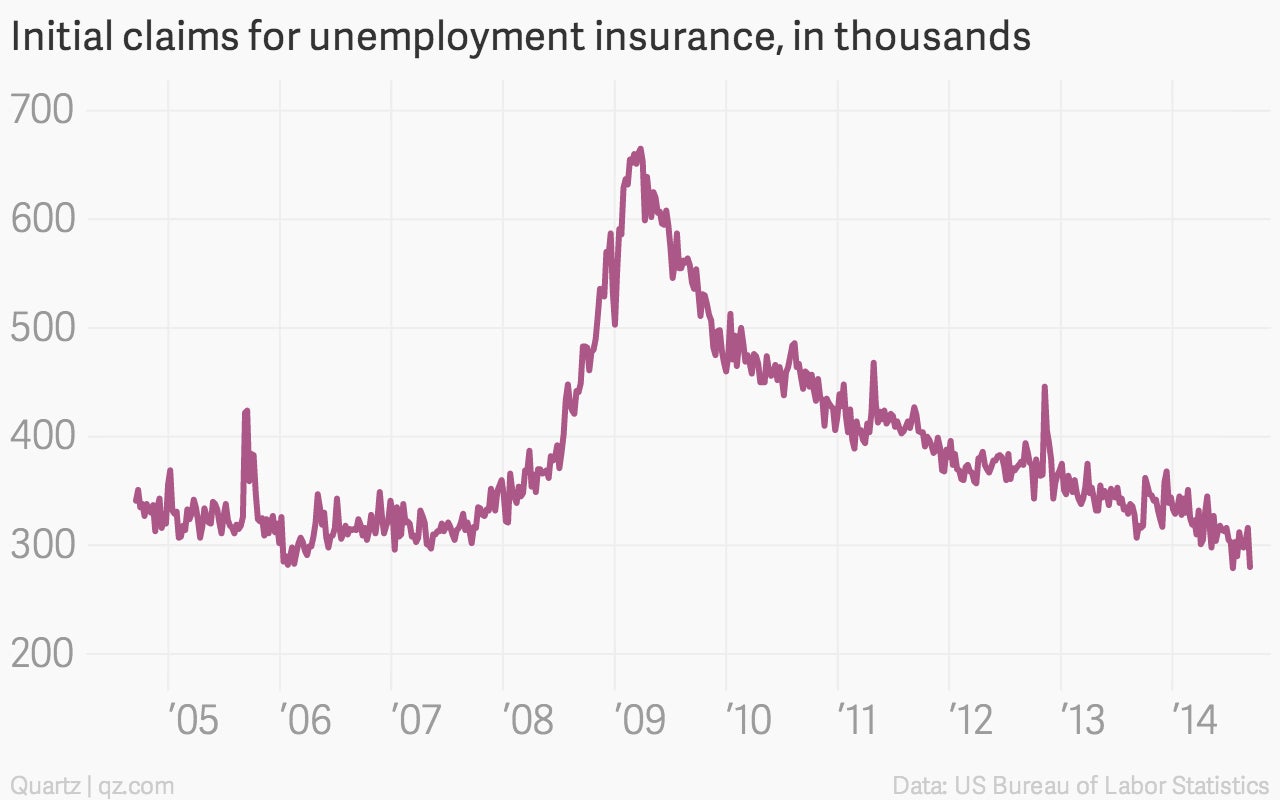
Meanwhile, weekly claims for US unemployment benefits continued to
signal job market strength
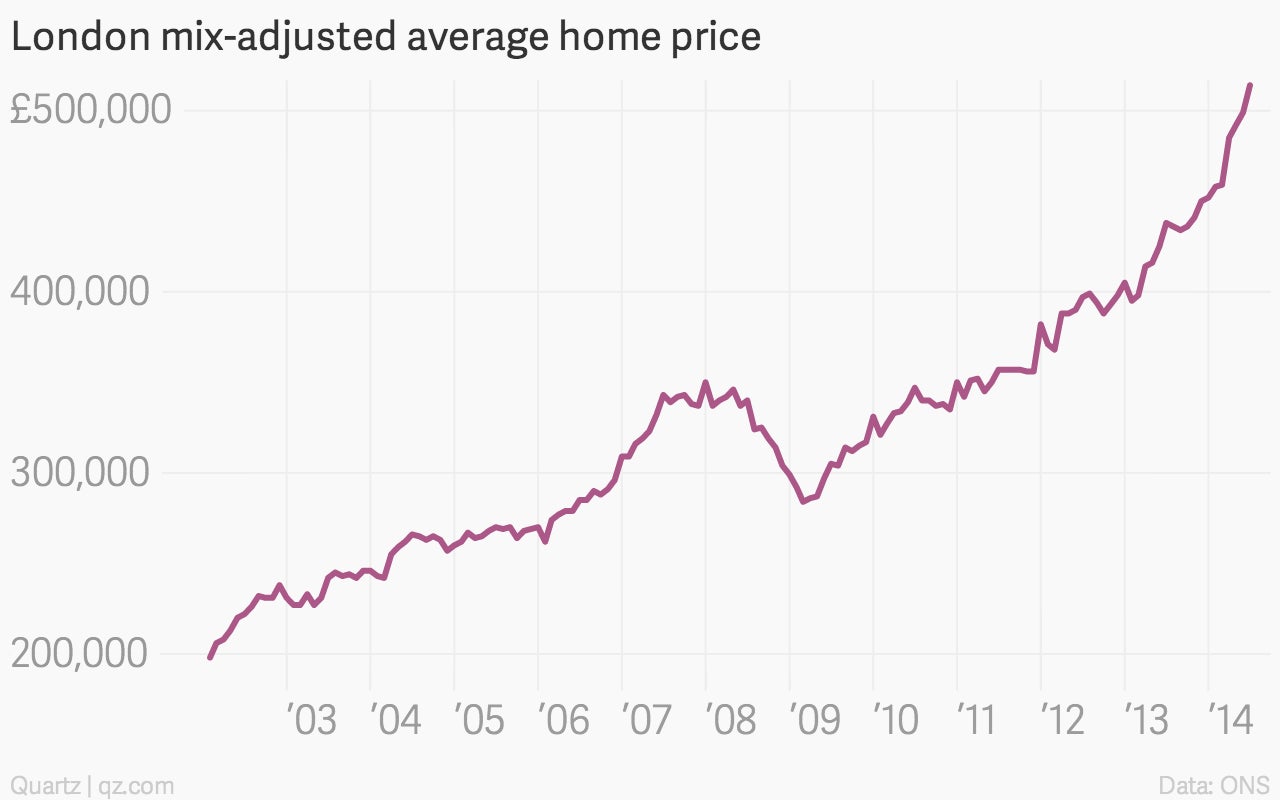
In the UK, London’s
average home price breached £500,000
(more than $815,000)…
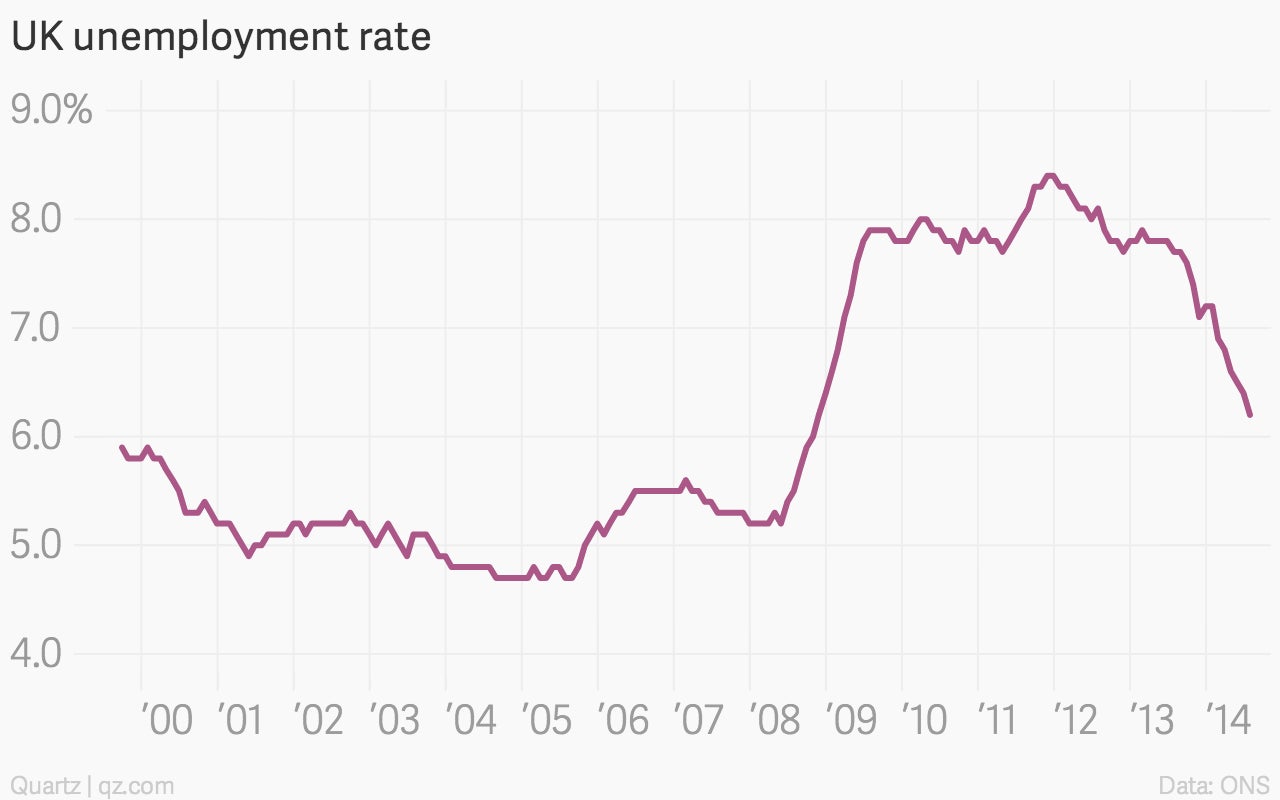
…and British unemployment fell to
its lowest level since 2008
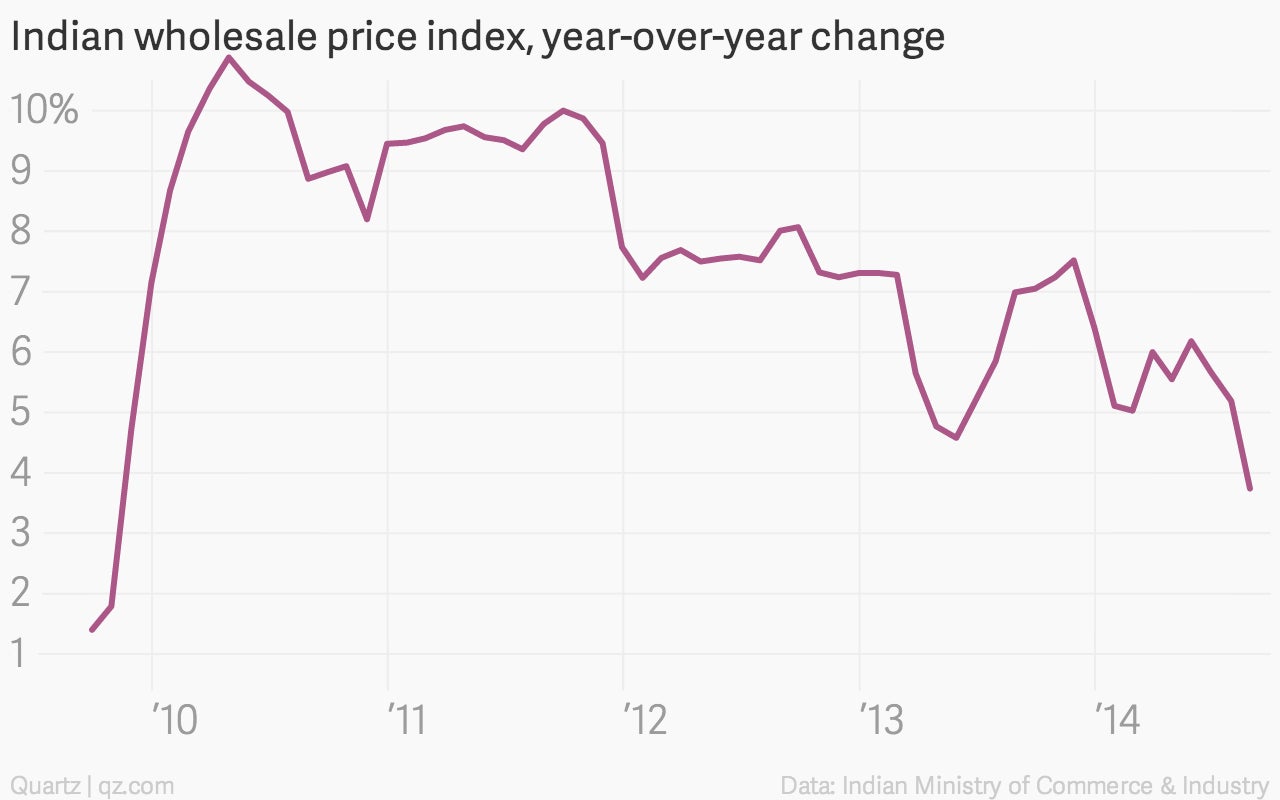
Indian inflation seems to have been tamed,
falling to near five-year lows
In Russia,
unemployment hit a record low
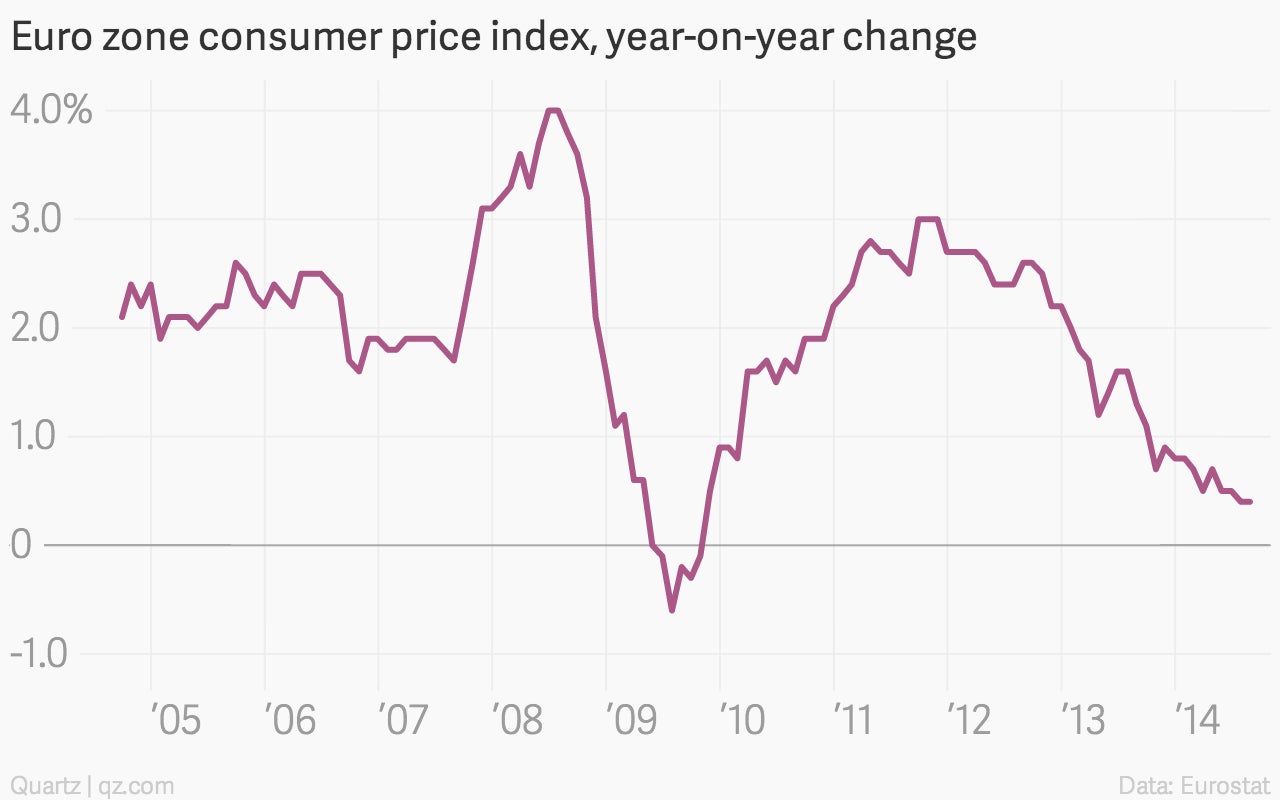
In Europe, final August readings showed
deflation is still a threat
Japan registered its
26th-straight trade deficit
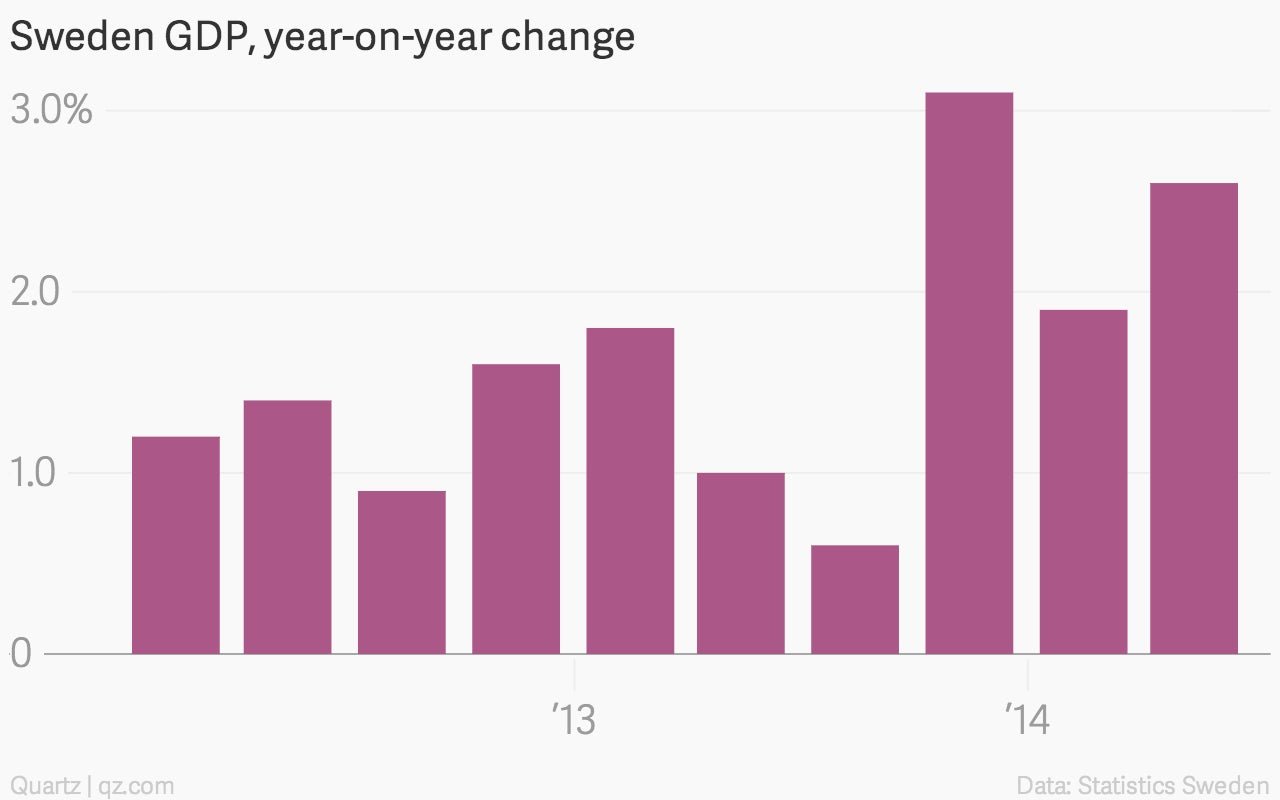
Sweden’s GDP growth was better than expected
in the second quarter
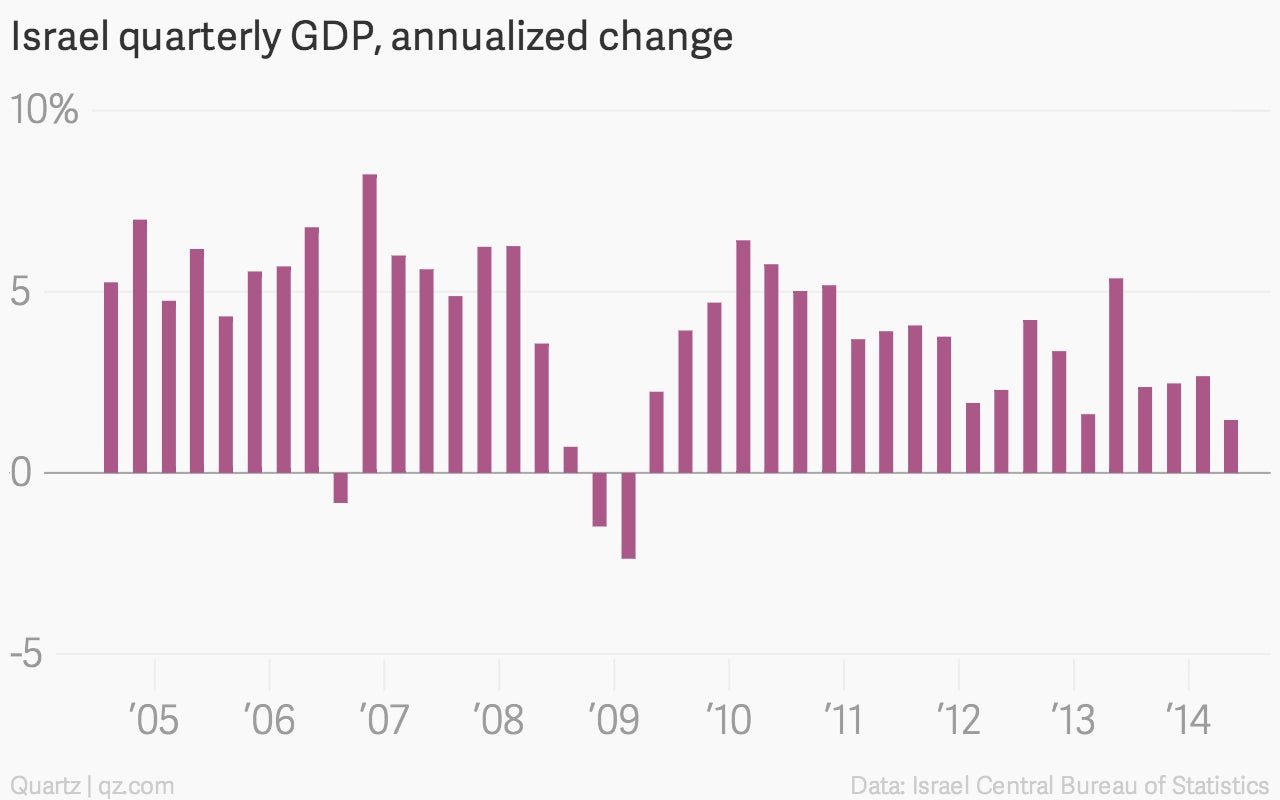
Israel’s second-quarter growth was
softer than first thought
New Zealand’s economy is growing at its
fastest pace in a decade
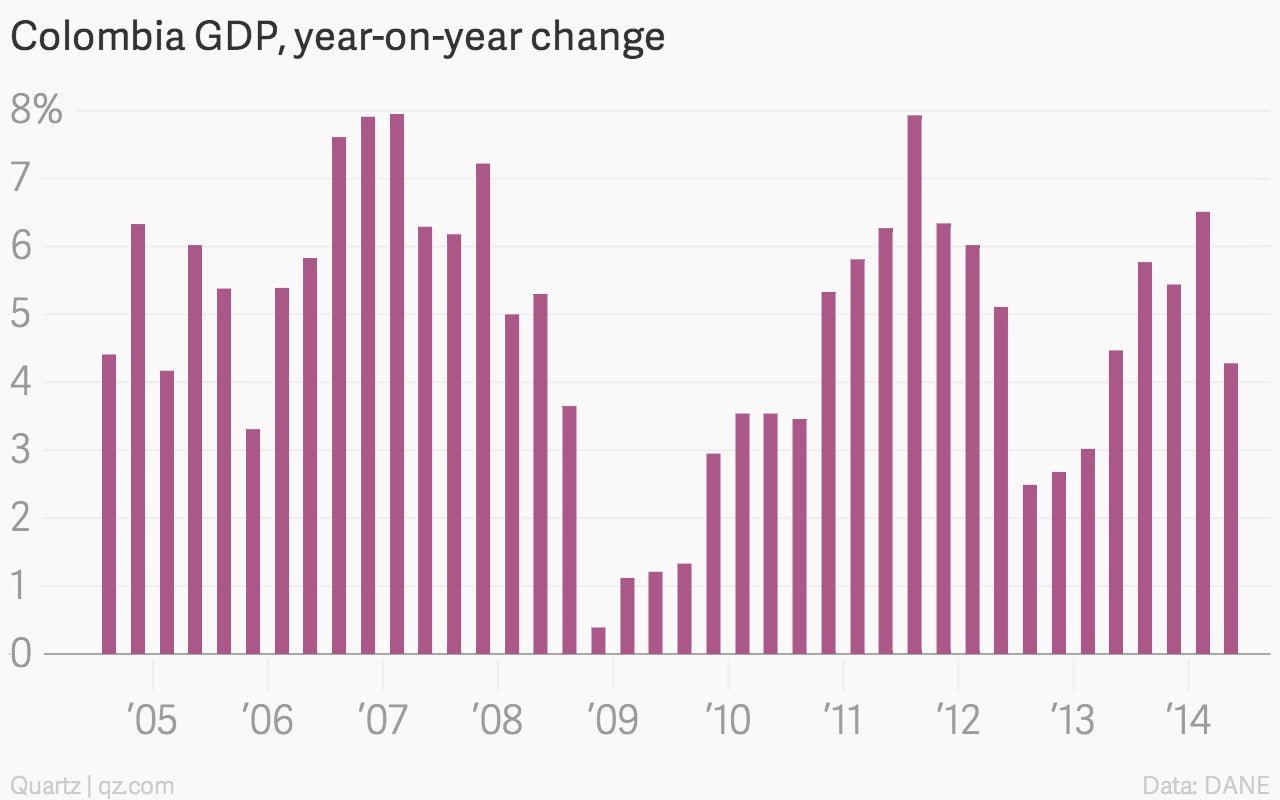
Colombian growth slowed in the second quarter,
thanks to a weak energy sector
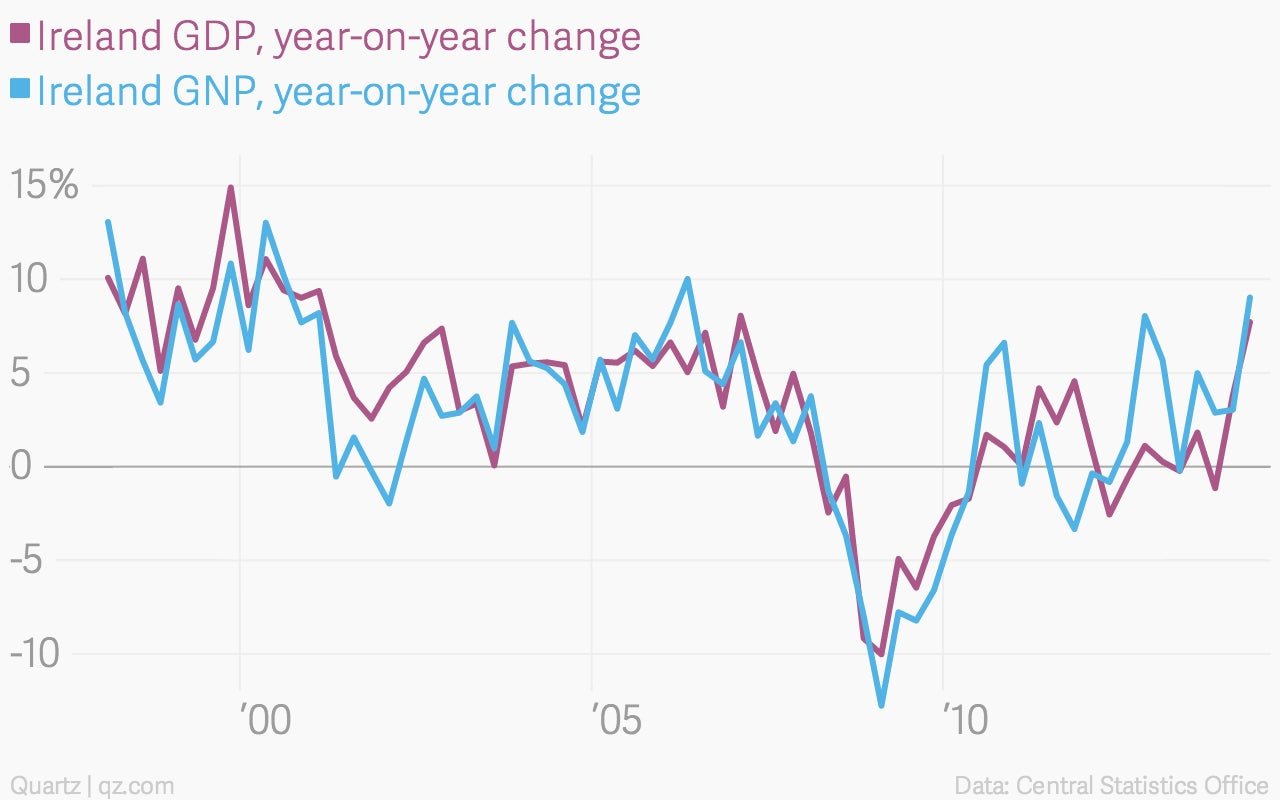
The Irish economy
looks like it is surging
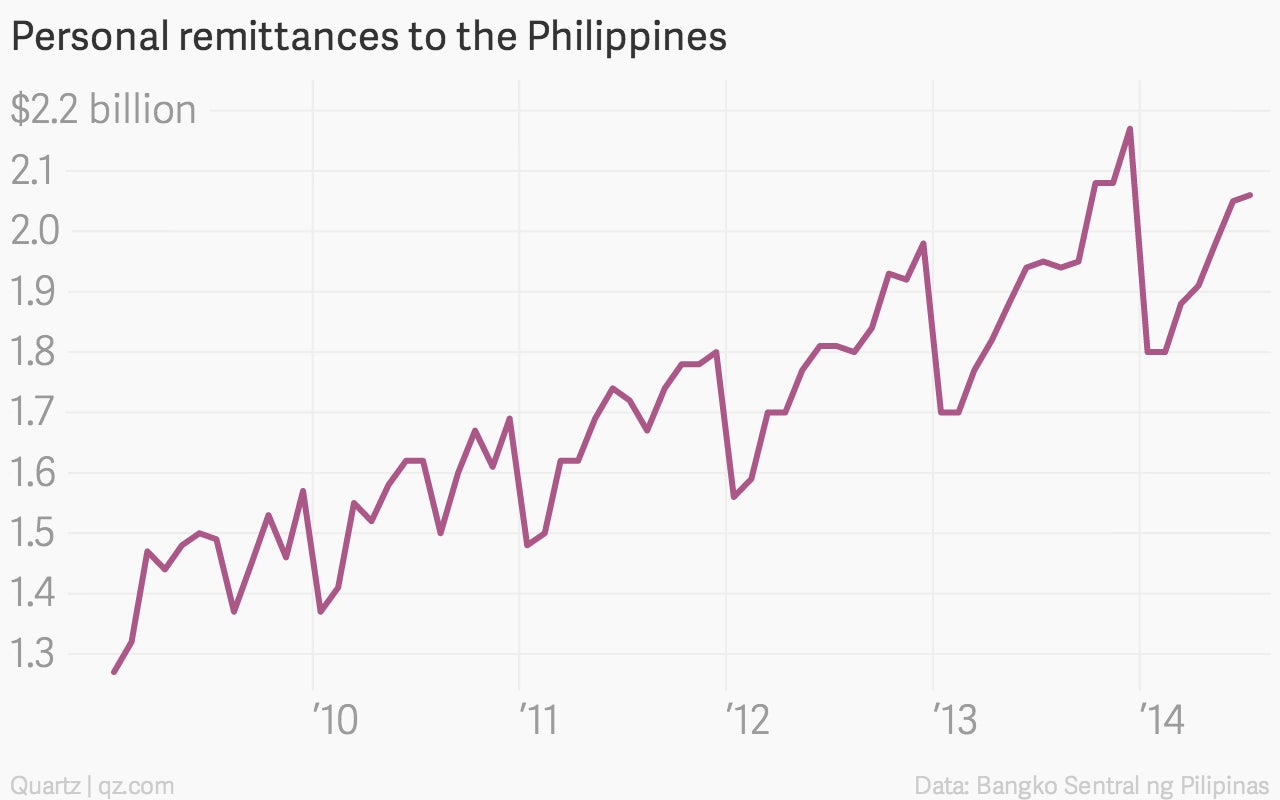
Remittances to the Philippines, the second-largest receiver of the cash flows,
rose 6% year-on-year
📬 Sign up for the Daily Brief
Our free, fast and fun briefing on the global economy, delivered every weekday morning.
Sign me up